
Zastosuj formuły arkusza wykresu w prezentacjach przy użyciu Pythona
Przegląd
PowerPoint charts usually store their source data in an embedded worksheet. In Aspose.Slides for Python via .NET, you can access that worksheet through the chart data workbook, write input values, assign formulas to cells, calculate supported formulas, and use the calculated cells as chart data.
This article explains the complete formula workflow: create a chart, populate its worksheet, assign A1-style or R1C1-style formulas, recalculate them, read the calculated values, connect those cells to a chart series, and save the presentation. It also describes the supported formula syntax, the built-in function subset, cached values, unsupported formulas, and spreadsheet-specific errors.
Arkusze wykresów i formuły
A chart worksheet contains the categories, series names, and values used by a chart. In PowerPoint, you can inspect the worksheet by opening the chart data editor:
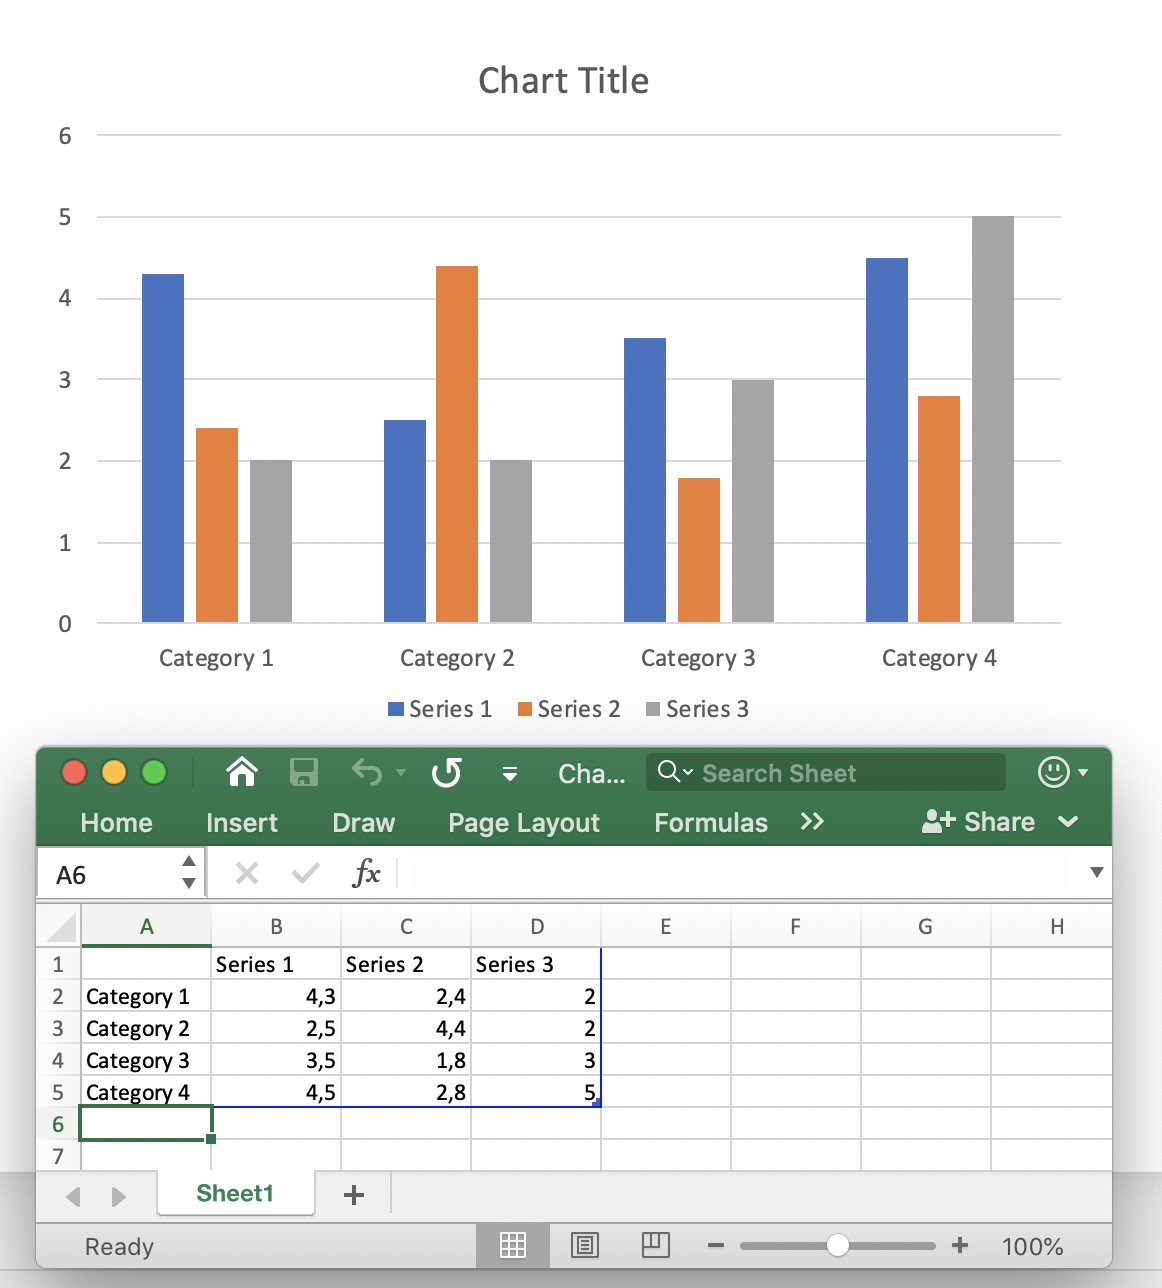
In Aspose.Slides, the worksheet is exposed through the skoroszyt danych wykresu. Use the formula property for A1-style formulas and the r1c1_formula property for R1C1-style formulas. After changing input cells or formulas, call calculate_formulas to recalculate supported formulas and update the corresponding cell values.
A calculated cell still exposes its result through the value property. This is important when you need to inspect a formula result in code or use the cell as a chart data point.
Utwórz wykres i oblicz formuły w arkuszu
The following example demonstrates an end-to-end workflow. It creates a clustered column chart, clears the sample data, writes quarterly revenue and expense values, calculates profit with formulas, reads the results, uses the calculated cells as chart values, and saves the presentation.
import aspose.slides as slides
import aspose.slides.charts as charts

with slides.Presentation() as presentation:
    slide = presentation.slides[0]
    chart = slide.shapes.add_chart(charts.ChartType.CLUSTERED_COLUMN, 50, 50, 600, 350)
    workbook = chart.chart_data.chart_data_workbook
    worksheet_index = 0

    chart.chart_data.series.clear()
    chart.chart_data.categories.clear()
    workbook.clear(worksheet_index)

    category1 = workbook.get_cell(worksheet_index, "A2", "Q1")
    category2 = workbook.get_cell(worksheet_index, "A3", "Q2")
    category3 = workbook.get_cell(worksheet_index, "A4", "Q3")

    workbook.get_cell(worksheet_index, "B1", "Revenue")
    workbook.get_cell(worksheet_index, "C1", "Expenses")
    workbook.get_cell(worksheet_index, "D1", "Profit")

    workbook.get_cell(worksheet_index, "B2").value = 120.0
    workbook.get_cell(worksheet_index, "C2").value = 80.0
    workbook.get_cell(worksheet_index, "B3").value = 150.0
    workbook.get_cell(worksheet_index, "C3").value = 95.0
    workbook.get_cell(worksheet_index, "B4").value = 135.0
    workbook.get_cell(worksheet_index, "C4").value = 110.0

    profit1 = workbook.get_cell(worksheet_index, "D2")
    profit2 = workbook.get_cell(worksheet_index, "D3")
    profit3 = workbook.get_cell(worksheet_index, "D4")

    profit1.formula = "B2-C2"
    profit2.formula = "B3-C3"
    profit3.formula = "B4-C4"

    workbook.calculate_formulas()

    q1_profit = profit1.value  # 40
    q2_profit = profit2.value  # 55
    q3_profit = profit3.value  # 25

    print(f"Q1 profit: {q1_profit}")
    print(f"Q2 profit: {q2_profit}")
    print(f"Q3 profit: {q3_profit}")

    chart.chart_data.categories.add(category1)
    chart.chart_data.categories.add(category2)
    chart.chart_data.categories.add(category3)

    profit_series = chart.chart_data.series.add(workbook.get_cell(worksheet_index, "D1"), chart.type)
    profit_series.data_points.add_data_point_for_bar_series(profit1)
    profit_series.data_points.add_data_point_for_bar_series(profit2)
    profit_series.data_points.add_data_point_for_bar_series(profit3)
    profit_series.labels.default_data_label_format.show_value = True

    presentation.save("chart-formulas.pptx", slides.export.SaveFormat.PPTX)
The chart data points reference D2:D4, so the chart uses the calculated profit values. There is no separate chart-refresh call in this workflow: recalculate the workbook first, then use or save the chart data that points to the calculated cells.
Używanie formuł w stylu A1
A1 notation identifies columns with letters and rows with numbers. Assign A1-style expressions through IChartDataCell.formula.
import aspose.slides as slides
import aspose.slides.charts as charts

with slides.Presentation() as presentation:
    slide = presentation.slides[0]
    chart = slide.shapes.add_chart(charts.ChartType.CLUSTERED_COLUMN, 50, 50, 500, 300)
    workbook = chart.chart_data.chart_data_workbook

    workbook.get_cell(0, "C3").value = 10
    workbook.get_cell(0, "F2").value = 2
    workbook.get_cell(0, "G2").value = 3
    workbook.get_cell(0, "H2").value = 4

    cell = workbook.get_cell(0, "A2")
    cell.formula = "C3+SUM(F2:H2)"

    workbook.calculate_formulas()

    value = cell.value  # 19
Common A1 reference forms are:
| Odwołanie | Względny | Bezwzględny | Mieszany |
|---|---|---|---|
| Komórka | A2 |
$A$2 |
A$2, $A2 |
| Wiersz | 2:2 |
$2:$2 |
— |
| Kolumna | A:A |
$A:$A |
— |
| Zakres | A2:C4 |
$A$2:$C$4 |
A$2:$C4, $A2:C$4 |
Relative references can change when a formula is moved or copied by a spreadsheet application. Absolute references keep both coordinates fixed, while mixed references fix only a row or a column.
Używanie formuł w stylu R1C1
R1C1 notation identifies both rows and columns numerically. Relative references use offsets in square brackets. Assign this syntax through IChartDataCell.r1c1_formula.
import aspose.slides as slides
import aspose.slides.charts as charts

with slides.Presentation() as presentation:
    slide = presentation.slides[0]
    chart = slide.shapes.add_chart(charts.ChartType.CLUSTERED_COLUMN, 50, 50, 500, 300)
    workbook = chart.chart_data.chart_data_workbook

    workbook.get_cell(0, "B2").value = 12
    workbook.get_cell(0, "C2").value = 5

    cell = workbook.get_cell(0, "D2")
    cell.r1c1_formula = "RC[-2]-RC[-1]"

    workbook.calculate_formulas()

    value = cell.value  # 7
Common R1C1 reference forms are:
| Odwołanie | Względny | Bezwzględny | Mieszany |
|---|---|---|---|
| Komórka | R[2]C[3] |
R2C3 |
R2C[3], R[2]C3 |
| Wiersz | R[2] |
R2 |
— |
| Kolumna | C[3] |
C3 |
— |
| Zakres | R[2]C[3]:R[5]C[7] |
R2C3:R5C7 |
R2C3:R[5]C[7], R[2]C3:R5C[7] |
For example, in cell D2, RC[-2] means the cell in the same row two columns to the left (B2).
Stałe i operatory formuł
The built-in formula evaluator supports logical values, numeric literals, strings, spreadsheet error values, arithmetic operators, and comparison operators.
Stałe i literały
| Typ | Przykłady | Uwagi |
|---|---|---|
| Logiczny | TRUE, FALSE |
Może być używany bezpośrednio w wyrażeniach logicznych, np. A2=TRUE. |
| Numeryczny | 1, 0.5, .3, 1E-2 |
Obsługiwana jest notacja zwykła i naukowa. |
| Ciąg | "abc", "2/3/2020 12:00" |
Literały tekstowe są umieszczane w podwójnych cudzysłowach wewnątrz formuły. |
| Wynik błędu | #DIV/0!, #N/A, #REF! |
Poprawna formuła może zwrócić wartość błędu arkusza zamiast normalnego wyniku. |
This example uses several constant types:
import aspose.slides as slides
import aspose.slides.charts as charts

with slides.Presentation() as presentation:
    slide = presentation.slides[0]
    chart = slide.shapes.add_chart(charts.ChartType.CLUSTERED_COLUMN, 50, 50, 500, 300)
    workbook = chart.chart_data.chart_data_workbook

    workbook.get_cell(0, "A2").value = False
    workbook.get_cell(0, "B2").formula = "A2=TRUE"
    workbook.get_cell(0, "C2").formula = "1+0.5"
    workbook.get_cell(0, "D2").formula = ".3*1E-2"
    workbook.get_cell(0, "E2").formula = "\"abc\""
    workbook.get_cell(0, "F2").formula = "2/0"

    workbook.calculate_formulas()

    logical_value = workbook.get_cell(0, "B2").value  # False
    numeric_value = workbook.get_cell(0, "C2").value  # 1.5
    scientific_value = workbook.get_cell(0, "D2").value  # 0.003
    string_value = workbook.get_cell(0, "E2").value  # abc
    error_value = workbook.get_cell(0, "F2").value  # #DIV/0!
Operatory arytmetyczne
| Operator | Znaczenie | Przykład |
|---|---|---|
+ |
Dodawanie lub operator jedynkowy | 2+3 |
- |
Odejmowanie lub negacja | 2-3, -3 |
* |
Mnożenie | 2*3 |
/ |
Dzielenie | 2/3 |
% |
Procent | 30% |
^ |
Potęgowanie | 2^3 |
Use parentheses to make evaluation order explicit, for example (A2+B2)*C2.
Operatory porównania
Comparison expressions return logical values.
| Operator | Znaczenie | Przykład |
|---|---|---|
= |
Równe | A2=3 |
<> |
Nierówne | A2<>3 |
> |
Większe niż | A2>3 |
>= |
Większe lub równe | A2>=3 |
< |
Mniejsze niż | A2<3 |
<= |
Mniejsze lub równe | A2<=3 |
Obsługiwane funkcje wbudowane
Aspose.Slides includes a built-in formula evaluator for chart worksheets, but it is not a complete Excel calculation engine. The documented function set is limited to the functions below. Do not assume that an arbitrary Excel function can be recalculated by calculate_formulas.
| Funkcja | Cel lub obsługiwana forma | Przykład |
|---|---|---|
ABS |
wartość bezwzględna | ABS(A2) |
AVERAGE |
średnia arytmetyczna | AVERAGE(B2:B5) |
CEILING |
Zaokrągla liczbę w górę do wielokrotności | CEILING(A2,5) |
CHOOSE |
Wybiera wartość według indeksu | CHOOSE(A2,"Low","High") |
CONCAT |
Łączy wartości tekstowe | CONCAT(A2,B2) |
CONCATENATE |
Łączy wartości tekstowe | CONCATENATE(A2," ",B2) |
DATE |
Tworzy wartość daty przy użyciu systemu dat 1900 | DATE(2026,8,19) |
DAYS |
Zwraca liczbę dni między datami | DAYS(B2,A2) |
FIND |
Znajduje jedną wartość tekstową w innej | FIND("-",A2) |
FINDB |
Wyszukiwanie tekstu orientowane na bajty | FINDB("a",A2) |
IF |
Wynik warunkowy | IF(A2>0,A2,0) |
INDEX |
Forma odwołania | INDEX(A2:C4,2,3) |
LOOKUP |
Forma wektorowa | LOOKUP(A2,B2:B5,C2:C5) |
MATCH |
Forma wektorowa | MATCH(A2,B2:B5,0) |
MAX |
Wartość maksymalna | MAX(B2:B5) |
SUM |
Suma wartości | SUM(B2:B5) |
VLOOKUP |
Wyszukiwanie w pionie | VLOOKUP(A2,B2:D10,3,FALSE) |
The restrictions shown in the table are significant: INDEX is documented in reference form, while LOOKUP and MATCH are documented in their vector forms. DATE uses the 1900 date system. Features and functions not listed here should be treated as unsupported by the Aspose.Slides formula evaluator unless they are documented separately.
Obliczanie formuł z preferowaną kulturą
Some chart workbook functions interpret text according to culture-specific rules. This is especially important for functions intended for languages that use double-byte character sets (DBCS). To calculate such formulas correctly, create LoadOptions, set SpreadsheetOptions.preferred_culture through LoadOptions.spreadsheet_options, and then load the presentation.
The following example selects the Japanese culture, opens a presentation with the configured load options, and calls ChartDataWorkbook.calculate_formulas for every chart workbook:
import aspose.slides as slides
import aspose.slides.charts as charts

load_options = slides.LoadOptions()
load_options.spreadsheet_options.preferred_culture = "ja-JP"

with slides.Presentation("presentation.pptx", load_options) as presentation:
    for slide in presentation.slides:
        for shape in slide.shapes:
            if isinstance(shape, charts.Chart):
                shape.chart_data.chart_data_workbook.calculate_formulas()
The preferred culture is part of the presentation loading configuration, so specify it before creating the Presentation instance. Use the culture expected by the workbook formulas; for example, use ja-JP for formulas that should follow Japanese DBCS calculation rules.
Przeliczanie i wartości buforowane
Spreadsheet files commonly store both a formula and its last calculated value. Aspose.Slides can therefore read a cached value from IChartDataCell.value when a presentation is loaded and the relevant chart data has not been changed.
After changing input cells or formulas, do not rely on an old cached result. Call ChartDataWorkbook.calculate_formulas before reading calculated values or saving chart data that depends on them.
For formulas outside the supported subset, Aspose.Slides may be unable to parse the formula or establish its dependencies. If the workbook has been modified, the previous cached value can no longer be considered reliable. In that situation, reading the value of a cell with unsupported data can raise CellUnsupportedDataException.
If your chart depends on Excel functions that Aspose.Slides does not evaluate, calculate those formulas with a spreadsheet engine that supports them and write the resulting values back to the chart workbook. Do not replace unsupported formulas with guessed values.
Obsługa błędów formuł
There are two different kinds of problems to distinguish.
A formula can be valid but produce a spreadsheet error result such as #DIV/0!, #N/A, #NAME?, #NULL!, #NUM!, #REF!, or #VALUE!. In this case, the error token is a cell result and can be returned through value.
A formula can also fail at the parsing, reference, dependency, or supported-data level. Aspose.Slides provides spreadsheet-specific exceptions for these cases: CellInvalidFormulaException, CellInvalidReferenceException, CellCircularReferenceException, and CellUnsupportedDataException.
When formulas come from templates or user input, handle these exceptions around recalculation and value access:
import aspose.slides as slides
import aspose.slides.charts as charts
import aspose.slides.spreadsheet as spreadsheet

with slides.Presentation() as presentation:
    slide = presentation.slides[0]
    chart = slide.shapes.add_chart(charts.ChartType.CLUSTERED_COLUMN, 50, 50, 500, 300)
    workbook = chart.chart_data.chart_data_workbook
    cell = workbook.get_cell(0, "A2")
    cell.formula = "SUM(B2:B5)"

    try:
        workbook.calculate_formulas()
        print(cell.value)
    except spreadsheet.CellInvalidFormulaException as ex:
        print(f"Invalid formula: {ex}")
    except spreadsheet.CellInvalidReferenceException as ex:
        print(f"Invalid cell reference: {ex}")
    except spreadsheet.CellCircularReferenceException as ex:
        print(f"Circular reference: {ex}")
    except spreadsheet.CellUnsupportedDataException as ex:
        print(f"Unsupported spreadsheet data: {ex}")
Ograniczenia praktyczne
The formula support in chart worksheets is intended for a defined subset of spreadsheet calculations, not for full Excel compatibility. Keep these constraints in mind when designing a reporting workflow:
- Use only the documented constants, operators, references, and functions when you need Aspose.Slides to recalculate formulas.
- Recalculate after changing cells that formula results depend on.
- Treat cached values from loaded presentations as snapshots, not as a replacement for recalculation after edits.
- Test formulas from existing templates before relying on their calculated values, especially when they use functions outside the documented list.
- For formulas that require a full spreadsheet calculation engine, calculate them externally and then update the chart workbook with the resulting values.
FAQ
Jaka jest różnica między formula a r1c1_formula?
[formula] przechowuje wyrażenie w stylu A1, takie jak B2-C2. [r1c1_formula] przechowuje wyrażenie w stylu R1C1, takie jak RC[-2]-RC[-1]. Użyj notacji, która najlepiej odpowiada temu, jak generujesz lub kopiujesz formuły.
Czy po obliczeniu powinienem odczytać samą komórkę, czy jej wartość?
[ChartDataWorkbook.get_cell] zwraca IChartDataCell. Aby uzyskać obliczony wynik, odczytaj właściwość [value] tej komórki po przeliczeniu.
Kiedy powinienem wywołać calculate_formulas?
Wywołaj [calculate_formulas] po zmianie wartości wejściowych lub formuł i przed tym, gdy zależysz od obliczonych wyników. To aktualizuje wartości formuł obsługiwanych przez wbudowany evaluator.
Czy Aspose.Slides obsługuje każdą funkcję Excel?
Nie. Wbudowany evaluator obsługuje udokumentowany podzbiór funkcji. Funkcje spoza tego podzbioru nie powinny być traktowane jako prawidłowo przeliczane. Jeśli wymagana jest pełna kompatybilność formuł Excel, wykonaj obliczenia przy użyciu odpowiedniego silnika arkusza kalkulacyjnego i zapisz ostateczne wartości w skoroszycie wykresu.
Co się stanie, jeśli wczytana prezentacja zawiera nieobsługiwaną formułę?
Jeśli dane wykresu nie zostały zmienione, skoroszyt może nadal zawierać wcześniej obliczoną wartość buforowaną. Po modyfikacji powiązanych danych ta wartość buforowana może przestać być ważna. Próba odczytu komórki, której formuła nie może być obsłużona, może spowodować wyrzucenie [CellUnsupportedDataException].
Czy wartości błędów formuł są tym samym co wyjątki Pythona?
Nie. Wynik taki jak #DIV/0! jest wartością arkusza uzyskaną w wyniku prawidłowego obliczenia. Wyjątki, takie jak [CellInvalidFormulaException] czy [CellCircularReferenceException], wskazują, że formuła nie może być przetworzona w normalny sposób.
Czy wykres aktualizuje się automatycznie, gdy zmieni się komórka z formułą?
Seria wykresu może odwoływać się do komórek skoroszytu. Najpierw przelicz skoroszyt, a następnie zapisz lub renderuj prezentację. Jeśli punkty danych wykresu odwołują się do obliczonych komórek, wykres wykorzysta zaktualizowane wartości; nie jest wymagane osobne wywołanie odświeżania wykresu w tym przepływie.
Czy wykresy mogą używać zewnętrznego skoroszytu Excel?
Tak, dane wykresu można skonfigurować do używania zewnętrznego skoroszytu poprzez API danych wykresu. Jednak opisany w tym artykule przepływ obliczania formuł dotyczy skoroszytu danych wykresu oraz podzbioru formuł ocenianych przez Aspose.Slides. Nie zakładaj, że [calculate_formulas] zapewnia pełne przeliczenie dowolnych formuł w zewnętrznym pliku XLSX.
Czy mogę używać formuł odwołujących się do innego arkusza lub skoroszytu?
Odwołania w stylu Excel mogą występować w skoroszytach wykresów, ale ocena formuł jest ograniczona przez obsługiwany parser i zestaw funkcji. Jeśli odwołanie między arkuszami lub zewnętrzne jest niezbędne, zweryfikuj tę konkretną formułę w wersji Aspose.Slides, której używasz. Dla przepływów wymagających szerokiej kompatybilności odwołań Excel, oblicz skoroszyt zewnętrznie i zapisz rozwiązywane wartości z powrotem do danych wykresu.
Czy ciągi formuł powinny zaczynać się od =?
Przykłady API Aspose.Slides przypisują wyrażenia takie jak B2-C2 lub SUM(B2:B5) bez wiodącego =. Używanie tej formy utrzymuje generowane formuły zgodne z udokumentowanymi przykładami API.