Analyzing your prompt, please hold on...
An error occurred while retrieving the results. Please refresh the page and try again.
Labels provide a means for giving information to users about a spreadsheet’s content. Aspose.Cells allows you to add and manipulate labels even within charts.
The ShapeCollection class provides a method named addLabelInChart, used to add a label control to a chart. Below is a list of the parameters used for the method:
The method returns an object of the Label class, where the Label class represents a label in the chart. It has some important members as detailed below:
The following example shows how to add a label to the chart. The example uses a designer file which has a chart in it. We use this file to insert a label into the chart.
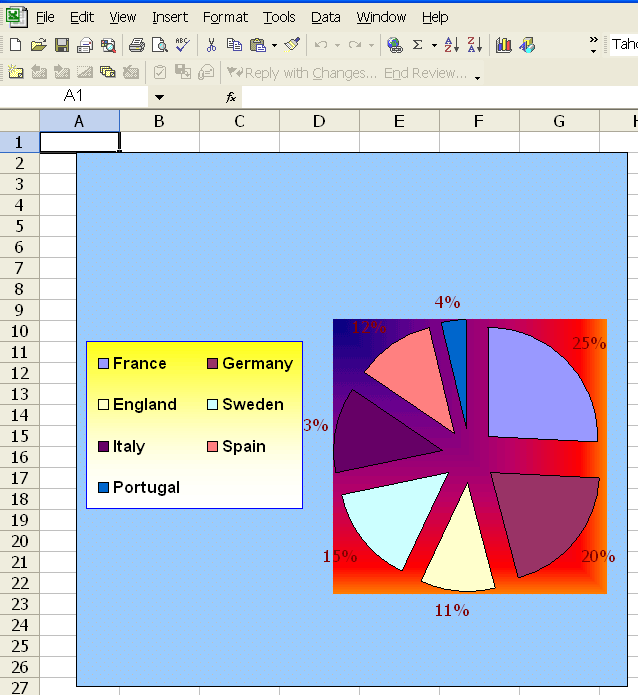
Below is a screenshot of the designer file.
The designer chart
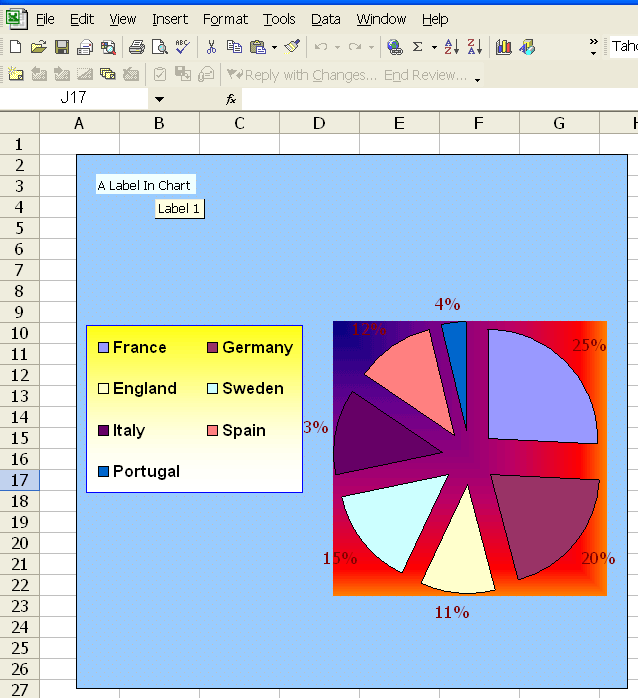
Below is the original code for adding a label to the chart. The following output is generated when executing the code.
A label is added in the chart
One way to highlight important information in a report is to use a text box. For example, enter text to highlight the company name or to indicate the geographic region with the highest sales. The ShapeCollection class provides a method named addTextBoxInChart, which is used to add a text box control to a chart. Following is the parameters list used for the method:
The method returns an object of the TextBox class where the TextBox class represents a text box in the chart.
The following example shows how to add a text box to a chart. The example uses the previous designer file which has a chart in it. We use this file to insert a text box into the chart to show the chart title.
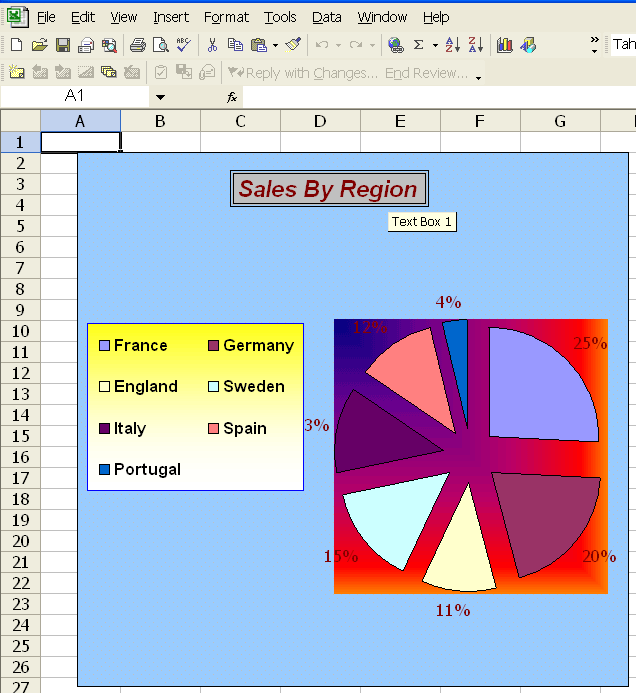
Below is the original code for adding a text box to the chart. The following output is generated when executing the code.
A text box is added in the chart
Aspose.Cells allows you to insert images into a chart. For example, add a picture to emphasize or give more meaning to a chart or its contents, or insert a brand image file.
The ShapeCollection class provides a method named addPictureInChart, which is used to add a picture object to the chart. Following is the parameters list used for the method:
The method returns an object of the Picture class where the Picture class represents a picture object in the chart.
The following example shows how to add a picture to the chart. The example utilizes the previous designer file which has a chart in it. We use this file to insert an image into the chart.
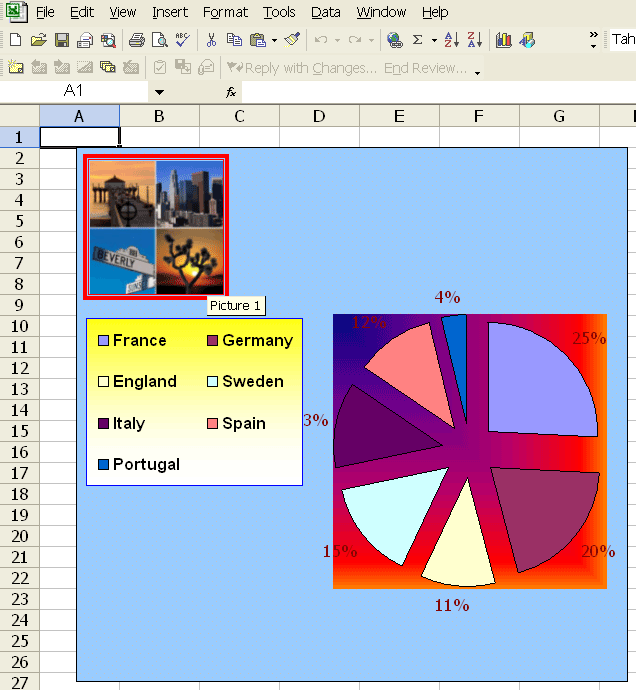
Below is the original code for adding a picture to the chart. The following output is generated when executing the code.
A picture is inserted into the chart
Aspose.Cells allows you to insert checkboxes into a chart sheet by using MsoDrawingType enumeration. The following example demonstrates adding a checkbox to a chart sheet.
The following image shows the chart sheet with the checkbox in the output file.
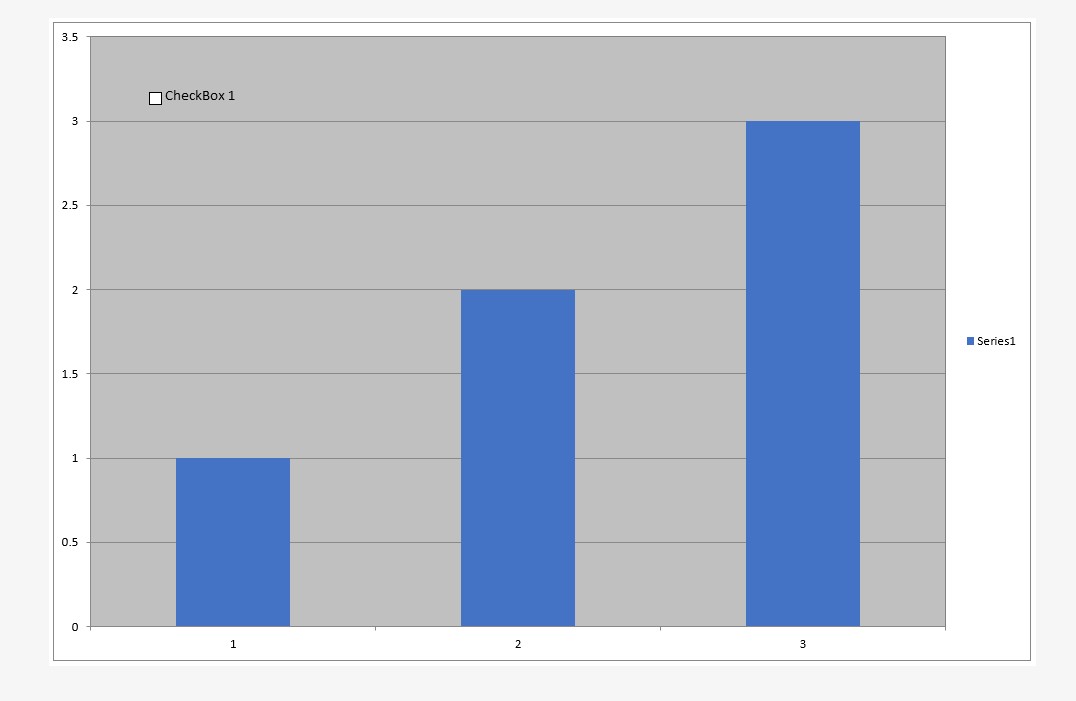
The output file generated by the following code snippet is attached for your reference.
Analyzing your prompt, please hold on...
An error occurred while retrieving the results. Please refresh the page and try again.