Analyzing your prompt, please hold on...
An error occurred while retrieving the results. Please refresh the page and try again.
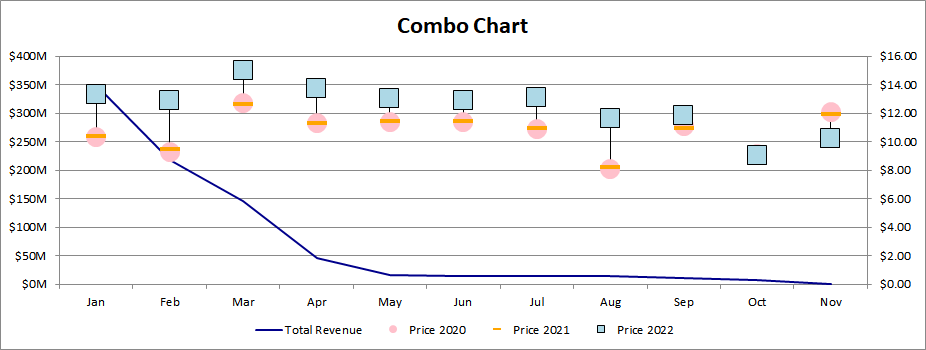
Combo charts in Excel allow you to combine two or more chart types easily, making your data more understandable. Combo charts are helpful when your data contains multiple kinds of values, including price and volume. Moreover, combo charts are useful when the values vary widely from series to series.
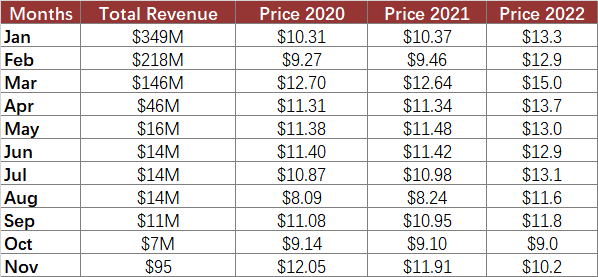
Taking the following dataset as an example, we can see that it is quite similar to the data mentioned in VHCL. If we want to visualize series0, which corresponds to “Total Revenue,” as a line chart, how should we proceed?
After running the code below, you will see the combo chart as shown.
The following sample code loads the sample Excel file and generates the output Excel file.
Analyzing your prompt, please hold on...
An error occurred while retrieving the results. Please refresh the page and try again.