
Android पर प्रस्तुतियों में चार्ट डेटा श्रृंखलाओं का प्रबंधन
परिचय
एक चार्ट अपने प्लॉट किए गए डेटा को चार्ट डेटा वर्कबुक में संग्रहीत करता है। एक IChartSeries संबंधित मानों के एक सेट का प्रतिनिधित्व करता है, और श्रृंखला में प्रत्येक IChartDataPoint एक या अधिक वर्कबुक सेल्स को संदर्भित करता है। IChartCategory वस्तुएँ श्रृंखला द्वारा साझा किए जाने वाले लेबल या समूह मान प्रदान करती हैं। इसलिए श्रृंखला का नाम, श्रेणियाँ, और बिंदु मान IChartDataCell वस्तुओं से जुड़े होते हैं, न कि केवल प्रदर्शित पाठ के रूप में संग्रहीत।
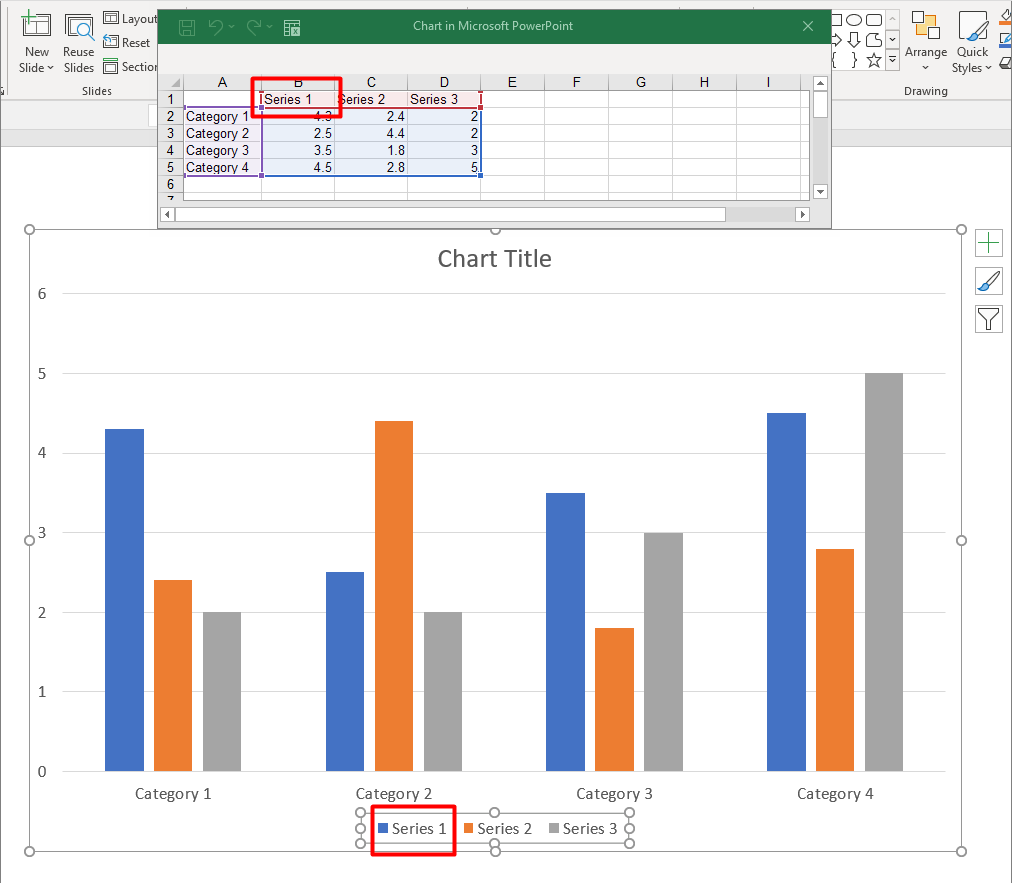
एक सामान्य श्रेणी चार्ट के लिए, डिफ़ॉल्ट वर्कबुक श्रृंखला नामों के लिए पंक्ति 0, श्रेणी नामों के लिए स्तंभ 0, और शेष सेल्स श्रृंखला मानों के लिए उपयोग करती है। IChartDataWorkbook.getCell को पास किए जाने वाले वर्कशीट, पंक्ति, और स्तंभ इंडेक्स शून्य-आधारित होते हैं। यह लेआउट डिफ़ॉल्ट डेटा के साथ चार्ट बनाते समय उपयोगी है, लेकिन यह मान कर न चलें कि हर मौजूदा चार्ट इसका उपयोग करता है। लोड किए गए प्रेजेंटेशन के लिए, वर्कबुक मान बदलने से पहले श्रृंखला, श्रेणियों, और डेटा बिंदुओं द्वारा संदर्भित सेल्स की जाँच करें।
चार्ट सेटिंग्स के तीन अलग-अलग स्कोप होते हैं:
- श्रृंखला‑स्तर सेटिंग्स, जैसे IChartSeries.getFormat सभी बिंदुओं के लिए डिफ़ॉल्ट रूप प्रदान करती हैं।
- डेटा‑बिंदु सेटिंग्स, जैसे IChartDataPoint.getFormat एक बिंदु के लिए श्रृंखला रूप को ओवरराइड करती हैं।
- समूह सेटिंग्स उन संगत श्रृंखलाओं पर लागू होती हैं जो एक ही IChartSeriesGroup से संबंधित हैं। जब आपको ओवरलैप या गैप चौड़ाई जैसी विकल्प सेट करने की आवश्यकता हो, तो IChartSeries.getParentSeriesGroup के माध्यम से समूह तक पहुंचें।
जब कोई स्पष्ट बिंदु या श्रृंखला फ़िल नहीं सेट किया गया हो, तो चार्ट शैली और थीम स्वचालित रूप से उपस्थिति निर्धारित करती हैं। जब श्रृंखला और बिंदु दोनों का फॉर्मेट मौजूद हो, तो बिंदु फॉर्मेट उस बिंदु के लिए प्रधानता रखता है।
चार्ट श्रृंखला ओवरलैप सेट करें
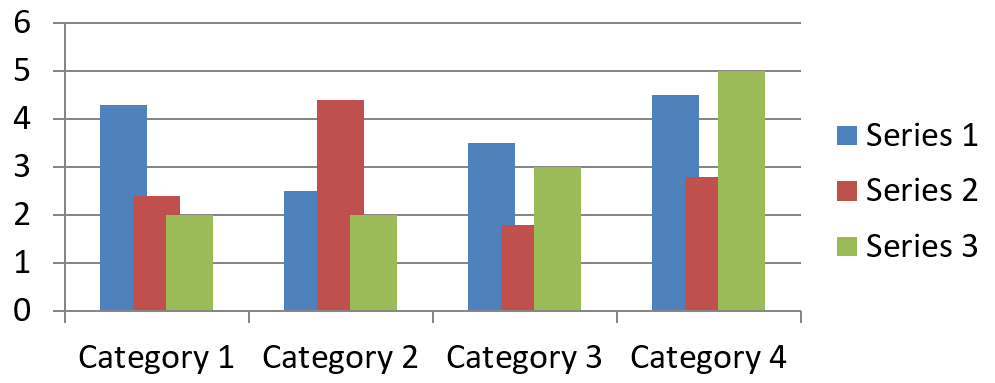
IChartSeries.getOverlap 2D चार्ट में बार या कॉलम के ओवरलैप की सीमा –100 से 100 प्रतिशत तक – रिपोर्ट करता है। यह पैरेंट श्रृंखला समूह पर सेटिंग का एक केवल‑पढ़ने योग्य प्रोजेक्शन है। इस समूह में सभी संगत श्रृंखलाओं को अपडेट करने के लिए IChartSeriesGroup.setOverlap का उपयोग करें। यह विकल्प उन चार्ट प्रकारों पर लागू होता है जो समूहित बार या कॉलम दिखाते हैं; यह संयोजन चार्ट में असंबंधित श्रृंखला समूहों को प्रभावित नहीं करता।
निम्न उदाहरण पहले श्रृंखला को सम्मिलित करने वाले समूह का ओवरलैप सेट करता है:
import com.aspose.slides.*;

final int firstSlideIndex = 0;
final int firstSeriesIndex = 0;
final byte overlapPercent = 30;

Presentation presentation = new Presentation();
try {
    ISlide slide = presentation.getSlides().get_Item(firstSlideIndex);

    // नया चार्ट नमूना श्रृंखलाएँ, श्रेणियाँ और मान रखता है।
    IChart chart = slide.getShapes().addChart(ChartType.ClusteredColumn, 20, 20, 500, 200);

    IChartSeries series = chart.getChartData().getSeries().get_Item(firstSeriesIndex);
    series.getParentSeriesGroup().setOverlap(overlapPercent);

    presentation.save("series_overlap.pptx", SaveFormat.Pptx);
} finally {
    presentation.dispose();
}
परिणाम:
श्रेणी फ़िल रंग बदलें
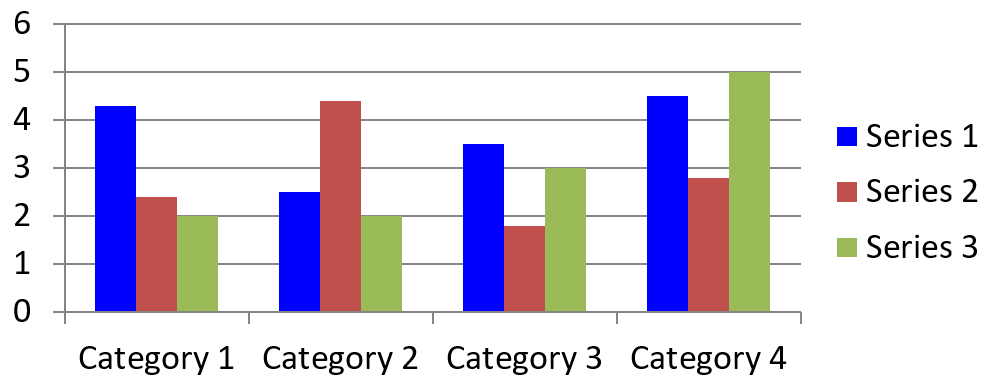
पूरी श्रृंखला के लिए डिफ़ॉल्ट फ़िल सेट करने के लिए IChartSeries.getFormat का उपयोग करें। यदि किसी बिंदु की पहले से स्पष्ट फ़िल है, तो उसका IChartDataPoint.getFormat सेटिंग उस बिंदु के लिए श्रृंखला फ़िल को ओवरराइड करती है।
निम्न उदाहरण पहले श्रृंखला पर ठोस नीला फ़िल लागू करता है:
import com.aspose.slides.*;
import android.graphics.Color;

final int firstSlideIndex = 0;
final int firstSeriesIndex = 0;

Presentation presentation = new Presentation();
try {
    ISlide slide = presentation.getSlides().get_Item(firstSlideIndex);

    IChart chart = slide.getShapes().addChart(ChartType.ClusteredColumn, 20, 20, 500, 200);

    IChartSeries series = chart.getChartData().getSeries().get_Item(firstSeriesIndex);
    series.getFormat().getFill().setFillType(FillType.Solid);
    series.getFormat().getFill().getSolidFillColor().setColor(Color.BLUE);

    presentation.save("series_color.pptx", SaveFormat.Pptx);
} finally {
    presentation.dispose();
}
परिणाम:
श्रेणी नाम बदलें
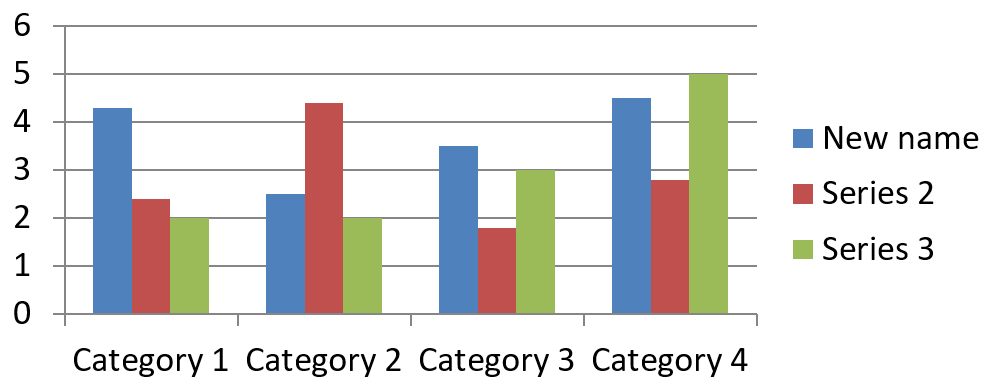
श्रेणी नाम चार्ट डेटा वर्कबुक में संग्रहीत होता है और सामान्यतः लीजेंड में दर्शाया जाता है। क्लस्टर्ड कॉलम चार्ट के लिए निर्मित डिफ़ॉल्ट वर्कबुक में, सेल B1 पंक्ति 0, स्तंभ 1 पर है और पहले श्रृंखला का नाम रखता है। निम्न उदाहरण में नामित स्थिरांक उस संरचना को स्पष्ट करते हैं:
import com.aspose.slides.*;

final int firstSlideIndex = 0;
final int worksheetIndex = 0;
final int seriesNameRowIndex = 0;
final int firstSeriesColumnIndex = 1;

Presentation presentation = new Presentation();
try {
    ISlide slide = presentation.getSlides().get_Item(firstSlideIndex);

    IChart chart = slide.getShapes().addChart(ChartType.ClusteredColumn, 20, 20, 500, 200);

    IChartDataWorkbook workbook = chart.getChartData().getChartDataWorkbook();
    IChartDataCell seriesNameCell = workbook.getCell(worksheetIndex, seriesNameRowIndex, firstSeriesColumnIndex);
    seriesNameCell.setValue("Revenue");

    presentation.save("series_name.pptx", SaveFormat.Pptx);
} finally {
    presentation.dispose();
}
आप IChartSeries.getName द्वारा पहले से संदर्भित सेल को भी अपडेट कर सकते हैं। यह दृष्टिकोण मौजूदा चार्ट में विशेष पंक्ति और स्तंभ मानने से बचाता है:
import com.aspose.slides.*;

final int firstSlideIndex = 0;
final int firstSeriesIndex = 0;
final int firstNameCellIndex = 0;

Presentation presentation = new Presentation();
try {
    ISlide slide = presentation.getSlides().get_Item(firstSlideIndex);

    IChart chart = slide.getShapes().addChart(ChartType.ClusteredColumn, 20, 20, 500, 200);

    IChartSeries series = chart.getChartData().getSeries().get_Item(firstSeriesIndex);
    IChartDataCell seriesNameCell = series.getName().getAsCells().get_Item(firstNameCellIndex);
    seriesNameCell.setValue("Revenue");

    presentation.save("series_name.pptx", SaveFormat.Pptx);
} finally {
    presentation.dispose();
}
परिणाम:
कई सेल्स से नाम वाला श्रृंखला बनाएं
जब उत्पाद नाम और रिपोर्टिंग अवधि अलग-अलग वर्कबुक सेल्स में संग्रहीत हों, तो सम्मिलित श्रृंखला नाम उपयोगी रहता है। उदाहरण के लिए, आप Product A को B1 में और 2026 को C1 में रखकर दोनों भागों को स्रोत सेल्स से जुड़ा रखते हुए एकल श्रृंखला नाम बना सकते हैं।
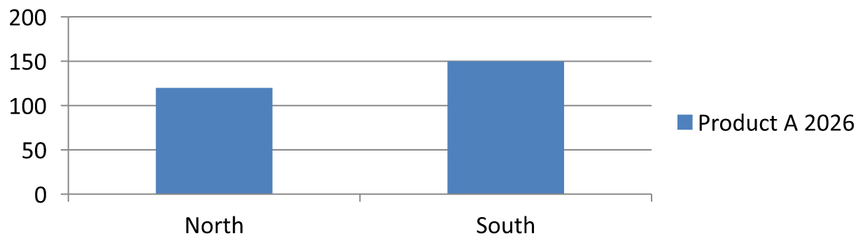
नाम रेंज प्राप्त करने के लिए IChartDataWorkbook.getCellCollection का उपयोग करें, फिर उस कलेक्शन को IChartSeriesCollection.add को पास करें। skipHiddenCells आर्ग्यूमेंट निर्धारित करता है कि छिपे हुए सेल्स शामिल हों या नहीं: true उन्हें बाहर करता है, जबकि false शामिल करता है। यह उदाहरण false का उपयोग कर नाम रेंज में सभी सेल्स को शामिल करता है।
निम्न उदाहरण एक प्रस्तुति बनाता है जिसमें एक श्रृंखला और दो डेटा बिंदु हैं। सेल्स B1:C1 केवल श्रृंखला नाम प्रदान करते हैं; A2:A3 श्रेणी लेबल देती हैं, और B2:B3 संख्यात्मक मान देती हैं।
import com.aspose.slides.*;

Presentation presentation = new Presentation();
try {
    ISlide slide = presentation.getSlides().get_Item(0);

    IChart chart = slide.getShapes().addChart(ChartType.ClusteredColumn, 50, 50, 620, 180);

    chart.getChartData().getSeries().clear();
    chart.getChartData().getCategories().clear();
    chart.setLegend(true);

    IChartDataWorkbook workbook = chart.getChartData().getChartDataWorkbook();
    workbook.clear(0);

    // ये दो सेल्स श्रृंखला का नाम प्रदान करते हैं।
    workbook.getCell(0, 0, 1, "Product A");
    workbook.getCell(0, 0, 2, "2026");
    IChartCellCollection nameCells = workbook.getCellCollection("Sheet1!$B$1:$C$1", false);
    IChartSeries series = chart.getChartData().getSeries().add(nameCells, ChartType.ClusteredColumn);

    // अलग-अलग सेल्स श्रेणियाँ और संख्यात्मक डेटा बिंदु प्रदान करते हैं।
    IChartDataCell northCategory = workbook.getCell(0, 1, 0, "North");
    IChartDataCell southCategory = workbook.getCell(0, 2, 0, "South");
    chart.getChartData().getCategories().add(northCategory);
    chart.getChartData().getCategories().add(southCategory);
    IChartDataCell northValue = workbook.getCell(0, 1, 1, 120);
    IChartDataCell southValue = workbook.getCell(0, 2, 1, 150);
    series.getDataPoints().addDataPointForBarSeries(northValue);
    series.getDataPoints().addDataPointForBarSeries(southValue);

    presentation.save("composite_series_name.pptx", SaveFormat.Pptx);
} finally {
    presentation.dispose();
}
परिणामी श्रृंखला नाम Product A 2026 है, दो सेल मानों के बीच स्पेस के साथ। लीजेंड इसे दोनों कॉलम के लिए एक प्रविष्टि के रूप में दिखाता है। परिणाम नीचे दर्शाया गया है:
स्वचालित श्रृंखला फ़िल रंग प्राप्त करें
IChartSeries.getAutomaticSeriesColor श्रृंखला इंडेक्स और चार्ट शैली से गणना किया गया Android ARGB रंग पूर्णांक लौटाता है। यह वह रंग है जो तब उपयोग होता है जब श्रृंखला फ़िल स्पष्ट रूप से परिभाषित नहीं किया गया हो। इस मेथड को कॉल करने से गणना किया गया रंग पढ़ा जाता है; यह नया फ़िल असाइन नहीं करता।
निम्न उदाहरण प्रत्येक डिफ़ॉल्ट श्रृंखला का स्वचालित रंग पूर्णांक प्रिंट करता है:
import com.aspose.slides.*;

final int firstSlideIndex = 0;

Presentation presentation = new Presentation();
try {
    ISlide slide = presentation.getSlides().get_Item(firstSlideIndex);

    IChart chart = slide.getShapes().addChart(ChartType.ClusteredColumn, 20, 20, 500, 200);

    int seriesCount = chart.getChartData().getSeries().size();
    for (int seriesIndex = 0; seriesIndex < seriesCount; seriesIndex++) {
        IChartSeries series = chart.getChartData().getSeries().get_Item(seriesIndex);
        int automaticColor = series.getAutomaticSeriesColor();
        System.out.println("Series " + seriesIndex + ": " + automaticColor);
    }
} finally {
    presentation.dispose();
}
सटीक पूर्णांक मान चार्ट शैली और थीम पर निर्भर होते हैं।
श्रेणी के लिए इनवर्ट फ़िल रंग सेट करें
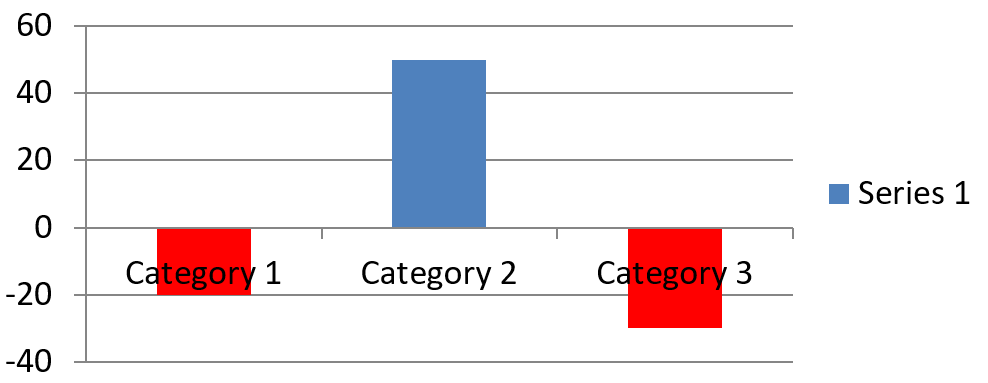
बार, कॉलम, और बबल श्रृंखलाओं के लिए, IChartSeries.setInvertIfNegative नकारात्मक मानों को अलग फ़िल के साथ दिखा सकता है। नियमित श्रृंखला फ़िल को ठोस सेट करें, इनवर्जन सक्षम करें, और नकारात्मक‑मान रंग को IChartSeries.getInvertedSolidFillColor के माध्यम से असाइन करें। नकारात्मक संख्याओं का वर्कबुक में मान नहीं बदलेगा; केवल उनका प्रदर्शन रंग बदलेगा।
निम्न उदाहरण डिफ़ॉल्ट चार्ट डेटा को एक श्रृंखला से बदलता है। वर्कशीट पंक्ति 0 में श्रृंखला नाम, स्तंभ 0 में श्रेणी नाम, और स्तंभ 1 में मान होते हैं:
import com.aspose.slides.*;
import android.graphics.Color;

final int firstSlideIndex = 0;
final int worksheetIndex = 0;
final int headerRowIndex = 0;
final int categoryColumnIndex = 0;
final int firstSeriesColumnIndex = 1;
final int firstDataRowIndex = 1;

String[] categoryNames = { "Category 1", "Category 2", "Category 3" };
int[] seriesValues = { -20, 50, -30 };

Presentation presentation = new Presentation();
try {
    ISlide slide = presentation.getSlides().get_Item(firstSlideIndex);

    IChart chart = slide.getShapes().addChart(ChartType.ClusteredColumn, 20, 20, 500, 200);
    IChartData chartData = chart.getChartData();
    IChartDataWorkbook workbook = chartData.getChartDataWorkbook();

    chartData.getSeries().clear();
    chartData.getCategories().clear();

    IChartDataCell seriesNameCell = workbook.getCell(worksheetIndex, headerRowIndex, firstSeriesColumnIndex, "Series 1");
    int chartType = chart.getType();
    IChartSeries series = chartData.getSeries().add(seriesNameCell, chartType);

    for (int categoryIndex = 0; categoryIndex < categoryNames.length; categoryIndex++) {
        int dataRowIndex = firstDataRowIndex + categoryIndex;
        String categoryName = categoryNames[categoryIndex];
        int seriesValue = seriesValues[categoryIndex];

        IChartDataCell categoryCell = workbook.getCell(worksheetIndex, dataRowIndex, categoryColumnIndex, categoryName);
        chartData.getCategories().add(categoryCell);

        IChartDataCell valueCell = workbook.getCell(worksheetIndex, dataRowIndex, firstSeriesColumnIndex, seriesValue);
        series.getDataPoints().addDataPointForBarSeries(valueCell);
    }

    int automaticSeriesColor = series.getAutomaticSeriesColor();
    series.getFormat().getFill().setFillType(FillType.Solid);
    series.getFormat().getFill().getSolidFillColor().setColor(automaticSeriesColor);
    series.setInvertIfNegative(true);
    series.getInvertedSolidFillColor().setColor(Color.RED);

    presentation.save("inverted_solid_fill_color.pptx", SaveFormat.Pptx);
} finally {
    presentation.dispose();
}
परिणाम:
आप एक बिंदु के लिए इनवर्जन को IChartDataPoint.setInvertIfNegative के माध्यम से सक्षम कर सकते हैं। नीचे दिए गए उदाहरण में श्रृंखला के लिए इनवर्जन अक्षम है और केवल चयनित बिंदु के लिए सक्षम है। बिंदु को नकारात्मक मान भी असाइन किया गया है ताकि प्रभाव दिखाई दे:
import com.aspose.slides.*;
import android.graphics.Color;

final int firstSlideIndex = 0;
final int firstSeriesIndex = 0;
final int targetDataPointIndex = 2;
final int negativeValue = -30;

Presentation presentation = new Presentation();
try {
    ISlide slide = presentation.getSlides().get_Item(firstSlideIndex);

    IChart chart = slide.getShapes().addChart(ChartType.ClusteredColumn, 20, 20, 500, 200);

    IChartSeries series = chart.getChartData().getSeries().get_Item(firstSeriesIndex);
    int automaticSeriesColor = series.getAutomaticSeriesColor();
    series.getFormat().getFill().setFillType(FillType.Solid);
    series.getFormat().getFill().getSolidFillColor().setColor(automaticSeriesColor);
    series.getInvertedSolidFillColor().setColor(Color.RED);
    series.setInvertIfNegative(false);

    IChartDataPoint dataPoint = series.getDataPoints().get_Item(targetDataPointIndex);
    dataPoint.getValue().getAsCell().setValue(negativeValue);
    dataPoint.setInvertIfNegative(true);

    presentation.save("data_point_invert_color_if_negative.pptx", SaveFormat.Pptx);
} finally {
    presentation.dispose();
}
विशिष्ट डेटा बिंदु मान साफ़ करें
एक बिंदु को खाली करने के लिए, उसके बैकिंग वर्कबुक सेल को null सेट करें, जबकि अन्य बिंदु नहीं हटें। कॉलम चार्ट में, प्लॉट किया गया मान IChartDataPoint.getValue द्वारा उपलब्ध है। डेटा बिंदु समान श्रेणी स्थिति पर रहता है, पर चार्ट उसकी मान को खाली मानता है जैसे ब्लैंक‑वैल्यु सेटिंग्स के अनुसार।
निम्न उदाहरण पहले श्रृंखला के दूसरे बिंदु को ही साफ़ करता है:
import com.aspose.slides.*;

final int firstSlideIndex = 0;
final int firstSeriesIndex = 0;
final int targetDataPointIndex = 1;

Presentation presentation = new Presentation();
try {
    ISlide slide = presentation.getSlides().get_Item(firstSlideIndex);

    IChart chart = slide.getShapes().addChart(ChartType.ClusteredColumn, 20, 20, 500, 200);

    IChartSeries series = chart.getChartData().getSeries().get_Item(firstSeriesIndex);
    IChartDataPoint dataPoint = series.getDataPoints().get_Item(targetDataPointIndex);
    dataPoint.getValue().getAsCell().setValue(null);

    presentation.save("clear_data_point_value.pptx", SaveFormat.Pptx);
} finally {
    presentation.dispose();
}
स्कैटर चार्ट अलग‑अलग X और Y सेल्स उपयोग करते हैं, और बबल चार्ट में एक साइज सेल भी होता है। आप केवल उस सेल को साफ़ करें जो हटाने योग्य मान को दर्शाता है। जब आप अन्य बिंदु रखना चाहते हैं, तो IChartDataPointCollection.clear न कॉल करें, क्योंकि यह विधि श्रृंखला के सभी डेटा बिंदुओं को हटाता है।
खाली सेल्स के प्रदर्शन को नियंत्रित करें
छिपे हुए सेल्स जिनमें मान होते हैं, उन्हें खाली सेल्स से अलग माना जाता है। छिपी हुई वर्कशीट पंक्तियों और स्तंभों से डेटा को शामिल या बाहर करने के लिए देखें Include Data from Hidden Rows and Columns।
एक खाली वर्कबुक सेल अनुपलब्ध डेटा का प्रतिनिधित्व करता है; 0 मूल numeric मान दर्शाता है। किसी सेल को खाली करने के लिए IChartDataCell.setValue को null पास करें। शून्य मान ब्लैंक‑सेल सेटिंग के बावजूद शून्य ही रहेगा।
IChart.setDisplayBlanksAs का उपयोग करके तय करें कि चार्ट खाली सेल्स को कैसे दर्शाए। यह सेटिंग पूरे चार्ट पर लागू होती है और ब्लैंक्स को प्लॉट करने के तरीके को बदलती है, बिना खाली सेल को शून्य या इंटरपोलेटेड मान से भरने के।
निम्न स्व-निहित उदाहरण एक लाइन चार्ट बनाता है जिसमें एक श्रृंखला है, दिन 3 का मान साफ़ करता है, और प्रत्येक मोड के साथ उसी चार्ट को सहेजता है। कोई इनपुट फ़ाइल आवश्यक नहीं है। IChartDataWorkbook वर्कशीट 0, स्तंभ 0 को श्रेणी लेबल्स और स्तंभ 1 को मानों के लिए उपयोग करता है; पंक्ति 0 में श्रृंखला नाम रखता है। अंतिम डेटा 10, 20, empty, 30, 40 है।
import com.aspose.slides.*;

Presentation presentation = new Presentation();
try {
    ISlide slide = presentation.getSlides().get_Item(0);

    IChart chart = slide.getShapes().addChart(ChartType.LineWithMarkers, 40, 40, 640, 400);
    IChartData chartData = chart.getChartData();
    IChartDataWorkbook workbook = chartData.getChartDataWorkbook();

    chartData.getSeries().clear();
    chartData.getCategories().clear();

    IChartDataCell seriesNameCell = workbook.getCell(0, 0, 1, "Measurements");
    IChartSeries series = chartData.getSeries().add(seriesNameCell, chart.getType());
    int[] values = { 10, 20, 25, 30, 40 };

    for (int i = 0; i < values.length; i++) {
        IChartDataCell categoryCell = workbook.getCell(0, i + 1, 0, "Day " + (i + 1));
        chartData.getCategories().add(categoryCell);
        IChartDataCell valueCell = workbook.getCell(0, i + 1, 1, values[i]);
        series.getDataPoints().addDataPointForLineSeries(valueCell);
    }

    // दिन 3 को वास्तविक रूप से खाली छोड़ें, जबकि उसकी श्रेणी और डेटा बिंदु को बरकरार रखें।
    workbook.getCell(0, 3, 1).setValue(null);

    int[] modes = { DisplayBlanksAsType.Gap, DisplayBlanksAsType.Zero, DisplayBlanksAsType.Span };
    String[] modeNames = { "Gap", "Zero", "Span" };
    for (int i = 0; i < modes.length; i++) {
        chart.setDisplayBlanksAs(modes[i]);
        presentation.save("empty_cells_" + modeNames[i] + ".pptx", SaveFormat.Pptx);
    }
} finally {
    presentation.dispose();
}
प्रत्येक आउटपुट फ़ाइल में सहेजने से पहले निर्धारित मोड नाम रखा जाता है: empty_cells_Gap.pptx, empty_cells_Zero.pptx, और empty_cells_Span.pptx। एक ही संस्करण सहेजने के लिए, इच्छित मोड असाइन करें और प्रस्तुति को केवल एक बार सहेजें।
नीचे तुलना में सभी तीन फ़ाइलों में समान डेटा दिखाया गया है। दिन 3 प्रत्येक केस में वर्कबुक में खाली है:
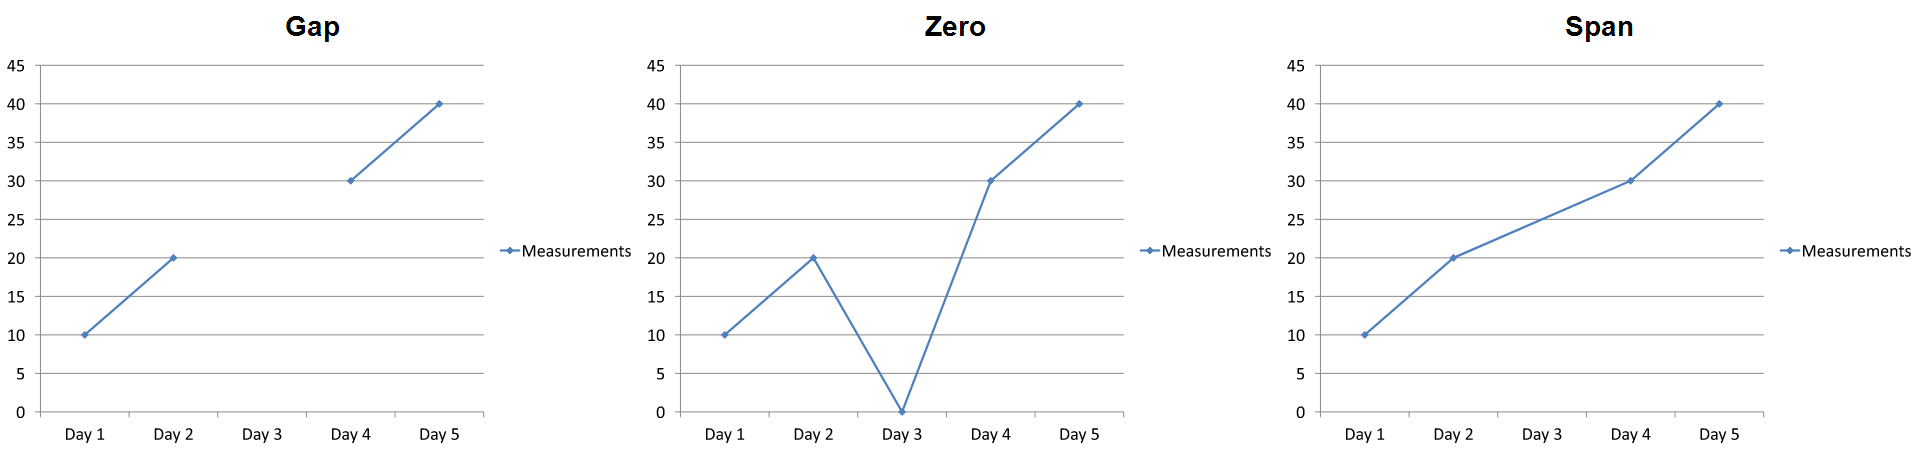
दृश्यमान प्रभाव चार्ट प्रकार पर निर्भर करता है। लाइन चार्ट सभी तीन मोड को आसानी से तुलना करने देता है। बार और कॉलम चार्ट में गुम श्रेणी के कारण जोड़ने वाली रेखा नहीं बनती, इसलिए Span उपरोक्त जैसा कनेक्टिंग सेगमेंट नहीं बना पाता; एक गुम कॉलम और शून्य‑ऊँचाई वाला कॉलम भी समान दिख सकते हैं। इसी प्रकार, केवल मार्कर वाले स्कैटर चार्ट में कोई कनेक्टिंग लाइन नहीं होती। हर चार्ट प्रकार के लिए तीन अलग परिणाम की उम्मीद न रखें; उपयोग किए जाने वाले प्रकार के लिए आउटपुट की जाँच करें।
श्रेणी गैप चौड़ाई सेट करें
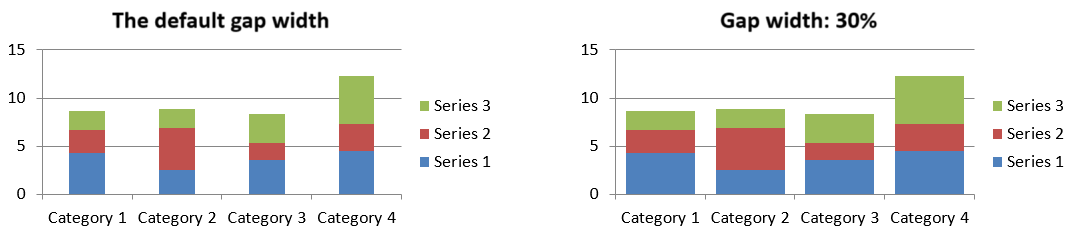
गैप चौड़ाई आसन्न बार या कॉलम क्लस्टर के बीच की दूरी है, जो बार या कॉलम की चौड़ाई के प्रतिशत में व्यक्त होती है। ओवरलैप की तरह, यह पैरेंट श्रृंखला समूह से जुड़ी होती है, न कि व्यक्तिगत श्रृंखला से। समूह के लिए एक ही बार IChartSeriesGroup.setGapWidth कॉल करें। बड़ी मान क्लस्टर के बीच अधिक स्थान बनाती है; छोटी मान उन्हें अधिक घना बनाती है।
निम्न उदाहरण गैप चौड़ाई बदलता है और केवल अंतिम प्रस्तुति को सहेजता है:
import com.aspose.slides.*;

final int firstSlideIndex = 0;
final int firstSeriesIndex = 0;
final int gapWidthPercent = 30;

Presentation presentation = new Presentation();
try {
    ISlide slide = presentation.getSlides().get_Item(firstSlideIndex);

    IChart chart = slide.getShapes().addChart(ChartType.StackedColumn, 20, 20, 500, 200);

    IChartSeries series = chart.getChartData().getSeries().get_Item(firstSeriesIndex);
    series.getParentSeriesGroup().setGapWidth(gapWidthPercent);

    presentation.save("gap_width_30.pptx", SaveFormat.Pptx);
} finally {
    presentation.dispose();
}
परिणाम:
अक्सर पूछे जाने वाले प्रश्न
कौन से चार्ट प्रकार डेटा श्रृंखलाओं का समर्थन करते हैं?
ChartType एन्यूमरेशन द्वारा दर्शाए गए सभी चार्ट प्रकार चार्ट डेटा का उपयोग करते हैं, लेकिन उनकी श्रृंखलाओं में मान संरचना या सेटिंग्स समान नहीं होतीं। उदाहरण के लिए, श्रेणी चार्ट में श्रेणियां और मान होते हैं, स्कैटर चार्ट में X और Y मान होते हैं, और बबल चार्ट में बबल आकार जोड़ता है। डेटा‑बिंदु निर्माण विधि का चयन श्रृंखला प्रकार के अनुसार करें। ओवरलैप और गैप चौड़ाई जैसी सेटिंग्स केवल संगत बार या कॉलम समूहों पर लागू होती हैं।
चार्ट श्रृंखला समूह क्या है?
एक IChartSeriesGroup संगत श्रृंखलाओं को समाहित करता है जो समूह‑स्तर के प्लॉटिंग सेटिंग्स साझा करते हैं। संयोजन चार्ट में एक से अधिक समूह हो सकते हैं, इसलिए एक श्रृंखला के माध्यम से पहुँचा गया समूह सभी श्रृंखलाओं को आवश्यक रूप से नहीं बदलता।
क्या नया बनाया गया चार्ट डिफ़ॉल्ट डेटा रखता है?
हाँ। डिफ़ॉल्ट रूप से, IShapeCollection.addChart नमूना श्रृंखलाएं, श्रेणियां, और मान बनाता है। आप इन सेल्स को संपादित कर सकते हैं या पूरी तरह कस्टम डेटा सेट जोड़ने से पहले श्रृंखला और श्रेणी कलेक्शन को साफ़ कर सकते हैं। एक ओवरलोड भी डिफ़ॉल्ट डेटा के बिना चार्ट बना सकता है।
चार्ट ऑब्जेक्ट्स वर्कबुक सेल्स से कैसे जुड़े होते हैं?
श्रेणी नाम, श्रेणी लेबल, और डेटा‑बिंदु मान IChartDataWorkbook में सेल्स को संदर्भित करते हैं। किसी संदर्भित सेल को बदलने से संबंधित चार्ट तत्व अपडेट हो जाता है। जब आप कस्टम डेटा बनाते हैं, तो श्रेणी पंक्तियों और श्रृंखला‑मान पंक्तियों को इस प्रकार संरेखित रखें कि प्रत्येक बिंदु इच्छित श्रेणी के नीचे प्लॉट हो।
पूरी श्रृंखला के बजाय एक बिंदु को कैसे साफ़ करें?
निर्दिष्ट मान सेल को null सेट करें ताकि बिंदु की श्रेणी स्थिति बनी रहे लेकिन उसे खाली बिंदु माना जाए। केवल तभी IChartDataPointCollection.clear का उपयोग करें जब आप उस श्रृंखला के सभी बिंदुओं को हटाना चाहते हों। यदि आप श्रेणियों को भी हटाते हैं, तो सभी श्रृंखलाओं को इस प्रकार अपडेट करें कि उनके मान श्रेणी कलेक्शन के साथ संरेखित रहें।
खाली बिंदु कैसे प्रदर्शित होते हैं?
परिणाम चार्ट प्रकार और IChart.setDisplayBlanksAs द्वारा कॉन्फ़िगर किए गए मान पर निर्भर करता है। समर्थित चार्ट ब्लैंक्स को गैप, शून्य मान, या निकटवर्ती बिंदुओं को जोड़कर दर्शा सकते हैं। अपने प्रेजेंटेशन में लापता डेटा के अर्थ के अनुसार सेटिंग चुनें। पूर्ण उदाहरण और दृश्य तुलना के लिए देखें Control the Display of Empty Cells।
नकारात्मक मान कैसे स्वरूपित होते हैं?
समर्थित बार, कॉलम, और बबल श्रृंखलाओं के लिए, IChartSeries.setInvertIfNegative कॉल करें और IChartSeries.getInvertedSolidFillColor से प्राप्त रंग को सेट करें। आप व्यक्तिगत बिंदु के लिए IChartDataPoint.setInvertIfNegative द्वारा व्यवहार को ओवरराइड कर सकते हैं। ये विधियां फ़ॉर्मेटिंग को प्रभावित करती हैं, न कि संग्रहीत संख्यात्मक मानों को।
जब दोनों श्रृंखला और बिंदु स्वरूपित हों तो कौन जीतता है?
स्पष्ट डेटा‑बिंदु फ़ॉर्मेटिंग उस बिंदु के लिए प्रधानता रखती है। अन्य बिंदु स्पष्ट श्रृंखला फ़ॉर्मेट या, यदि श्रृंखला फ़ॉर्मेट परिभाषित नहीं है, तो स्वचालित चार्ट शैली और थीम का उपयोग जारी रखते हैं। समूह सेटिंग्स जैसे ओवरलैप और गैप चौड़ाई लेआउट को नियंत्रित करती हैं और बिंदु‑स्तर के फ़ॉर्मेट ओवरराइड नहीं करतीं।
एक चार्ट में अधिकतम कितनी श्रृंखलाएं हो सकती हैं?
Aspose.Slides कोई अलग स्थिर श्रृंखला‑गणना सीमा नहीं लगाता। व्यावहारिक रूप से, प्रस्तुति फ़ाइल सीमाएँ, उपलब्ध मेमोरी, रेंडरिंग समय, और चार्ट पठनीयता उपयोगी सीमा तय करती हैं।
जब कॉलम बहुत पास या बहुत दूर हों तो क्या बदलना चाहिए?
उचित पैरेंट श्रृंखला समूह पर IChartSeriesGroup.setGapWidth कॉल करें। मान बढ़ाने से क्लस्टर के बीच स्थान विस्तृत होगा, घटाने से क्लस्टर करीब आएंगे।