
จัดการชุดข้อมูลแผนภูมิในงานนำเสนอบน Android
ภาพรวม
แผนภูมิจะจัดเก็บข้อมูลที่แสดงผลไว้ในสมุดงานข้อมูลแผนภูมิ ชุด IChartSeries แสดงชุดค่าที่เกี่ยวข้องหนึ่งชุด และแต่ละ IChartDataPoint ในชุดจะอ้างอิงถึงหนึ่งหรือหลายเซลล์ของสมุดงาน วัตถุ IChartCategory ให้ป้ายกำกับหรือค่ากลุ่มที่ใช้ร่วมกันระหว่างชุดต่าง ๆ ชื่อชุด, ประเภท, และค่าจุดจึงเชื่อมต่อกับวัตถุ IChartDataCell แทนการเก็บเป็นข้อความแสดงผลเท่านั้น
สำหรับแผนภูมิประเภททั่วไป สมุดงานเริ่มต้นจะใช้แถว 0 สำหรับชื่อชุด, คอลัมน์ 0 สำหรับชื่อประเภท, และเซลล์ที่เหลือสำหรับค่าชุด ดัชนีของ Worksheet, แถว, และคอลัมน์ที่ส่งให้ IChartDataWorkbook.getCell จะเป็นค่าตั้งต้นที่เริ่มจากศูนย์ การจัดวางนี้เป็นประโยชน์เมื่อคุณสร้างแผนภูมิด้วยข้อมูลเริ่มต้น, แต่ไม่ควรสมมติว่าทุกแผนภูมิที่มีอยู่ใช้รูปแบบนี้ สำหรับงานนำเสนอที่โหลดมา, ตรวจสอบเซลล์ที่ชุด, ประเภท, และจุดข้อมูลอ้างอิงก่อนที่จะเปลี่ยนค่าของสมุดงาน
Chart settings have three different scopes:
- การตั้งค่าระดับชุด, เช่น IChartSeries.getFormat ให้ลักษณะการแสดงผลเริ่มต้นสำหรับจุดทั้งหมดในชุดเดียว
- การตั้งค่าจุดข้อมูล, เช่น IChartDataPoint.getFormat จะบังคับลักษณะการแสดงผลของชุดสำหรับจุดหนึ่งจุด
- การตั้งค่ากลุ่มใช้กับชุดที่เข้ากันและอยู่ใน IChartSeriesGroup เดียวกัน เข้าถึงกลุ่มผ่าน IChartSeries.getParentSeriesGroup เมื่อคุณต้องการกำหนดตัวเลือกเช่นการซ้อนหรือความกว้างช่องว่าง
เมื่อไม่มีการตั้งค่าสีเติมจุดหรือชุดอย่างชัดเจน, รูปแบบและธีมของแผนภูมิจะกำหนดลักษณะอัตโนมัติ เมื่อมีการตั้งค่าทั้งชุดและจุดพร้อมกัน, การตั้งค่าของจุดจะมีลำดับความสำคัญสำหรับจุดนั้น
ตั้งค่าการซ้อนของชุดข้อมูลแผนภูมิ
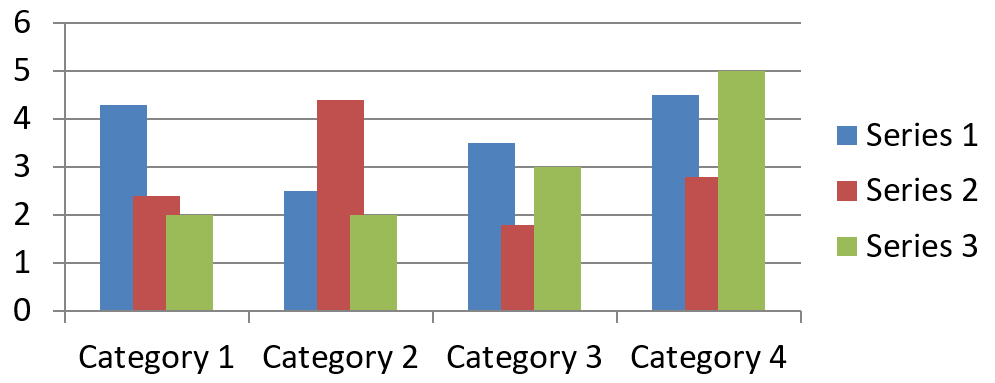
IChartSeries.getOverlap รายงานว่ากราฟแท่งหรือคอลัมน์ซ้อนกันเท่าไหร่ในแผนภูมิ 2D มีค่าตั้งแต่ -100 ถึง 100 เปอร์เซ็นต์ เป็นการอ่านค่าการตั้งค่าจากกลุ่มชุดพาเรนท์แบบอ่านอย่างเดียว ใช้ IChartSeriesGroup.setOverlap เพื่ออัปเดตทุกชุดที่เข้ากันในกลุ่มนั้น ตัวเลือกนี้ใช้กับประเภทแผนภูมิที่แสดงแท่งหรือคอลัมน์เป็นกลุ่ม; ไม่กระทบต่อกลุ่มชุดที่ไม่เกี่ยวข้องในแผนภูมิแบบรวม
ตัวอย่างต่อไปนี้ตั้งค่าการซ้อนสำหรับกลุ่มที่มีชุดแรกอยู่:
import com.aspose.slides.*;

final int firstSlideIndex = 0;
final int firstSeriesIndex = 0;
final byte overlapPercent = 30;

Presentation presentation = new Presentation();
try {
    ISlide slide = presentation.getSlides().get_Item(firstSlideIndex);

    // แผนภูมิใหม่ประกอบด้วยชุดตัวอย่าง, ประเภท, และค่า.
    IChart chart = slide.getShapes().addChart(ChartType.ClusteredColumn, 20, 20, 500, 200);

    IChartSeries series = chart.getChartData().getSeries().get_Item(firstSeriesIndex);
    series.getParentSeriesGroup().setOverlap(overlapPercent);

    presentation.save("series_overlap.pptx", SaveFormat.Pptx);
} finally {
    presentation.dispose();
}
ผลลัพธ์:
เปลี่ยนสีเติมของชุดข้อมูล
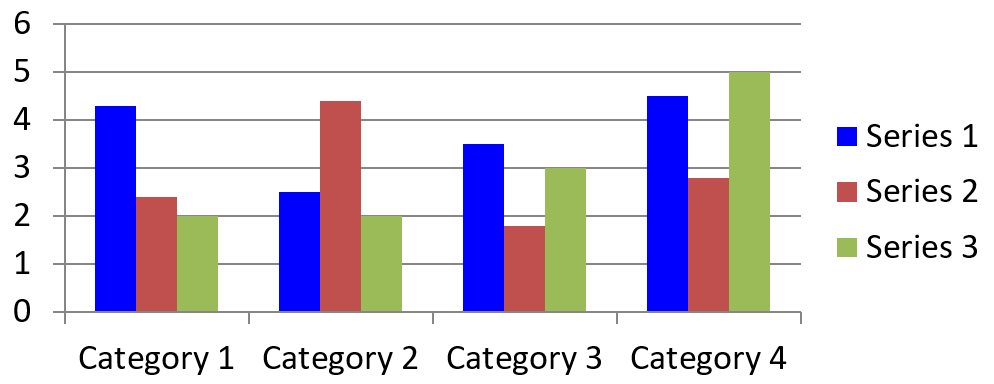
ใช้ IChartSeries.getFormat เพื่อตั้งค่าสีเติมเริ่มต้นสำหรับชุดทั้งหมด หากจุดหนึ่งมีสีเติมที่กำหนดไว้แล้ว, การตั้งค่า IChartDataPoint.getFormat จะบังคับเหนือสีเติมของชุดสำหรับจุดนั้น
ตัวอย่างต่อไปนี้ใช้สีเติมสีฟ้าตรงสำหรับชุดแรก:
import com.aspose.slides.*;
import android.graphics.Color;

final int firstSlideIndex = 0;
final int firstSeriesIndex = 0;

Presentation presentation = new Presentation();
try {
    ISlide slide = presentation.getSlides().get_Item(firstSlideIndex);

    IChart chart = slide.getShapes().addChart(ChartType.ClusteredColumn, 20, 20, 500, 200);

    IChartSeries series = chart.getChartData().getSeries().get_Item(firstSeriesIndex);
    series.getFormat().getFill().setFillType(FillType.Solid);
    series.getFormat().getFill().getSolidFillColor().setColor(Color.BLUE);

    presentation.save("series_color.pptx", SaveFormat.Pptx);
} finally {
    presentation.dispose();
}
ผลลัพธ์:
เปลี่ยนชื่อชุดข้อมูล
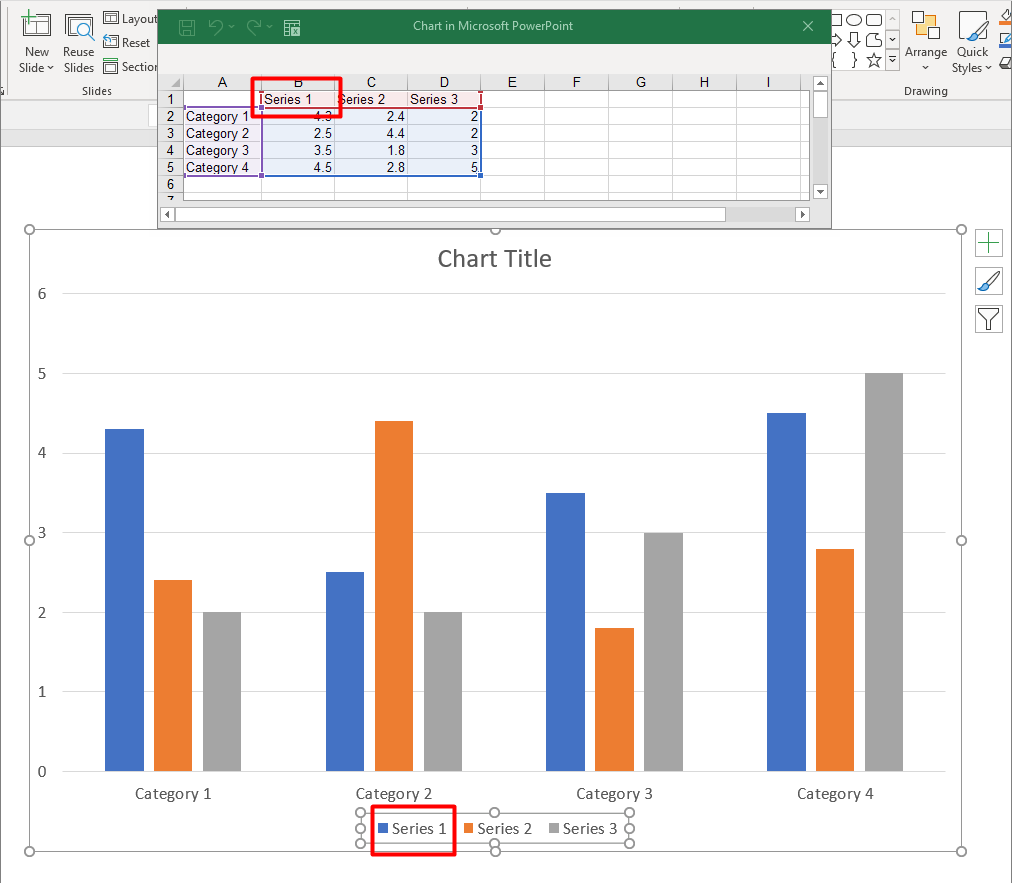
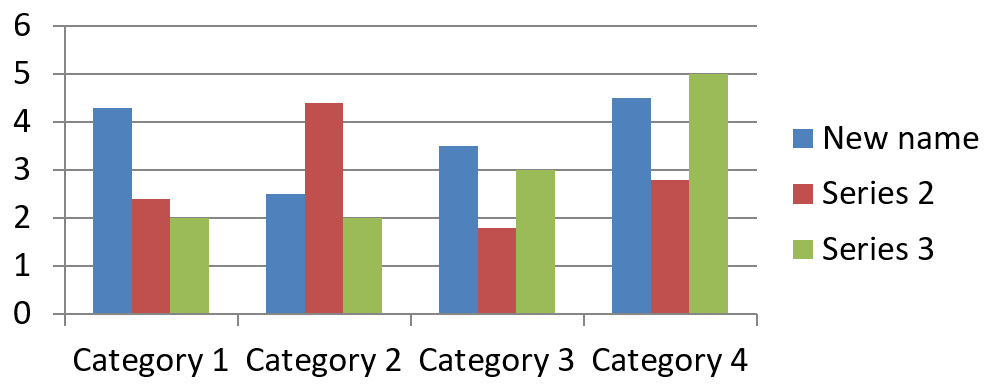
ชื่อชุดถูกเก็บในสมุดงานข้อมูลแผนภูมิและโดยปกติจะแสดงในคำอธิบายภาพ ในสมุดงานเริ่มต้นที่สร้างสำหรับแผนภูมิคอลัมน์แบบจัดกลุ่ม เซลล์ B1 อยู่ที่แถว 0, คอลัมน์ 1 และมีชื่อของชุดแรก ค่าคงที่ที่ตั้งชื่อในตัวอย่างต่อไปนี้ทำให้โครงสร้างนี้ชัดเจน:
import com.aspose.slides.*;

final int firstSlideIndex = 0;
final int worksheetIndex = 0;
final int seriesNameRowIndex = 0;
final int firstSeriesColumnIndex = 1;

Presentation presentation = new Presentation();
try {
    ISlide slide = presentation.getSlides().get_Item(firstSlideIndex);

    IChart chart = slide.getShapes().addChart(ChartType.ClusteredColumn, 20, 20, 500, 200);

    IChartDataWorkbook workbook = chart.getChartData().getChartDataWorkbook();
    IChartDataCell seriesNameCell = workbook.getCell(worksheetIndex, seriesNameRowIndex, firstSeriesColumnIndex);
    seriesNameCell.setValue("Revenue");

    presentation.save("series_name.pptx", SaveFormat.Pptx);
} finally {
    presentation.dispose();
}
คุณสามารถอัปเดตเซลล์ที่ IChartSeries.getName อ้างอิงอยู่แล้ว วิธีนี้หลีกเลี่ยงการสมมติแถวและคอลัมน์เฉพาะในแผนภูมิที่มีอยู่:
import com.aspose.slides.*;

final int firstSlideIndex = 0;
final int firstSeriesIndex = 0;
final int firstNameCellIndex = 0;

Presentation presentation = new Presentation();
try {
    ISlide slide = presentation.getSlides().get_Item(firstSlideIndex);

    IChart chart = slide.getShapes().addChart(ChartType.ClusteredColumn, 20, 20, 500, 200);

    IChartSeries series = chart.getChartData().getSeries().get_Item(firstSeriesIndex);
    IChartDataCell seriesNameCell = series.getName().getAsCells().get_Item(firstNameCellIndex);
    seriesNameCell.setValue("Revenue");

    presentation.save("series_name.pptx", SaveFormat.Pptx);
} finally {
    presentation.dispose();
}
ผลลัพธ์:
รับสีเติมอัตโนมัติของชุดข้อมูล
IChartSeries.getAutomaticSeriesColor คืนค่าสีที่คำนวณจากดัชนีของชุดและรูปแบบของแผนภูมิเป็นจำนวนเต็มสี ARGB ของ Android นี่คือสีที่ใช้เมื่อสีเติมของชุดไม่ได้ถูกกำหนดอย่างชัดเจน การเรียกเมธอดจะอ่านสีที่คำนวณ; ไม่ได้กำหนดสีเติมใหม่
ตัวอย่างต่อไปนี้พิมพ์ค่าจำนวนเต็มสีอัตโนมัติของแต่ละชุดเริ่มต้น:
import com.aspose.slides.*;

final int firstSlideIndex = 0;

Presentation presentation = new Presentation();
try {
    ISlide slide = presentation.getSlides().get_Item(firstSlideIndex);

    IChart chart = slide.getShapes().addChart(ChartType.ClusteredColumn, 20, 20, 500, 200);

    int seriesCount = chart.getChartData().getSeries().size();
    for (int seriesIndex = 0; seriesIndex < seriesCount; seriesIndex++) {
        IChartSeries series = chart.getChartData().getSeries().get_Item(seriesIndex);
        int automaticColor = series.getAutomaticSeriesColor();
        System.out.println("Series " + seriesIndex + ": " + automaticColor);
    }
} finally {
    presentation.dispose();
}
ค่าตัวเต็มที่ได้ขึ้นอยู่กับรูปแบบและธีมของแผนภูมิ
ตั้งค่าสีเติมกลับสำหรับชุดข้อมูลแผนภูมิ
สำหรับชุดแท่ง, คอลัมน์, และบับเบิล, IChartSeries.setInvertIfNegative สามารถแสดงค่าลบด้วยสีเติมที่ต่างออกไป ตั้งค่าสีเติมของชุดเป็นสีทึบ, เปิดการกลับสี, และกำหนดสีค่าลบผ่าน IChartSeries.getInvertedSolidFillColor ตัวเลขลบจะยังคงอยู่ในสมุดงาน; มีเพียงสีการแสดงผลที่เปลี่ยน
ตัวอย่างต่อไปนี้แทนที่ข้อมูลแผนภูมิเบื้องต้นด้วยชุดเดียว Worksheet แถว 0 มีชื่อชุด, คอลัมน์ 0 มีชื่อประเภท, และคอลัมน์ 1 มีค่า:
import com.aspose.slides.*;
import android.graphics.Color;

final int firstSlideIndex = 0;
final int worksheetIndex = 0;
final int headerRowIndex = 0;
final int categoryColumnIndex = 0;
final int firstSeriesColumnIndex = 1;
final int firstDataRowIndex = 1;

String[] categoryNames = { "Category 1", "Category 2", "Category 3" };
int[] seriesValues = { -20, 50, -30 };

Presentation presentation = new Presentation();
try {
    ISlide slide = presentation.getSlides().get_Item(firstSlideIndex);

    IChart chart = slide.getShapes().addChart(ChartType.ClusteredColumn, 20, 20, 500, 200);
    IChartData chartData = chart.getChartData();
    IChartDataWorkbook workbook = chartData.getChartDataWorkbook();

    chartData.getSeries().clear();
    chartData.getCategories().clear();

    IChartDataCell seriesNameCell = workbook.getCell(worksheetIndex, headerRowIndex, firstSeriesColumnIndex, "Series 1");
    int chartType = chart.getType();
    IChartSeries series = chartData.getSeries().add(seriesNameCell, chartType);

    for (int categoryIndex = 0; categoryIndex < categoryNames.length; categoryIndex++) {
        int dataRowIndex = firstDataRowIndex + categoryIndex;
        String categoryName = categoryNames[categoryIndex];
        int seriesValue = seriesValues[categoryIndex];

        IChartDataCell categoryCell = workbook.getCell(worksheetIndex, dataRowIndex, categoryColumnIndex, categoryName);
        chartData.getCategories().add(categoryCell);

        IChartDataCell valueCell = workbook.getCell(worksheetIndex, dataRowIndex, firstSeriesColumnIndex, seriesValue);
        series.getDataPoints().addDataPointForBarSeries(valueCell);
    }

    int automaticSeriesColor = series.getAutomaticSeriesColor();
    series.getFormat().getFill().setFillType(FillType.Solid);
    series.getFormat().getFill().getSolidFillColor().setColor(automaticSeriesColor);
    series.setInvertIfNegative(true);
    series.getInvertedSolidFillColor().setColor(Color.RED);

    presentation.save("inverted_solid_fill_color.pptx", SaveFormat.Pptx);
} finally {
    presentation.dispose();
}
ผลลัพธ์:
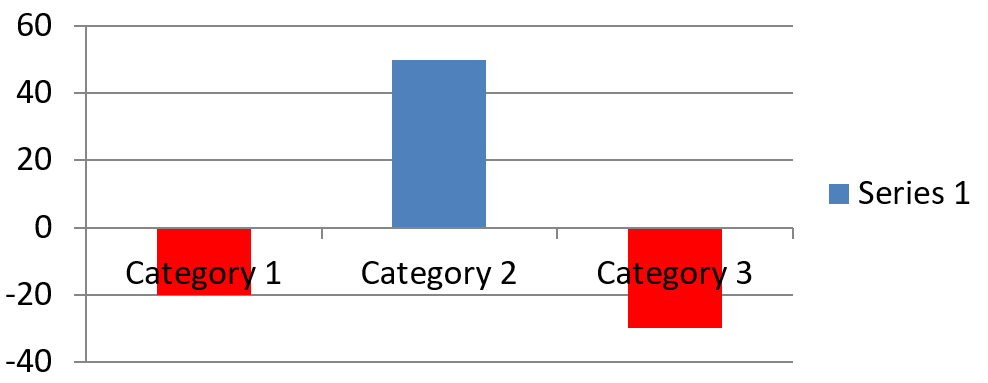
คุณสามารถเปิดการกลับสีสำหรับจุดเดียวผ่าน IChartDataPoint.setInvertIfNegative ตัวอย่างต่อไปนี้ปิดการกลับสีสำหรับชุดและเปิดเฉพาะสำหรับจุดที่เลือก พร้อมกำหนดค่าติดลบเพื่อให้เห็นผล:
import com.aspose.slides.*;
import android.graphics.Color;

final int firstSlideIndex = 0;
final int firstSeriesIndex = 0;
final int targetDataPointIndex = 2;
final int negativeValue = -30;

Presentation presentation = new Presentation();
try {
    ISlide slide = presentation.getSlides().get_Item(firstSlideIndex);

    IChart chart = slide.getShapes().addChart(ChartType.ClusteredColumn, 20, 20, 500, 200);

    IChartSeries series = chart.getChartData().getSeries().get_Item(firstSeriesIndex);
    int automaticSeriesColor = series.getAutomaticSeriesColor();
    series.getFormat().getFill().setFillType(FillType.Solid);
    series.getFormat().getFill().getSolidFillColor().setColor(automaticSeriesColor);
    series.getInvertedSolidFillColor().setColor(Color.RED);
    series.setInvertIfNegative(false);

    IChartDataPoint dataPoint = series.getDataPoints().get_Item(targetDataPointIndex);
    dataPoint.getValue().getAsCell().setValue(negativeValue);
    dataPoint.setInvertIfNegative(true);

    presentation.save("data_point_invert_color_if_negative.pptx", SaveFormat.Pptx);
} finally {
    presentation.dispose();
}
ล้างค่าจุดข้อมูลเฉพาะ
เพื่อทำให้จุดหนึ่งเป็นค่าว่างโดยไม่ลบจุดอื่น, ตั้งค่าเซลล์สมุดงานที่รองรับเป็น null สำหรับแผนภูมิคอลัมน์, ค่าที่แสดงผลสามารถเข้าถึงได้ผ่าน IChartDataPoint.getValue จุดข้อมูลจะคงอยู่ตำแหน่งประเภทเดิม, แต่แผนภูมิจะถือว่าค่าเป็นค่าว่างตามการตั้งค่าค่าว่างของแผนภูมิ
ตัวอย่างต่อไปนี้ล้างเฉพาะจุดที่สองในชุดแรก:
import com.aspose.slides.*;

final int firstSlideIndex = 0;
final int firstSeriesIndex = 0;
final int targetDataPointIndex = 1;

Presentation presentation = new Presentation();
try {
    ISlide slide = presentation.getSlides().get_Item(firstSlideIndex);

    IChart chart = slide.getShapes().addChart(ChartType.ClusteredColumn, 20, 20, 500, 200);

    IChartSeries series = chart.getChartData().getSeries().get_Item(firstSeriesIndex);
    IChartDataPoint dataPoint = series.getDataPoints().get_Item(targetDataPointIndex);
    dataPoint.getValue().getAsCell().setValue(null);

    presentation.save("clear_data_point_value.pptx", SaveFormat.Pptx);
} finally {
    presentation.dispose();
}
แผนภูมิกระจายจะแยกเซลล์ X และ Y, ส่วนแผนภูมิบับเบิลก็มีเซลล์ขนาดด้วย ลบเฉพาะเซลล์ที่เป็นค่าที่คุณต้องการลบ อย่าเรียก IChartDataPointCollection.clear เมื่อต้องการเก็บจุดอื่นไว้ เพราะเมธอดนั้นจะลบทุกจุดในคอลเลกชัน
ควบคุมการแสดงผลของเซลล์ว่าง
เซลล์ที่ซ่อนอยู่และมีค่าเป็นกรณีที่ต่างจากเซลล์ว่าง เพื่อรวมหรือแยกข้อมูลจากแถวและคอลัมน์ที่ซ่อนอยู่ ดูที่ Include Data from Hidden Rows and Columns
เซลล์สมุดงานที่ว่างแสดงถึงข้อมูลที่หายไป; เซลล์ที่มีค่า 0 แสดงถึงค่าตัวเลขที่ทราบอยู่ เรียก IChartDataCell.setValue ด้วย null เพื่อทำให้เซลล์ว่าง ค่าศูนย์เชิงตัวเลขจะคงเป็นศูนย์ไม่ว่าเซลล์ว่างจะตั้งค่าอย่างไร
ใช้ IChart.setDisplayBlanksAs เพื่อเลือกว่าต้องการให้แผนภูมิแสดงเซลล์ว่างอย่างไร การตั้งค่านี้ใช้กับแผนภูมิโดยรวม เปลี่ยนวิธีการวาดค่าว่างโดยไม่ต้องเติมศูนย์หรือค่าประมาณในเซลล์ของสมุดงาน
ตัวอย่างต่อไปนี้สร้างแผนภูมิเส้นที่มีชุดเดียว, ลบค่าของวันที่ 3, แล้วบันทึกแผนภูมิด้วยแต่ละโหมด ไม่ต้องใช้ไฟล์อินพุต IChartDataWorkbook ใช้ Worksheet 0, คอลัมน์ 0 สำหรับป้ายประเภท, คอลัมน์ 1 สำหรับค่า; แถว 0 เก็บชื่อชุด ข้อมูลสุดท้ายคือ 10, 20, empty, 30, 40.
import com.aspose.slides.*;

Presentation presentation = new Presentation();
try {
    ISlide slide = presentation.getSlides().get_Item(0);

    IChart chart = slide.getShapes().addChart(ChartType.LineWithMarkers, 40, 40, 640, 400);
    IChartData chartData = chart.getChartData();
    IChartDataWorkbook workbook = chartData.getChartDataWorkbook();

    chartData.getSeries().clear();
    chartData.getCategories().clear();

    IChartDataCell seriesNameCell = workbook.getCell(0, 0, 1, "Measurements");
    IChartSeries series = chartData.getSeries().add(seriesNameCell, chart.getType());
    int[] values = { 10, 20, 25, 30, 40 };

    for (int i = 0; i < values.length; i++) {
        IChartDataCell categoryCell = workbook.getCell(0, i + 1, 0, "Day " + (i + 1));
        chartData.getCategories().add(categoryCell);
        IChartDataCell valueCell = workbook.getCell(0, i + 1, 1, values[i]);
        series.getDataPoints().addDataPointForLineSeries(valueCell);
    }

    // ทำให้วัน 3 เป็นค่าว่างจริง ๆ ขณะยังคงรักษาประเภทและจุดข้อมูลไว้
    workbook.getCell(0, 3, 1).setValue(null);

    int[] modes = { DisplayBlanksAsType.Gap, DisplayBlanksAsType.Zero, DisplayBlanksAsType.Span };
    String[] modeNames = { "Gap", "Zero", "Span" };
    for (int i = 0; i < modes.length; i++) {
        chart.setDisplayBlanksAs(modes[i]);
        presentation.save("empty_cells_" + modeNames[i] + ".pptx", SaveFormat.Pptx);
    }
} finally {
    presentation.dispose();
}
แต่ละไฟล์ผลลัพธ์จะบันทึกโหมดที่กำหนดก่อนบันทึก: empty_cells_Gap.pptx, empty_cells_Zero.pptx และ empty_cells_Span.pptx หากต้องการบันทึกเพียงเวอร์ชันเดียวให้กำหนดโหมดที่ต้องการแล้วบันทึกการนำเสนอครั้งเดียวแทนการวนลูปทุกโหมด
การเปรียบเทียบด้านล่างแสดงข้อมูลเดียวกันในไฟล์ทั้งสาม วันที่ 3 จะเป็นค่าว่างในสมุดงานทุกกรณี:
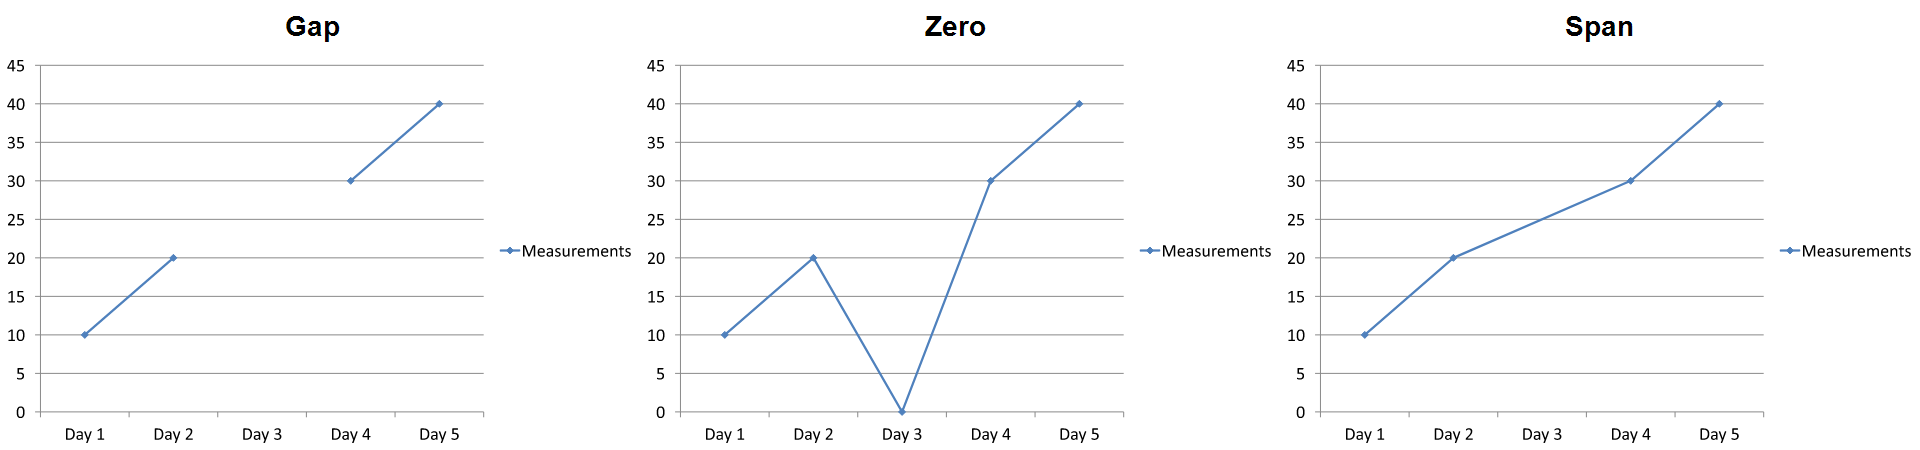
ผลลัพธ์ที่มองเห็นขึ้นอยู่กับประเภทแผนภูมิ แผนภูมิเส้นทำให้เปรียบเทียบโหมดทั้งหมดได้ง่าย แผนภูมิแท่งและคอลัมน์ไม่มีเส้นเพื่อเชื่อมต่อระหว่างประเภทที่หายไป ดังนั้น Span ไม่สามารถสร้างส่วนเชื่อมดังรูปได้; คอลัมน์ที่หายไปและคอลัมน์ความสูงศูนย์อาจดูคล้ายกันเช่นกัน แผนภูมิกระจายที่ใช้แค่เครื่องหมายก็ไม่มีเส้นเชื่อมเช่นกัน อย่าคาดหวังผลลัพธ์ที่แตกต่างสามแบบสำหรับทุกประเภทแผนภูมิ; ตรวจสอบผลลัพธ์ของประเภทที่คุณใช้
ตั้งค่าความกว้างช่องว่างระหว่างชุดข้อมูล
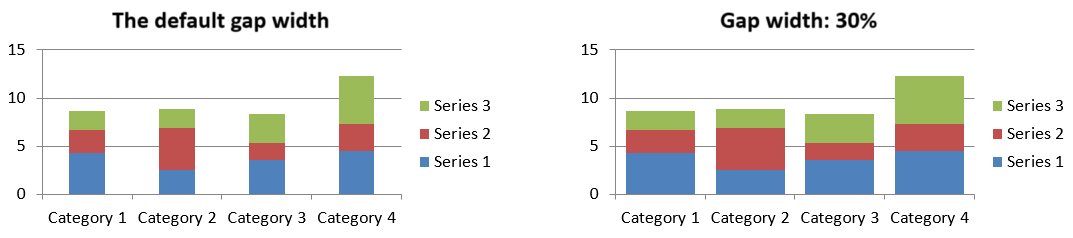
ความกว้างช่องว่างคือระยะห่างระหว่างกลุ่มแท่งหรือคอลัมน์ที่อยู่ติดกัน เป็นเปอร์เซ็นต์ของความกว้างแท่งหรือคอลัมน์ เช่นเดียวกับการซ้อน, มันเป็นของกลุ่มชุดพาเรนท์ ไม่ใช่ของชุดเดียว เรียก IChartSeriesGroup.setGapWidth ครั้งเดียวสำหรับกลุ่ม ค่ามากทำให้ช่องว่างระหว่างกลุ่มกว้างขึ้น; ค่าน้อยทำให้กลุ่มแน่นขึ้น
ตัวอย่างต่อไปนี้เปลี่ยนความกว้างช่องว่างและบันทึกการนำเสนอขั้นสุดท้ายเท่านั้น:
import com.aspose.slides.*;

final int firstSlideIndex = 0;
final int firstSeriesIndex = 0;
final int gapWidthPercent = 30;

Presentation presentation = new Presentation();
try {
    ISlide slide = presentation.getSlides().get_Item(firstSlideIndex);

    IChart chart = slide.getShapes().addChart(ChartType.StackedColumn, 20, 20, 500, 200);

    IChartSeries series = chart.getChartData().getSeries().get_Item(firstSeriesIndex);
    series.getParentSeriesGroup().setGapWidth(gapWidthPercent);

    presentation.save("gap_width_30.pptx", SaveFormat.Pptx);
} finally {
    presentation.dispose();
}
ผลลัพธ์:
คำถามที่พบบ่อย
แผนภูมิประเภทใดสนับสนุนชุดข้อมูล?
ทุกประเภทแผนภูมิที่อยู่ใน enumeration ChartType ใช้ข้อมูลแผนภูมิ, แต่โครงสร้างค่าและการตั้งค่าของชุดอาจต่างกัน ตัวอย่างเช่น แผนภูมิจัดประเภทใช้ประเภทและค่า, แผนภูมิกระจายใช้ค่า X และ Y, และแผนภูบับเบิลเพิ่มขนาดบับเบิล ใช้วิธีสร้างจุดข้อมูลที่ตรงกับประเภทของชุด ตัวเลือกเช่นการซ้อนและความกว้างช่องว่างใช้ได้เฉพาะกับกลุ่มแท่งหรือคอลัมน์ที่เข้ากัน
กลุ่มชุดข้อมูลในแผนภูมิคืออะไร?
IChartSeriesGroup ประกอบด้วยชุดที่เข้ากันและแชร์การตั้งค่าการวาดระดับกลุ่ม แผนภูมิแบบผสมอาจมีหลายกลุ่ม ดังนั้นการเปลี่ยนกลุ่มผ่านชุดหนึ่งอาจไม่ได้เปลี่ยนทุกชุดในแผนภูมิ
แผนภูมิที่สร้างใหม่มีข้อมูลเริ่มต้นหรือไม่?
มี โดยค่าดีฟอลต์ IShapeCollection.addChart จะสร้างชุดตัวอย่าง, ประเภท, และค่า คุณสามารถแก้ไขเซลล์เหล่านั้นหรือทำความสะอาดคอลเลกชันชุดและประเภทก่อนเพิ่มชุดข้อมูลที่กำหนดเองได้ มี overload ที่สามารถสร้างแผนภูมิที่ไม่มีข้อมูลเริ่มต้นได้ด้วย
วัตถุแผนภูมิเชื่อมต่อกับเซลล์สมุดงานอย่างไร?
ชื่อชุด, ป้ายประเภท, และค่าจุดข้อมูลอ้างอิงเซลล์ใน IChartDataWorkbook การเปลี่ยนเซลล์ที่อ้างอิงจะอัปเดตองค์ประกอบแผนภูมิเพื่อให้สอดคล้อง เมื่อสร้างข้อมูลกำหนดเองให้จัดแถวประเภทและแถวค่าชุดให้ตรงกันเพื่อให้แต่ละจุดวางภายใต้ประเภทที่ต้องการ
ฉันจะลบจุดเดียวแทนการลบชุดทั้งหมดได้อย่างไร?
ตั้งค่าเซลล์ค่าที่เกี่ยวข้องเป็น null เพื่อรักษาตำแหน่งประเภทของจุดไว้เป็นจุดว่าง ใช้ IChartDataPointCollection.clear เฉพาะเมื่อต้องการลบทุกจุดในชุดนั้น หากลบประเภทด้วย ควรอัปเดตทุกชุดให้ค่าของพวกเขายังคงสอดคล้องกับคอลเลกชันประเภท
จุดว่างจะแสดงอย่างไร?
ผลลัพธ์ขึ้นอยู่กับประเภทแผนภูมิและค่าที่กำหนดผ่าน IChart.setDisplayBlanksAs แผนภูมิที่รองรับสามารถแสดงค่าว่างเป็นช่องว่าง, เป็นค่า 0, หรือเชื่อมจุดใกล้เคียงกัน เลือกการตั้งค่าที่สอดคล้องกับความหมายของข้อมูลที่หายไปในงานนำเสนอของคุณ ดูที่ “ควบคุมการแสดงผลของเซลล์ว่าง” เพื่อดูตัวอย่างเต็มและเปรียบเทียบภาพ
ค่าลบถูกจัดรูปอย่างไร?
สำหรับชุดแท่ง, คอลัมน์, และบับเบิลที่สนับสนุน, เรียก IChartSeries.setInvertIfNegative แล้วกำหนดสีที่ได้จาก IChartSeries.getInvertedSolidFillColor คุณสามารถ Override พฤติกรรมสำหรับจุดเดียวด้วย IChartDataPoint.setInvertIfNegative วิธีเหล่านี้ส่งผลต่อการจัดรูปแบบ ไม่ใช่ค่าตัวเลขที่เก็บไว้
เมื่อทั้งชุดและจุดถูกจัดรูปแบบ, การจัดรูปแบบใดชนะ?
การจัดรูปแบบจุดข้อมูลโดยตรงจะชนะสำหรับจุดนั้น จุดอื่น ๆ จะใช้รูปแบบของชุดถ้ามี, หรือถ้าไม่มีรูปแบบชุด จะใช้รูปแบบอัตโนมัติของแผนภูมิและธีม การตั้งค่ากลุ่มเช่นการซ้อนและความกว้างช่องว่างควบคุมการจัดวางและไม่ใช่การ Override ระดับจุด
แผนภูมิมีข้อจำกัดจำนวนชุดข้อมูลหรือไม่?
Aspose.Slides ไม่กำหนดขีดจำกัดจำนวนชุดข้อมูลแยกต่างหาก ในทางปฏิบัติ ข้อจำกัดจะมาจากขนาดไฟล์นำเสนอ, หน่วยความจำที่มี, เวลาเรนเดอร์, และความอ่านง่ายของแผนภูมิ
ฉันควรทำอย่างไรเมื่อคอลัมน์ใกล้กันเกินไปหรือห่างกันเกินไป?
เรียก IChartSeriesGroup.setGapWidth บนกลุ่มชุดพาเรนท์ที่เกี่ยวข้อง เพิ่มค่าที่ทำให้ช่องว่างระหว่างกลุ่มกว้างขึ้น หรือ ลดค่าเพื่อทำให้กลุ่มใกล้กันมากขึ้น