
在 Android 上管理演示文稿中的图表数据系列
概述
图表将其绘制的数据存储在图表数据工作簿中。一个IChartSeries 表示一组相关值,系列中的每个IChartDataPoint 引用一个或多个工作簿单元格。IChartCategory 对象提供系列共享的标签或分组值。因此,系列名称、类别和点值连接到IChartDataCell 对象,而不仅仅是存储为显示文本。
对于典型的类别图,默认工作簿使用第 0 行存放系列名称,第 0 列存放类别名称,剩余单元格存放系列数值。传递给IChartDataWorkbook.getCell 的工作表、行和列索引是从零开始的。这种布局在创建默认数据图表时很有用,但不要认为每个已有图表都采用此布局。对于已加载的演示文稿,请在更改工作簿值之前检查系列、类别和数据点引用的单元格。
图表设置有三种不同的作用范围:
- 系列级别设置,例如IChartSeries.getFormat,提供该系列中所有点的默认外观。
- 数据点级别设置,例如IChartDataPoint.getFormat,覆盖该点的系列外观。
- 组设置适用于属于同一IChartSeriesGroup 的兼容系列。当需要设置诸如重叠或间隙宽度等选项时,通过IChartSeries.getParentSeriesGroup 访问该组。
当未显式设置点或系列填充时,图表样式和主题决定自动外观。当系列和点的格式同时存在时,点的格式优先于该点。
设置图表系列重叠
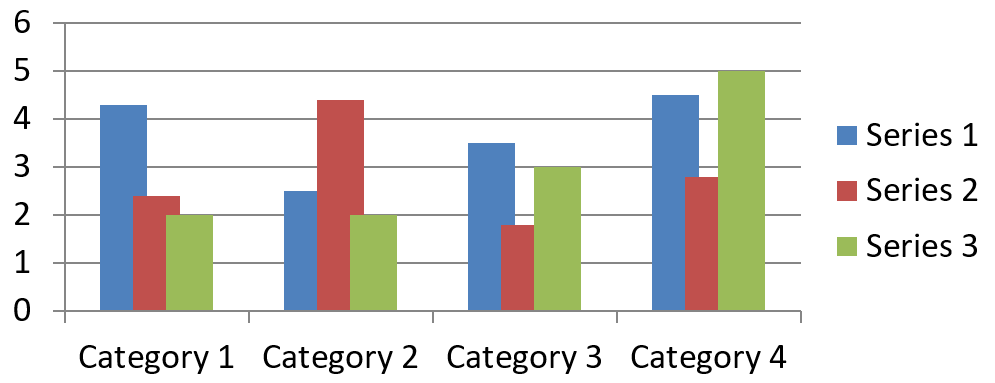
IChartSeries.getOverlap 报告二维图表中条形或柱形的重叠程度,范围为 -100 到 100%。它是父系列组设置的只读投影。使用IChartSeriesGroup.setOverlap 可更新该组内所有兼容系列。此选项适用于显示分组条形或柱形的图表类型;它不会影响组合图中不相关的系列组。
下面的示例为包含第一系列的组设置重叠:
import com.aspose.slides.*;

final int firstSlideIndex = 0;
final int firstSeriesIndex = 0;
final byte overlapPercent = 30;

Presentation presentation = new Presentation();
try {
    ISlide slide = presentation.getSlides().get_Item(firstSlideIndex);

    // 新图表包含示例系列、类别和数值。
    IChart chart = slide.getShapes().addChart(ChartType.ClusteredColumn, 20, 20, 500, 200);

    IChartSeries series = chart.getChartData().getSeries().get_Item(firstSeriesIndex);
    series.getParentSeriesGroup().setOverlap(overlapPercent);

    presentation.save("series_overlap.pptx", SaveFormat.Pptx);
} finally {
    presentation.dispose();
}
结果:
更改系列填充颜色
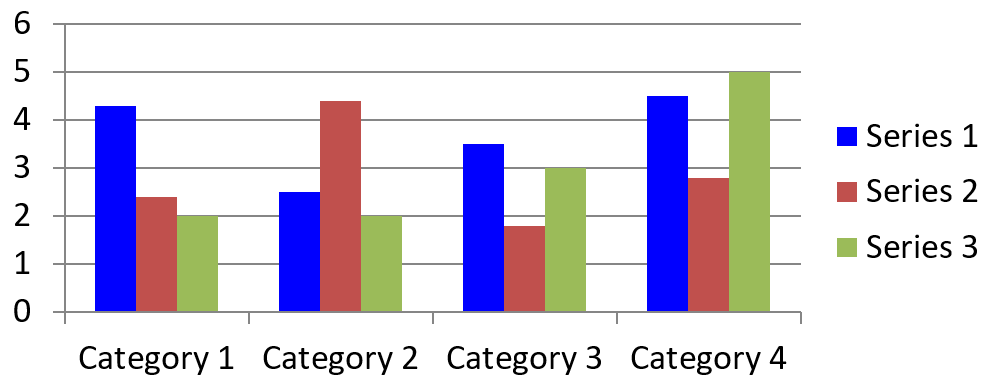
使用IChartSeries.getFormat 可为整个系列设置默认填充。如果某个点已经有显式填充,其IChartDataPoint.getFormat 设置将覆盖该点的系列填充。
下面的示例将第一系列的填充设为纯蓝色:
import com.aspose.slides.*;
import android.graphics.Color;

final int firstSlideIndex = 0;
final int firstSeriesIndex = 0;

Presentation presentation = new Presentation();
try {
    ISlide slide = presentation.getSlides().get_Item(firstSlideIndex);

    IChart chart = slide.getShapes().addChart(ChartType.ClusteredColumn, 20, 20, 500, 200);

    IChartSeries series = chart.getChartData().getSeries().get_Item(firstSeriesIndex);
    series.getFormat().getFill().setFillType(FillType.Solid);
    series.getFormat().getFill().getSolidFillColor().setColor(Color.BLUE);

    presentation.save("series_color.pptx", SaveFormat.Pptx);
} finally {
    presentation.dispose();
}
结果:
更改系列名称
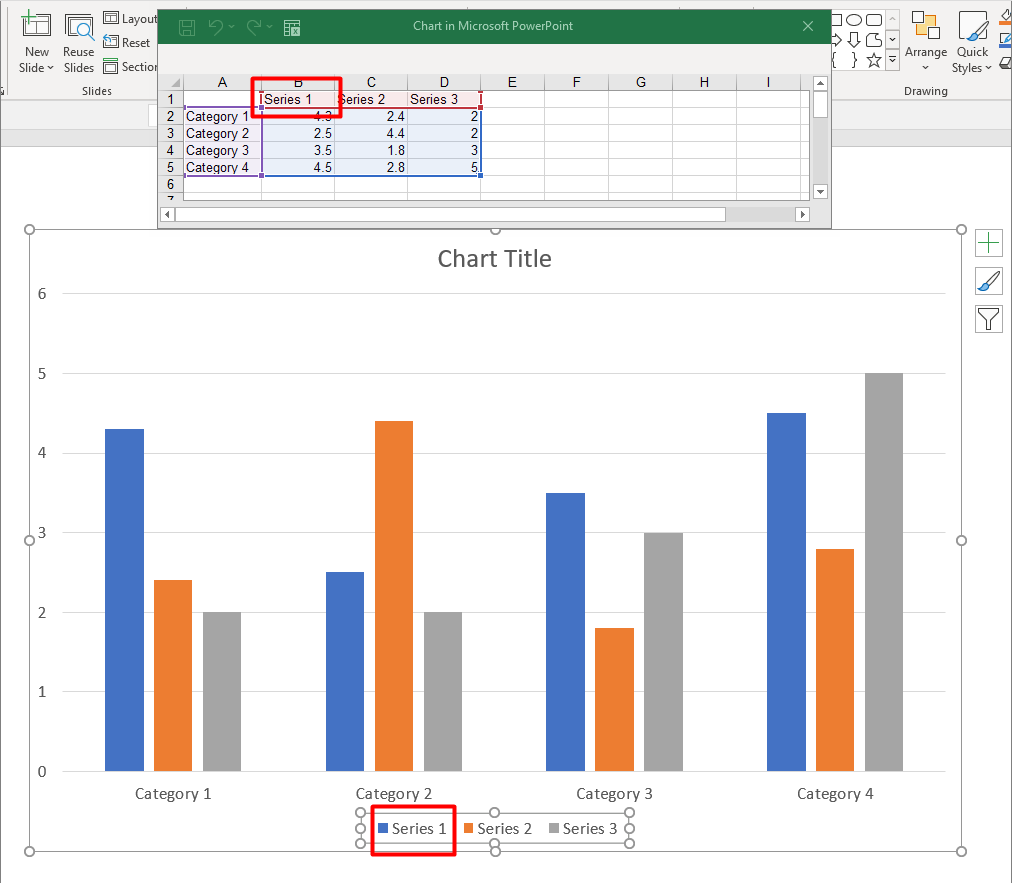
系列名称存储在图表数据工作簿中,通常显示在图例中。在为聚类柱形图创建的默认工作簿中,单元格 B1 位于第 0 行第 1 列,包含第一系列的名称。下面示例中的命名常量明确了该结构:
import com.aspose.slides.*;

final int firstSlideIndex = 0;
final int worksheetIndex = 0;
final int seriesNameRowIndex = 0;
final int firstSeriesColumnIndex = 1;

Presentation presentation = new Presentation();
try {
    ISlide slide = presentation.getSlides().get_Item(firstSlideIndex);

    IChart chart = slide.getShapes().addChart(ChartType.ClusteredColumn, 20, 20, 500, 200);

    IChartDataWorkbook workbook = chart.getChartData().getChartDataWorkbook();
    IChartDataCell seriesNameCell = workbook.getCell(worksheetIndex, seriesNameRowIndex, firstSeriesColumnIndex);
    seriesNameCell.setValue("Revenue");

    presentation.save("series_name.pptx", SaveFormat.Pptx);
} finally {
    presentation.dispose();
}
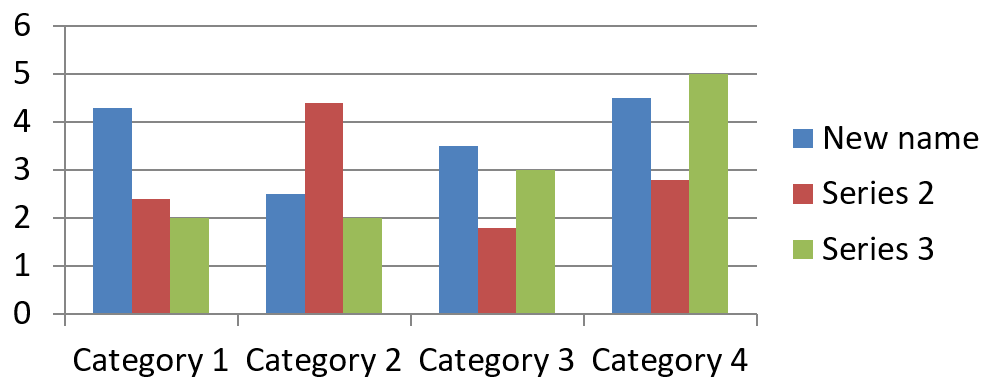
您也可以更新IChartSeries.getName 已引用的单元格。这种做法避免了对现有图表中特定行列的假设:
import com.aspose.slides.*;

final int firstSlideIndex = 0;
final int firstSeriesIndex = 0;
final int firstNameCellIndex = 0;

Presentation presentation = new Presentation();
try {
    ISlide slide = presentation.getSlides().get_Item(firstSlideIndex);

    IChart chart = slide.getShapes().addChart(ChartType.ClusteredColumn, 20, 20, 500, 200);

    IChartSeries series = chart.getChartData().getSeries().get_Item(firstSeriesIndex);
    IChartDataCell seriesNameCell = series.getName().getAsCells().get_Item(firstNameCellIndex);
    seriesNameCell.setValue("Revenue");

    presentation.save("series_name.pptx", SaveFormat.Pptx);
} finally {
    presentation.dispose();
}
结果:
从多个单元格创建带名称的系列
当产品名称和报告期间分别存储在不同工作簿单元格中时,组合系列名称非常有用。例如,您可以将 B1 中的 Product A 与 C1 中的 2026 合并为单个系列名称,同时保持两部分都链接到其来源单元格。
使用IChartDataWorkbook.getCellCollection 获取名称范围,然后将该集合传递给IChartSeriesCollection.add。skipHiddenCells 参数控制是否排除隐藏单元格:true 排除,false 包含。此示例使用 false 包含名称范围内的所有单元格。
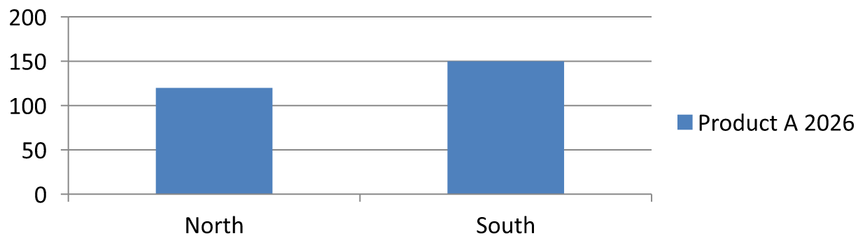
下面的示例创建了一个包含一个系列和两个数据点的演示文稿。单元格 B1:C1 仅提供系列名称;A2:A3 提供类别标签,B2:B3 提供数值。
import com.aspose.slides.*;

Presentation presentation = new Presentation();
try {
    ISlide slide = presentation.getSlides().get_Item(0);

    IChart chart = slide.getShapes().addChart(ChartType.ClusteredColumn, 50, 50, 620, 180);

    chart.getChartData().getSeries().clear();
    chart.getChartData().getCategories().clear();
    chart.setLegend(true);

    IChartDataWorkbook workbook = chart.getChartData().getChartDataWorkbook();
    workbook.clear(0);

    // 这两个单元格提供系列名称。
    workbook.getCell(0, 0, 1, "Product A");
    workbook.getCell(0, 0, 2, "2026");
    IChartCellCollection nameCells = workbook.getCellCollection("Sheet1!$B$1:$C$1", false);
    IChartSeries series = chart.getChartData().getSeries().add(nameCells, ChartType.ClusteredColumn);

    // 单独的单元格提供类别和数值数据点。
    IChartDataCell northCategory = workbook.getCell(0, 1, 0, "North");
    IChartDataCell southCategory = workbook.getCell(0, 2, 0, "South");
    chart.getChartData().getCategories().add(northCategory);
    chart.getChartData().getCategories().add(southCategory);
    IChartDataCell northValue = workbook.getCell(0, 1, 1, 120);
    IChartDataCell southValue = workbook.getCell(0, 2, 1, 150);
    series.getDataPoints().addDataPointForBarSeries(northValue);
    series.getDataPoints().addDataPointForBarSeries(southValue);

    presentation.save("composite_series_name.pptx", SaveFormat.Pptx);
} finally {
    presentation.dispose();
}
生成的系列名称为 Product A 2026,两单元格值之间有一个空格。图例将其显示为两个列的单一条目。下图展示了结果:
获取自动系列填充颜色
IChartSeries.getAutomaticSeriesColor 返回根据系列索引和图表样式计算得到的 Android ARGB 颜色整数。当系列填充未显式定义时使用此颜色。调用该方法仅读取计算得到的颜色,不会分配新填充。
下面的示例打印每个默认系列的自动颜色整数:
import com.aspose.slides.*;

final int firstSlideIndex = 0;

Presentation presentation = new Presentation();
try {
    ISlide slide = presentation.getSlides().get_Item(firstSlideIndex);

    IChart chart = slide.getShapes().addChart(ChartType.ClusteredColumn, 20, 20, 500, 200);

    int seriesCount = chart.getChartData().getSeries().size();
    for (int seriesIndex = 0; seriesIndex < seriesCount; seriesIndex++) {
        IChartSeries series = chart.getChartData().getSeries().get_Item(seriesIndex);
        int automaticColor = series.getAutomaticSeriesColor();
        System.out.println("Series " + seriesIndex + ": " + automaticColor);
    }
} finally {
    presentation.dispose();
}
整数值的具体数值取决于图表样式和主题。
为图表系列设置负数填充颜色反转
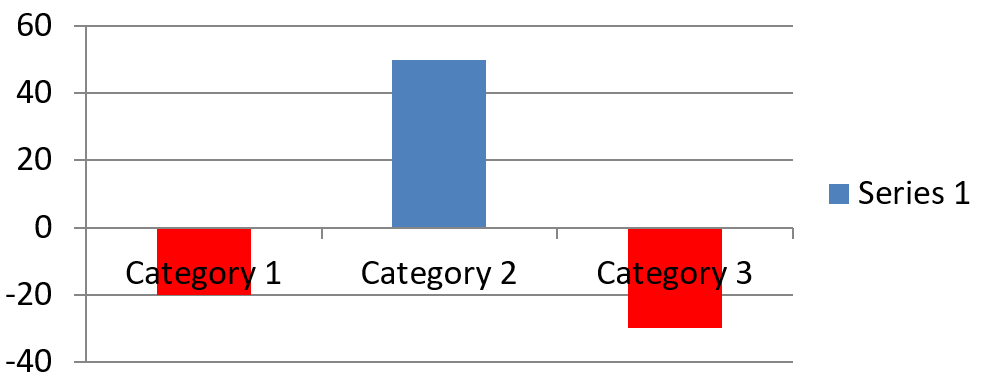
对于条形、柱形和气泡系列,IChartSeries.setInvertIfNegative 可以在负值时使用不同的填充。将常规系列填充设为实心,启用反转,并通过IChartSeries.getInvertedSolidFillColor 为负值指定颜色。工作簿中的负数保持不变,仅改变其显示颜色。
下面的示例用一个系列替换默认图表数据。工作表第 0 行包含系列名称,第 0 列包含类别名称,第 1 列包含数值:
import com.aspose.slides.*;
import android.graphics.Color;

final int firstSlideIndex = 0;
final int worksheetIndex = 0;
final int headerRowIndex = 0;
final int categoryColumnIndex = 0;
final int firstSeriesColumnIndex = 1;
final int firstDataRowIndex = 1;

String[] categoryNames = { "Category 1", "Category 2", "Category 3" };
int[] seriesValues = { -20, 50, -30 };

Presentation presentation = new Presentation();
try {
    ISlide slide = presentation.getSlides().get_Item(firstSlideIndex);

    IChart chart = slide.getShapes().addChart(ChartType.ClusteredColumn, 20, 20, 500, 200);
    IChartData chartData = chart.getChartData();
    IChartDataWorkbook workbook = chartData.getChartDataWorkbook();

    chartData.getSeries().clear();
    chartData.getCategories().clear();

    IChartDataCell seriesNameCell = workbook.getCell(worksheetIndex, headerRowIndex, firstSeriesColumnIndex, "Series 1");
    int chartType = chart.getType();
    IChartSeries series = chartData.getSeries().add(seriesNameCell, chartType);

    for (int categoryIndex = 0; categoryIndex < categoryNames.length; categoryIndex++) {
        int dataRowIndex = firstDataRowIndex + categoryIndex;
        String categoryName = categoryNames[categoryIndex];
        int seriesValue = seriesValues[categoryIndex];

        IChartDataCell categoryCell = workbook.getCell(worksheetIndex, dataRowIndex, categoryColumnIndex, categoryName);
        chartData.getCategories().add(categoryCell);

        IChartDataCell valueCell = workbook.getCell(worksheetIndex, dataRowIndex, firstSeriesColumnIndex, seriesValue);
        series.getDataPoints().addDataPointForBarSeries(valueCell);
    }

    int automaticSeriesColor = series.getAutomaticSeriesColor();
    series.getFormat().getFill().setFillType(FillType.Solid);
    series.getFormat().getFill().getSolidFillColor().setColor(automaticSeriesColor);
    series.setInvertIfNegative(true);
    series.getInvertedSolidFillColor().setColor(Color.RED);

    presentation.save("inverted_solid_fill_color.pptx", SaveFormat.Pptx);
} finally {
    presentation.dispose();
}
结果:
您也可以通过IChartDataPoint.setInvertIfNegative 为单个点启用反转。下面的示例在系列上禁用反转,仅在选定点上启用,并为该点分配负值以便看到效果:
import com.aspose.slides.*;
import android.graphics.Color;

final int firstSlideIndex = 0;
final int firstSeriesIndex = 0;
final int targetDataPointIndex = 2;
final int negativeValue = -30;

Presentation presentation = new Presentation();
try {
    ISlide slide = presentation.getSlides().get_Item(firstSlideIndex);

    IChart chart = slide.getShapes().addChart(ChartType.ClusteredColumn, 20, 20, 500, 200);

    IChartSeries series = chart.getChartData().getSeries().get_Item(firstSeriesIndex);
    int automaticSeriesColor = series.getAutomaticSeriesColor();
    series.getFormat().getFill().setFillType(FillType.Solid);
    series.getFormat().getFill().getSolidFillColor().setColor(automaticSeriesColor);
    series.getInvertedSolidFillColor().setColor(Color.RED);
    series.setInvertIfNegative(false);

    IChartDataPoint dataPoint = series.getDataPoints().get_Item(targetDataPointIndex);
    dataPoint.getValue().getAsCell().setValue(negativeValue);
    dataPoint.setInvertIfNegative(true);

    presentation.save("data_point_invert_color_if_negative.pptx", SaveFormat.Pptx);
} finally {
    presentation.dispose();
}
清除特定数据点的值
要让某一点为空而不删除其他点,请将其对应的工作簿单元格设为 null。对于柱形图,绘制的值可通过IChartDataPoint.getValue 获取。数据点仍保留在相同的类别位置,但图表会根据空值设置将其视为空白。
下面的示例仅清除第一系列的第二个点:
import com.aspose.slides.*;

final int firstSlideIndex = 0;
final int firstSeriesIndex = 0;
final int targetDataPointIndex = 1;

Presentation presentation = new Presentation();
try {
    ISlide slide = presentation.getSlides().get_Item(firstSlideIndex);

    IChart chart = slide.getShapes().addChart(ChartType.ClusteredColumn, 20, 20, 500, 200);

    IChartSeries series = chart.getChartData().getSeries().get_Item(firstSeriesIndex);
    IChartDataPoint dataPoint = series.getDataPoints().get_Item(targetDataPointIndex);
    dataPoint.getValue().getAsCell().setValue(null);

    presentation.save("clear_data_point_value.pptx", SaveFormat.Pptx);
} finally {
    presentation.dispose();
}
散点图使用单独的 X 和 Y 单元格,气泡图还使用大小单元格。仅清除您想要移除的数值单元格。不要在想保留其他点时调用IChartDataPointCollection.clear,因为该方法会移除集合中的所有数据点。
控制空单元格的显示方式
包含数值的隐藏单元格与空单元格是不同的情况。要包含或排除隐藏工作表行列中的数据,请参阅Include Data from Hidden Rows and Columns。
空工作簿单元格表示缺失数据;包含 0 的单元格表示已知数值。调用IChartDataCell.setValue 并传入 null 可使单元格为空。数值零始终保持为零,不受空单元格设置影响。
使用IChart.setDisplayBlanksAs 选择图表如何显示空单元格。此设置适用于整个图表,会改变空白的绘制方式,而不会将空工作簿单元格填充为零或插值。
下面的完整示例创建了一个包含一个系列的折线图,清除第 3 天的数值,并分别以每种模式保存同一图表。无需输入文件。IChartDataWorkbook 使用工作表 0,第 0 列存放类别标签,第 1 列存放数值;第 0 行保存系列名称。最终数据为 10, 20, empty, 30, 40。
import com.aspose.slides.*;

Presentation presentation = new Presentation();
try {
    ISlide slide = presentation.getSlides().get_Item(0);

    IChart chart = slide.getShapes().addChart(ChartType.LineWithMarkers, 40, 40, 640, 400);
    IChartData chartData = chart.getChartData();
    IChartDataWorkbook workbook = chartData.getChartDataWorkbook();

    chartData.getSeries().clear();
    chartData.getCategories().clear();

    IChartDataCell seriesNameCell = workbook.getCell(0, 0, 1, "Measurements");
    IChartSeries series = chartData.getSeries().add(seriesNameCell, chart.getType());
    int[] values = { 10, 20, 25, 30, 40 };

    for (int i = 0; i < values.length; i++) {
        IChartDataCell categoryCell = workbook.getCell(0, i + 1, 0, "Day " + (i + 1));
        chartData.getCategories().add(categoryCell);
        IChartDataCell valueCell = workbook.getCell(0, i + 1, 1, values[i]);
        series.getDataPoints().addDataPointForLineSeries(valueCell);
    }

    // 将第 3 天真正留为空,同时保留其类别和数据点。
    workbook.getCell(0, 3, 1).setValue(null);

    int[] modes = { DisplayBlanksAsType.Gap, DisplayBlanksAsType.Zero, DisplayBlanksAsType.Span };
    String[] modeNames = { "Gap", "Zero", "Span" };
    for (int i = 0; i < modes.length; i++) {
        chart.setDisplayBlanksAs(modes[i]);
        presentation.save("empty_cells_" + modeNames[i] + ".pptx", SaveFormat.Pptx);
    }
} finally {
    presentation.dispose();
}
每个输出文件在保存前存储相应模式的名称:empty_cells_Gap.pptx、empty_cells_Zero.pptx 和 empty_cells_Span.pptx。若只需一种版本,可在保存演示文稿前仅设置所需模式,而无需遍历所有模式。
下面的比较展示了三个文件中相同的数据。第 3 天在工作簿中始终为空:
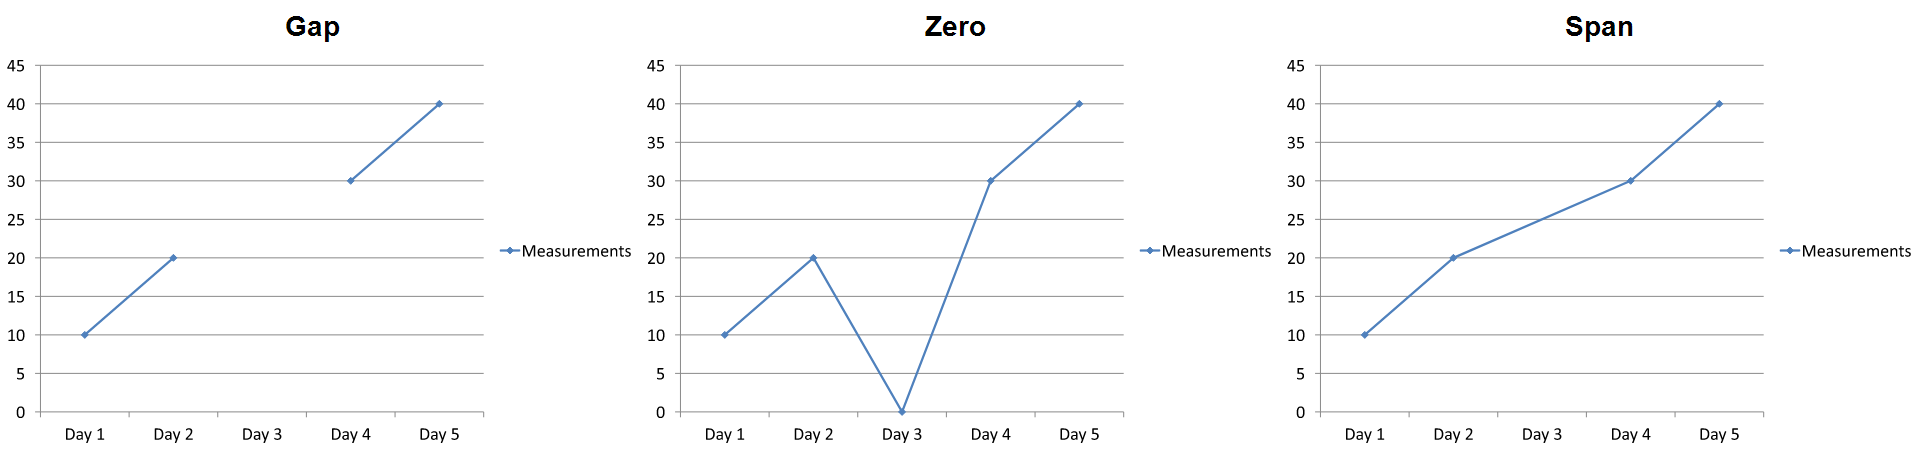
可见效果取决于图表类型。折线图能够直观比较所有三种模式。条形和柱形图没有可跨缺失类别连接的线段,因此 Span 无法产生如上所示的连接段;缺失的柱形和零高度的柱形也可能看起来相同。类似地,仅带标记的散点图也没有连接线。不要期望每种图表类型都呈现三种明显不同的结果;请检查您使用的图表类型的实际输出。
设置系列间隙宽度
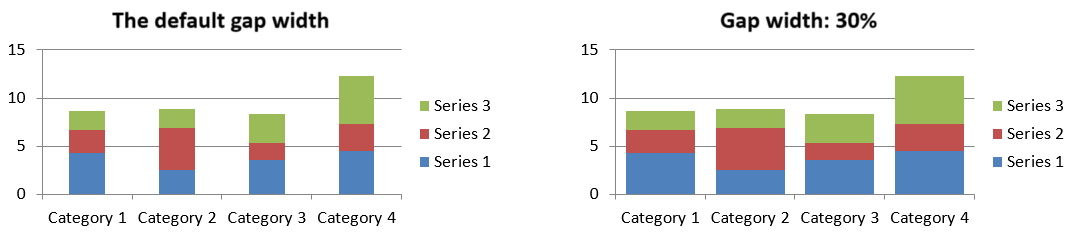
间隙宽度是相邻条形或柱形簇之间的空间,表示为条形或柱形宽度的百分比。与重叠类似,它属于父系列组,而不是单个系列。对组调用一次IChartSeriesGroup.setGapWidth 即可。较大的数值会在簇之间产生更大的间隔,较小的数值则使簇更紧密。
下面的示例更改间隙宽度并仅保存最终演示文稿:
import com.aspose.slides.*;

final int firstSlideIndex = 0;
final int firstSeriesIndex = 0;
final int gapWidthPercent = 30;

Presentation presentation = new Presentation();
try {
    ISlide slide = presentation.getSlides().get_Item(firstSlideIndex);

    IChart chart = slide.getShapes().addChart(ChartType.StackedColumn, 20, 20, 500, 200);

    IChartSeries series = chart.getChartData().getSeries().get_Item(firstSeriesIndex);
    series.getParentSeriesGroup().setGapWidth(gapWidthPercent);

    presentation.save("gap_width_30.pptx", SaveFormat.Pptx);
} finally {
    presentation.dispose();
}
结果:
常见问题解答
哪些图表类型支持数据系列?
所有由ChartType 枚举表示的图表类型都使用图表数据,但它们的系列并非全部具有相同的值结构或设置。例如,类别图使用类别和数值,散点图使用 X 和 Y 值,气泡图另外使用气泡大小。请使用与系列类型相匹配的数据点创建方法。诸如重叠和间隙宽度的选项仅适用于兼容的条形或柱形组。
什么是图表系列组?
IChartSeriesGroup 包含共享组级绘图设置的兼容系列。组合图可以包含多个组,因此通过某一系列访问的组设置不一定会更改图表中所有系列。
新创建的图表是否包含默认数据?
是的。默认情况下,IShapeCollection.addChart 会创建示例系列、类别和数值。您可以编辑这些单元格,或在添加完全自定义的数据集之前清除系列和类别集合。也可以使用重载方法创建不含默认数据的图表。
图表对象如何与工作簿单元格关联?
系列名称、类别标签和数据点值引用IChartDataWorkbook 中的单元格。更改被引用的单元格会更新相应的图表元素。构建自定义数据时,请保持类别行和系列值行对齐,以便每个点绘制在预期的类别下。
如何只清除一个点而不是整个系列?
将相关的值单元格设为 null,即可保留该点的类别位置为空点。仅在希望删除该系列所有点时才使用IChartDataPointCollection.clear。如果同时删除了类别,请更新所有系列,使它们的值仍与类别集合保持对齐。
空点如何显示?
结果取决于图表类型以及通过IChart.setDisplayBlanksAs 配置的值。受支持的图表可以将空白显示为间隙、零值或连接相邻点。请选择与演示文稿中缺失数据意义相匹配的设置。完整示例和视觉比较请参阅控制空单元格的显示方式。
负值如何格式化?
对于受支持的条形、柱形和气泡系列,调用IChartSeries.setInvertIfNegative 并设置IChartSeries.getInvertedSolidFillColor 返回的颜色。您也可以通过IChartDataPoint.setInvertIfNegative 为单个点覆盖此行为。这些方法影响格式,而非存储的数值。
当系列和点都设置格式时,哪个格式生效?
显式的数据点格式对该点具有最高优先级。其他点继续使用显式的系列格式,若系列格式未定义,则使用自动的图表样式和主题。组设置(如重叠和间隙宽度)控制布局,不属于点级别的格式覆盖。
图表可以包含多少系列,有没有上限?
Aspose.Slides 并未设定单独的固定系列计数上限。实际限制取决于演示文稿文件的约束、可用内存、渲染时间以及图表的可读性。
当列之间太靠近或太远时应如何调整?
对相应的父系列组调用IChartSeriesGroup.setGapWidth。增大数值可扩大簇之间的间距,减小则使簇更靠近。