
Gerenciar rótulos de dados de gráficos em apresentações em .NET
Introdução
Os rótulos de dados exibem informações sobre as séries do gráfico e pontos de dados individuais, ajudando os leitores a identificar valores e compreender o gráfico. Este artigo explica como formatar valores, exibir percentuais, ler o texto dos rótulos, controlar rótulos além do máximo do eixo, ajustar o espaçamento dos rótulos do eixo de categoria e posicionar rótulos em gráficos de pizza.
Definir precisão dos dados nos rótulos de dados do gráfico
Use NumberFormatOfValues para formatar os valores da série. Este exemplo cria um gráfico de linhas com dados padrão, exibe sua tabela de dados e habilita os rótulos de valores para a primeira série. O formato #,##0.00 exibe um separador de milhares e duas casas decimais sem alterar os valores subjacentes.
using Aspose.Slides;
using Aspose.Slides.Charts;
using Aspose.Slides.Export;

using var presentation = new Presentation();
var slide = presentation.Slides[0];

var chart = slide.Shapes.AddChart(ChartType.Line, 50, 50, 450, 300);
chart.HasDataTable = true;

var series = chart.ChartData.Series[0];
series.NumberFormatOfValues = "#,##0.00";
series.Labels.DefaultDataLabelFormat.ShowValue = true;

presentation.Save("PrecisionOfDatalabels_out.pptx", SaveFormat.Pptx);
Exibir percentual como rótulos
Para um gráfico de colunas empilhadas, calcule cada valor como percentual do total da sua categoria e atribua o texto a TextFrameForOverriding. Este exemplo usa os dados padrão do gráfico e exibe percentuais com duas casas decimais em fonte de 8 pontos. Categorias com total zero são ignoradas para evitar divisão por zero. Recalcule o texto personalizado do rótulo se os dados do gráfico forem alterados.
using System;
using Aspose.Slides;
using Aspose.Slides.Charts;
using Aspose.Slides.Export;

using var presentation = new Presentation();
var slide = presentation.Slides[0];

var chart = slide.Shapes.AddChart(ChartType.StackedColumn, 20, 20, 400, 400);

var categoryTotals = new double[chart.ChartData.Categories.Count];
for (int k = 0; k < chart.ChartData.Categories.Count; k++)
{
    for (int i = 0; i < chart.ChartData.Series.Count; i++)
    {
        var series = chart.ChartData.Series[i];
        var pointValue = Convert.ToDouble(series.DataPoints[k].Value.Data);
        categoryTotals[k] += pointValue;
    }
}

for (int x = 0; x < chart.ChartData.Series.Count; x++)
{
    var series = chart.ChartData.Series[x];
    series.Labels.DefaultDataLabelFormat.ShowLegendKey = false;

    for (int j = 0; j < series.DataPoints.Count; j++)
    {
        var label = series.DataPoints[j].Label;
        if (categoryTotals[j] == 0)
        {
            continue;
        }

        var pointValue = Convert.ToDouble(series.DataPoints[j].Value.Data);
        var dataPointPercent = (pointValue / categoryTotals[j]) * 100;

        var portion = new Portion();
        portion.Text = string.Format("{0:F2} %", dataPointPercent);
        portion.PortionFormat.FontHeight = 8f;

        label.TextFrameForOverriding.Text = "";

        var paragraph = label.TextFrameForOverriding.Paragraphs[0];
        paragraph.Portions.Add(portion);

        label.DataLabelFormat.ShowValue = true;
        label.DataLabelFormat.ShowSeriesName = false;
        label.DataLabelFormat.ShowPercentage = false;
        label.DataLabelFormat.ShowLegendKey = false;
        label.DataLabelFormat.ShowCategoryName = false;
        label.DataLabelFormat.ShowBubbleSize = false;
    }
}

presentation.Save("DisplayPercentageAsLabels_out.pptx", SaveFormat.Pptx);
Definir símbolo de percentual nos rótulos de dados do gráfico
Quando os valores são armazenados como frações, use NumberFormat para exibir percentuais. Defina IsNumberFormatLinkedToSource como false para aplicar o formato do rótulo independentemente das células de origem.
Este exemplo cria um gráfico de colunas empilhadas 100 % com séries vermelha e azul em quatro categorias. Cada par de valores soma 1. O formato de rótulo 0.0% exibe 0.30 como 30.0 %, enquanto o eixo vertical usa duas casas decimais. Ambas as séries usam texto de rótulo branco, tamanho 10 pt.
using System.Drawing;
using Aspose.Slides;
using Aspose.Slides.Charts;
using Aspose.Slides.Export;

using var presentation = new Presentation();
var slide = presentation.Slides[0];

var chart = slide.Shapes.AddChart(ChartType.PercentsStackedColumn, 20, 20, 500, 400);

chart.Axes.VerticalAxis.IsNumberFormatLinkedToSource = false;
chart.Axes.VerticalAxis.NumberFormat = "0.00%";

chart.ChartData.Series.Clear();
chart.ChartData.Categories.Clear();

var workbook = chart.ChartData.ChartDataWorkbook;
int worksheetIndex = 0;
for (int i = 0; i < 4; i++)
{
    var categoryCell = workbook.GetCell(worksheetIndex, i + 1, 0, $"Category {i + 1}");
    chart.ChartData.Categories.Add(categoryCell);
}

string[] seriesNames = { "Reds", "Blues" };
Color[] seriesColors = { Color.Red, Color.Blue };
double[,] values = { { 0.30, 0.50, 0.80, 0.65 }, { 0.70, 0.50, 0.20, 0.35 } };

for (int i = 0; i < seriesNames.Length; i++)
{
    var seriesCell = workbook.GetCell(worksheetIndex, 0, i + 1, seriesNames[i]);
    var series = chart.ChartData.Series.Add(seriesCell, chart.Type);
    for (int j = 0; j < 4; j++)
    {
        var valueCell = workbook.GetCell(worksheetIndex, j + 1, i + 1, values[i, j]);
        series.DataPoints.AddDataPointForBarSeries(valueCell);
    }

    series.Format.Fill.FillType = FillType.Solid;
    series.Format.Fill.SolidFillColor.Color = seriesColors[i];

    var labelFormat = series.Labels.DefaultDataLabelFormat;
    labelFormat.ShowValue = true;
    labelFormat.IsNumberFormatLinkedToSource = false;
    labelFormat.NumberFormat = "0.0%";
    labelFormat.TextFormat.PortionFormat.FontHeight = 10;
    labelFormat.TextFormat.PortionFormat.FillFormat.FillType = FillType.Solid;
    labelFormat.TextFormat.PortionFormat.FillFormat.SolidFillColor.Color = Color.White;
}

presentation.Save("SetDataLabelsPercentageSign_out.pptx", SaveFormat.Pptx);
Ler o texto real dos rótulos de dados
Use GetActualLabelText para recuperar o texto produzido pelas configurações de um rótulo de dados. Isso é útil ao extrair rótulos para relatórios, pesquisar conteúdo de apresentações ou validar gráficos gerados. No exemplo abaixo, o formato padrão de rótulo de dados combina o nome de cada categoria, o nome da série e o valor. Um ponto formata seu valor como percentual, e outro usa texto personalizado de TextFrameForOverriding.
using System;
using Aspose.Slides;
using Aspose.Slides.Charts;

using var presentation = new Presentation();
var slide = presentation.Slides[0];

var chart = slide.Shapes.AddChart(ChartType.ClusteredColumn, 20, 20, 500, 300);

chart.ChartData.Series.Clear();
chart.ChartData.Categories.Clear();

var workbook = chart.ChartData.ChartDataWorkbook;
chart.ChartData.Categories.Add(workbook.GetCell(0, 1, 0, "Q1"));
chart.ChartData.Categories.Add(workbook.GetCell(0, 2, 0, "Q2"));

var north = chart.ChartData.Series.Add(workbook.GetCell(0, 0, 1, "North"), chart.Type);
north.DataPoints.AddDataPointForBarSeries(workbook.GetCell(0, 1, 1, 0.25));
north.DataPoints.AddDataPointForBarSeries(workbook.GetCell(0, 2, 1, 0.75));

var south = chart.ChartData.Series.Add(workbook.GetCell(0, 0, 2, "South"), chart.Type);
south.DataPoints.AddDataPointForBarSeries(workbook.GetCell(0, 1, 2, 0.40));
south.DataPoints.AddDataPointForBarSeries(workbook.GetCell(0, 2, 2, 0.60));

foreach (var series in chart.ChartData.Series)
{
    var format = series.Labels.DefaultDataLabelFormat;
    format.ShowCategoryName = true;
    format.ShowSeriesName = true;
    format.ShowValue = true;
}

north.Labels[1].DataLabelFormat.IsNumberFormatLinkedToSource = false;
north.Labels[1].DataLabelFormat.NumberFormat = "0%";
south.Labels[0].TextFrameForOverriding.Text = "Reviewed";

foreach (var series in chart.ChartData.Series)
{
    foreach (var point in series.DataPoints)
    {
        var label = point.Label;
        if (!label.IsVisible)
        {
            continue;
        }

        Console.WriteLine($"Value: {point.Value.Data}; label: {label.GetActualLabelText()}");
    }
}
O número armazenado em um ponto de dados permanece 0.75, mesmo quando seu rótulo mostra 75% junto com os nomes da categoria e da série. Texto personalizado substitui o texto gerado do rótulo. GetActualLabelText devolve a string resultante do rótulo em ambos os casos. Verifique IsVisible separadamente, como mostrado acima, quando quiser extrair apenas rótulos visíveis.
Controlar rótulos de dados além do máximo do eixo
Quando você limita manualmente o intervalo de um eixo, alguns pontos de dados podem exceder seu máximo. Use ShowDataLabelsOverMaximum para controlar se seus rótulos de dados são exibidos. Essa configuração altera a visibilidade dos rótulos; não altera o intervalo do eixo nem os valores subjacentes.
O exemplo abaixo cria um gráfico de colunas agrupadas 2D com valores 60 e 120. Define IsAutomaticMaxValue como false e MaxValue como 100 no eixo vertical. O primeiro slide permite rótulos além do máximo; uma cópia desse slide os desabilita. Ambos os slides são salvos em DataLabelsOverMaximum.pptx.
Habilite rótulos de valor com ShowValue. A configuração no nível do gráfico não habilita a exibição de valores por si só nem substitui a desativação de exibição de valor de um rótulo individual. Este exemplo habilita valores para toda a série e usa Position para posicionar os rótulos na extremidade externa de cada coluna.
using Aspose.Slides;
using Aspose.Slides.Charts;
using Aspose.Slides.Export;

using var presentation = new Presentation();
var slide = presentation.Slides[0];

var chart = slide.Shapes.AddChart(ChartType.ClusteredColumn, 50, 50, 600, 400);
chart.HasLegend = false;

chart.ChartData.Series.Clear();
chart.ChartData.Categories.Clear();

var workbook = chart.ChartData.ChartDataWorkbook;

var firstCategory = workbook.GetCell(0, 1, 0, "Within range");
var secondCategory = workbook.GetCell(0, 2, 0, "Above maximum");

chart.ChartData.Categories.Add(firstCategory);
chart.ChartData.Categories.Add(secondCategory);

var seriesName = workbook.GetCell(0, 0, 1, "Values");
var series = chart.ChartData.Series.Add(seriesName, chart.Type);

var firstValue = workbook.GetCell(0, 1, 1, 60);
var secondValue = workbook.GetCell(0, 2, 1, 120);

series.DataPoints.AddDataPointForBarSeries(firstValue);
series.DataPoints.AddDataPointForBarSeries(secondValue);

series.Labels.DefaultDataLabelFormat.ShowValue = true;
series.Labels.DefaultDataLabelFormat.Position = LegendDataLabelPosition.OutsideEnd;

chart.Axes.VerticalAxis.IsAutomaticMaxValue = false;
chart.Axes.VerticalAxis.MaxValue = 100;
chart.ShowDataLabelsOverMaximum = true;

var secondSlide = presentation.Slides.AddClone(slide);
var secondChart = (IChart)secondSlide.Shapes[0];
secondChart.ShowDataLabelsOverMaximum = false;

presentation.Save("DataLabelsOverMaximum.pptx", SaveFormat.Pptx);
As imagens a seguir mostram os slides salvos renderizados no Microsoft PowerPoint. Com true, o rótulo 120 está visível no limite superior; com false, ele está oculto. O rótulo 60 permanece visível, o máximo do eixo permanece em 100 e o segundo ponto de dados continua 120 em ambos os casos.
| ShowDataLabelsOverMaximum = true | ShowDataLabelsOverMaximum = false |
|---|---|
 |
 |
Chart Type
Este exemplo usa um gráfico de colunas 2D com eixo de valores. Gráficos sem eixo de valores, como gráficos de pizza e rosquinha, não possuem um máximo de eixo para limitar dessa forma.Definir distância do rótulo a partir de um eixo
Use LabelOffset para controlar a distância entre os rótulos do eixo de categoria e o eixo. O valor é uma porcentagem do tamanho máximo da fonte dos rótulos do eixo. Este exemplo cria um gráfico de colunas agrupadas e define o deslocamento do rótulo do eixo horizontal para 500. Essa configuração afeta os rótulos do eixo de categoria, e não os rótulos associados a pontos de dados individuais.
using Aspose.Slides;
using Aspose.Slides.Charts;
using Aspose.Slides.Export;

using var presentation = new Presentation();
var slide = presentation.Slides[0];

var chart = slide.Shapes.AddChart(ChartType.ClusteredColumn, 20, 20, 500, 300);
chart.Axes.HorizontalAxis.LabelOffset = 500;

presentation.Save("SetCategoryAxisLabelDistance_out.pptx", SaveFormat.Pptx);
Ajustar localização do rótulo
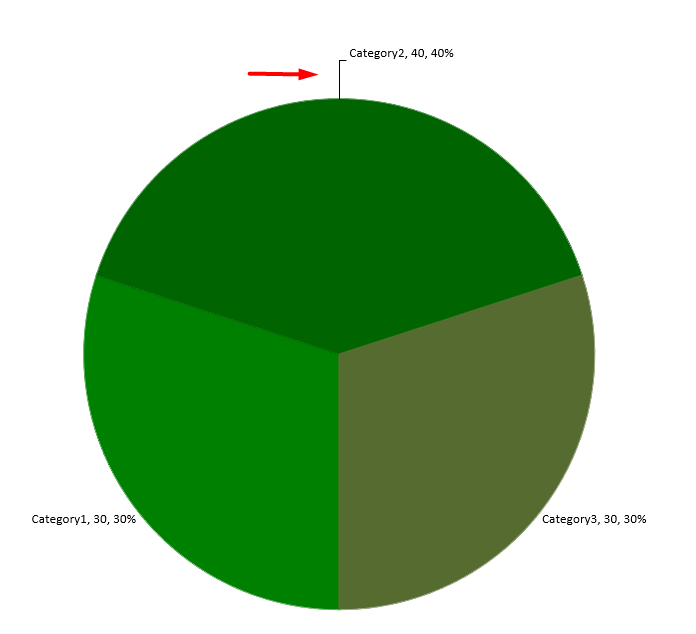
Em um gráfico de pizza, ajuste as posições dos rótulos de dados para melhorar o espaçamento e criar espaço para as linhas de orientação.
Este exemplo exibe o valor do primeiro ponto de dados, posiciona seu rótulo fora da fatia e ajusta os deslocamentos X e Y. Esses deslocamentos são relativos à largura e à altura do gráfico, respectivamente.
using Aspose.Slides;
using Aspose.Slides.Charts;
using Aspose.Slides.Export;

using var presentation = new Presentation();
var slide = presentation.Slides[0];

var chart = slide.Shapes.AddChart(ChartType.Pie, 50, 50, 200, 200);
var series = chart.ChartData.Series;

var label = series[0].Labels[0];
label.DataLabelFormat.ShowValue = true;
label.DataLabelFormat.Position = LegendDataLabelPosition.OutsideEnd;
label.X = 0.71f;
label.Y = 0.04f;

presentation.Save("presentation.pptx", SaveFormat.Pptx);
Adicionar várias linhas de rótulos de dados acima de um gráfico de colunas
Este exemplo cria um gráfico de colunas com duas linhas de rótulos de dados acima da área de plotagem. A Série A exibe as colunas visíveis, enquanto as Séries B e C fornecem os rótulos adicionais. Suas colunas são ocultadas removendo o preenchimento e o contorno. A propriedade Overlap alinha as três séries nos mesmos centros de categoria.
As configurações do PlotArea reservam espaço para as linhas de rótulo. Após ValidateChartLayout calcular as posições padrão, X e Y preservam o alinhamento horizontal e aplicam deslocamentos verticais para organizar os rótulos em duas linhas. Os números permanecem rótulos de dados vinculados aos valores das séries; apenas os títulos das linhas são formas de texto separadas.
using Aspose.Slides;
using Aspose.Slides.Charts;
using Aspose.Slides.Export;

using var presentation = new Presentation();
var slide = presentation.Slides[0];

var chart = slide.Shapes.AddChart(ChartType.ClusteredColumn, 40, 40, 640, 200);
chart.HasTitle = false;
chart.HasLegend = false;
chart.TextFormat.PortionFormat.FontHeight = 12;

chart.ChartData.Series.Clear();
chart.ChartData.Categories.Clear();

var workbook = chart.ChartData.ChartDataWorkbook;
workbook.Clear(0);

string[] categories = { "North", "South", "East", "West" };
string[] seriesNames = { "Series A", "Series B", "Series C" };
double[,] seriesValues = {
    { 35, 42, 28, 47 },
    { 22, 31, 19, 26 },
    { 12, 16, 14, 18 }
};

for (int categoryIndex = 0; categoryIndex < categories.Length; categoryIndex++)
{
    var categoryCell = workbook.GetCell(0, categoryIndex + 1, 0, categories[categoryIndex]);
    chart.ChartData.Categories.Add(categoryCell);
}

for (int seriesIndex = 0; seriesIndex < seriesNames.Length; seriesIndex++)
{
    var seriesCell = workbook.GetCell(0, 0, seriesIndex + 1, seriesNames[seriesIndex]);
    var series = chart.ChartData.Series.Add(seriesCell, ChartType.ClusteredColumn);

    for (int categoryIndex = 0; categoryIndex < categories.Length; categoryIndex++)
    {
        var valueCell = workbook.GetCell(0, categoryIndex + 1, seriesIndex + 1, seriesValues[seriesIndex, categoryIndex]);
        series.DataPoints.AddDataPointForBarSeries(valueCell);
    }

    if (seriesIndex > 0)
    {
        // Ocultar as colunas de B e C, mas manter seus rótulos de dados.
        series.Format.Fill.FillType = FillType.NoFill;
        series.Format.Line.FillFormat.FillType = FillType.NoFill;
        var labelFormat = series.Labels.DefaultDataLabelFormat;
        labelFormat.ShowValue = true;
        labelFormat.TextFormat.PortionFormat.FontHeight = 12;
        var labelFill = labelFormat.TextFormat.PortionFormat.FillFormat;
        labelFill.FillType = FillType.Solid;
        labelFill.SolidFillColor.Color = Color.Black;
        labelFormat.Position = LegendDataLabelPosition.InsideBase;
    }
}

// Alinhar as três séries com os mesmos centros de categoria.
chart.ChartData.Series[0].ParentSeriesGroup.Overlap = 100;

// Usar menos linhas de grade neste exemplo compacto.
chart.Axes.VerticalAxis.IsAutomaticMajorUnit = false;
chart.Axes.VerticalAxis.MajorUnit = 10;

// Reservar espaço acima da área de plotagem para duas linhas de rótulos de dados.
chart.PlotArea.LayoutTargetType = LayoutTargetType.Inner;
chart.PlotArea.X = 0.15f;
chart.PlotArea.Y = 0.32f;
chart.PlotArea.Width = 0.80f;
chart.PlotArea.Height = 0.48f;
chart.ValidateChartLayout();

for (int seriesIndex = 1; seriesIndex < seriesNames.Length; seriesIndex++)
{
    var series = chart.ChartData.Series[seriesIndex];
    float rowTop = seriesIndex == 1 ? 0.15f : 0.03f;

    for (int categoryIndex = 0; categoryIndex < categories.Length; categoryIndex++)
    {
        var dataLabel = series.DataPoints[categoryIndex].Label;
        // Manter a posição horizontal padrão. Y é um deslocamento a partir de
        // a posição padrão do rótulo, expressa como fração da altura do gráfico.
        dataLabel.X = 0;
        dataLabel.Y = rowTop - dataLabel.ActualY / chart.Height;
    }

    // Apenas o título da linha é uma forma de texto separada.
    var rowHeading = slide.Shapes.AddAutoShape(ShapeType.Rectangle, chart.X, chart.Y + rowTop * chart.Height, 85, 18);
    rowHeading.FillFormat.FillType = FillType.NoFill;
    rowHeading.LineFormat.FillFormat.FillType = FillType.NoFill;
    rowHeading.AddTextFrame(seriesNames[seriesIndex]);
    rowHeading.TextFrame.TextFrameFormat.MarginTop = 0;
    rowHeading.TextFrame.TextFrameFormat.MarginBottom = 0;
    var headingFormat = rowHeading.TextFrame.Paragraphs[0].Portions[0].PortionFormat;
    headingFormat.FontHeight = 12;
    headingFormat.FillFormat.FillType = FillType.Solid;
    headingFormat.FillFormat.SolidFillColor.Color = Color.Black;
}

presentation.Save("multiple-rows-of-labels.pptx", SaveFormat.Pptx);

FAQ
Como posso evitar que os rótulos de dados se sobreponham em gráficos densos?
Combine posicionamento automático de rótulos, linhas de orientação e redução do tamanho da fonte; se necessário, oculte alguns campos (por exemplo, a categoria) ou exiba rótulos apenas para valores extremos ou pontos chave.
Como posso desabilitar rótulos apenas para valores zero, negativos ou vazios?
Filtre os pontos de dados antes de habilitar os rótulos e desative a exibição para valores 0, valores negativos ou valores ausentes conforme uma regra definida.
Como garantir um estilo de rótulo consistente ao exportar para PDF/imagens?
Defina explicitamente a família e o tamanho da fonte e verifique se a fonte está disponível no ambiente de renderização para evitar substituição.