
จัดการป้ายข้อมูลแผนภูมิในงานนำเสนอด้วย .NET
บทนำ
ป้ายกำกับข้อมูลจะแสดงข้อมูลเกี่ยวกับชุดข้อมูลของแผนภูมิและจุดข้อมูลแต่ละจุด ช่วยให้ผู้อ่านระบุค่าและเข้าใจแผนภูมิได้ บทความนี้อธิบายวิธีกำหนดรูปแบบค่า, แสดงเปอร์เซ็นต์, อ่านข้อความป้ายกำกับ, ควบคุมป้ายกำกับที่เกินค่าสูงสุดของแกน, ปรับระยะห่างของป้ายแกนประเภท, และกำหนดตำแหน่งป้ายกำกับของแผนภูมิวงกลม
กำหนดความแม่นยำของข้อมูลในป้ายกำกับแผนภูมิ
ใช้ NumberFormatOfValues เพื่อกำหนดรูปแบบค่าของชุดข้อมูล ตัวอย่างนี้สร้างแผนภูมิเส้นด้วยข้อมูลเริ่มต้น แสดงตารางข้อมูล และเปิดใช้ป้ายกำกับค่าให้กับชุดแรก รูปแบบ #,##0.00 จะแสดงเครื่องหมายคั่นหมื่นและสองตำแหน่งทศนิยมโดยไม่เปลี่ยนค่าเดิม
using Aspose.Slides;
using Aspose.Slides.Charts;
using Aspose.Slides.Export;

using var presentation = new Presentation();
var slide = presentation.Slides[0];

var chart = slide.Shapes.AddChart(ChartType.Line, 50, 50, 450, 300);
chart.HasDataTable = true;

var series = chart.ChartData.Series[0];
series.NumberFormatOfValues = "#,##0.00";
series.Labels.DefaultDataLabelFormat.ShowValue = true;

presentation.Save("PrecisionOfDatalabels_out.pptx", SaveFormat.Pptx);
แสดงเปอร์เซ็นต์เป็นป้ายกำกับ
สำหรับแผนภูมิคอลัมน์ซ้อนกัน ให้คำนวณแต่ละค่าที่เป็นเปอร์เซ็นต์ของผลรวมประเภทและกำหนดข้อความให้กับ TextFrameForOverriding ตัวอย่างนี้ใช้ข้อมูลแผนภูมิมาตรฐานและแสดงเปอร์เซ็นต์สองตำแหน่งทศนิยมด้วยฟอนต์ขนาด 8pt ประเภทที่มีผลรวมเป็นศูนย์จะถูกข้ามเพื่อหลีกเลี่ยงการหารด้วยศูนย์ คำนวณข้อความป้ายกำกับแบบกำหนดเองใหม่หากข้อมูลแผนภูมิมีการเปลี่ยนแปลง
using System;
using Aspose.Slides;
using Aspose.Slides.Charts;
using Aspose.Slides.Export;

using var presentation = new Presentation();
var slide = presentation.Slides[0];

var chart = slide.Shapes.AddChart(ChartType.StackedColumn, 20, 20, 400, 400);

var categoryTotals = new double[chart.ChartData.Categories.Count];
for (int k = 0; k < chart.ChartData.Categories.Count; k++)
{
    for (int i = 0; i < chart.ChartData.Series.Count; i++)
    {
        var series = chart.ChartData.Series[i];
        var pointValue = Convert.ToDouble(series.DataPoints[k].Value.Data);
        categoryTotals[k] += pointValue;
    }
}

for (int x = 0; x < chart.ChartData.Series.Count; x++)
{
    var series = chart.ChartData.Series[x];
    series.Labels.DefaultDataLabelFormat.ShowLegendKey = false;

    for (int j = 0; j < series.DataPoints.Count; j++)
    {
        var label = series.DataPoints[j].Label;
        if (categoryTotals[j] == 0)
        {
            continue;
        }

        var pointValue = Convert.ToDouble(series.DataPoints[j].Value.Data);
        var dataPointPercent = (pointValue / categoryTotals[j]) * 100;

        var portion = new Portion();
        portion.Text = string.Format("{0:F2} %", dataPointPercent);
        portion.PortionFormat.FontHeight = 8f;

        label.TextFrameForOverriding.Text = "";

        var paragraph = label.TextFrameForOverriding.Paragraphs[0];
        paragraph.Portions.Add(portion);

        label.DataLabelFormat.ShowValue = true;
        label.DataLabelFormat.ShowSeriesName = false;
        label.DataLabelFormat.ShowPercentage = false;
        label.DataLabelFormat.ShowLegendKey = false;
        label.DataLabelFormat.ShowCategoryName = false;
        label.DataLabelFormat.ShowBubbleSize = false;
    }
}

presentation.Save("DisplayPercentageAsLabels_out.pptx", SaveFormat.Pptx);
กำหนดเครื่องหมายเปอร์เซ็นต์ในป้ายกำกับแผนภูมิ
เมื่อค่าถูกจัดเก็บเป็นเศษส่วน ให้ใช้ NumberFormat เพื่อแสดงเปอร์เซ็นต์ ตั้งค่า IsNumberFormatLinkedToSource เป็น false เพื่อให้รูปแบบป้ายทำงานแยกจากเซลล์ต้นทาง
ตัวอย่างนี้สร้างแผนภูมิคอลัมน์ซ้อน 100% ด้วยชุดสีแดงและสีน้ำเงินในสี่ประเภท แต่ละคู่ค่าจะรวมเป็น 1 รูปแบบป้าย 0.0% จะแสดง 0.30 เป็น 30.0% ในขณะที่แกนอัตราแนวตั้งใช้สองตำแหน่งทศนิยม ทั้งสองชุดใช้ข้อความป้ายสีขาวขนาด 10pt
using System.Drawing;
using Aspose.Slides;
using Aspose.Slides.Charts;
using Aspose.Slides.Export;

using var presentation = new Presentation();
var slide = presentation.Slides[0];

var chart = slide.Shapes.AddChart(ChartType.PercentsStackedColumn, 20, 20, 500, 400);

chart.Axes.VerticalAxis.IsNumberFormatLinkedToSource = false;
chart.Axes.VerticalAxis.NumberFormat = "0.00%";

chart.ChartData.Series.Clear();
chart.ChartData.Categories.Clear();

var workbook = chart.ChartData.ChartDataWorkbook;
int worksheetIndex = 0;
for (int i = 0; i < 4; i++)
{
    var categoryCell = workbook.GetCell(worksheetIndex, i + 1, 0, $"Category {i + 1}");
    chart.ChartData.Categories.Add(categoryCell);
}

string[] seriesNames = { "Reds", "Blues" };
Color[] seriesColors = { Color.Red, Color.Blue };
double[,] values = { { 0.30, 0.50, 0.80, 0.65 }, { 0.70, 0.50, 0.20, 0.35 } };

for (int i = 0; i < seriesNames.Length; i++)
{
    var seriesCell = workbook.GetCell(worksheetIndex, 0, i + 1, seriesNames[i]);
    var series = chart.ChartData.Series.Add(seriesCell, chart.Type);
    for (int j = 0; j < 4; j++)
    {
        var valueCell = workbook.GetCell(worksheetIndex, j + 1, i + 1, values[i, j]);
        series.DataPoints.AddDataPointForBarSeries(valueCell);
    }

    series.Format.Fill.FillType = FillType.Solid;
    series.Format.Fill.SolidFillColor.Color = seriesColors[i];

    var labelFormat = series.Labels.DefaultDataLabelFormat;
    labelFormat.ShowValue = true;
    labelFormat.IsNumberFormatLinkedToSource = false;
    labelFormat.NumberFormat = "0.0%";
    labelFormat.TextFormat.PortionFormat.FontHeight = 10;
    labelFormat.TextFormat.PortionFormat.FillFormat.FillType = FillType.Solid;
    labelFormat.TextFormat.PortionFormat.FillFormat.SolidFillColor.Color = Color.White;
}

presentation.Save("SetDataLabelsPercentageSign_out.pptx", SaveFormat.Pptx);
อ่านข้อความจริงของป้ายกำกับข้อมูล
ใช้ GetActualLabelText เพื่อดึงข้อความที่สร้างโดยการตั้งค่าของป้ายกำกับข้อมูล ซึ่งเป็นประโยชน์เมื่อดึงป้ายกำกับสำหรับรายงาน, ค้นหาข้อความในงานนำเสนอ, หรือทำการตรวจสอบแผนภูมิที่สร้างขึ้น ในตัวอย่างด้านล่าง รูปแบบ data label format เริ่มต้นจะรวมชื่อประเภท, ชื่อชุดข้อมูล, และค่า จุดหนึ่งจะจัดรูปแบบค่าเป็นเปอร์เซ็นต์ และอีกจุดหนึ่งจะใช้ข้อความกำหนดเองจาก TextFrameForOverriding
using System;
using Aspose.Slides;
using Aspose.Slides.Charts;

using var presentation = new Presentation();
var slide = presentation.Slides[0];

var chart = slide.Shapes.AddChart(ChartType.ClusteredColumn, 20, 20, 500, 300);

chart.ChartData.Series.Clear();
chart.ChartData.Categories.Clear();

var workbook = chart.ChartData.ChartDataWorkbook;
chart.ChartData.Categories.Add(workbook.GetCell(0, 1, 0, "Q1"));
chart.ChartData.Categories.Add(workbook.GetCell(0, 2, 0, "Q2"));

var north = chart.ChartData.Series.Add(workbook.GetCell(0, 0, 1, "North"), chart.Type);
north.DataPoints.AddDataPointForBarSeries(workbook.GetCell(0, 1, 1, 0.25));
north.DataPoints.AddDataPointForBarSeries(workbook.GetCell(0, 2, 1, 0.75));

var south = chart.ChartData.Series.Add(workbook.GetCell(0, 0, 2, "South"), chart.Type);
south.DataPoints.AddDataPointForBarSeries(workbook.GetCell(0, 1, 2, 0.40));
south.DataPoints.AddDataPointForBarSeries(workbook.GetCell(0, 2, 2, 0.60));

foreach (var series in chart.ChartData.Series)
{
    var format = series.Labels.DefaultDataLabelFormat;
    format.ShowCategoryName = true;
    format.ShowSeriesName = true;
    format.ShowValue = true;
}

north.Labels[1].DataLabelFormat.IsNumberFormatLinkedToSource = false;
north.Labels[1].DataLabelFormat.NumberFormat = "0%";
south.Labels[0].TextFrameForOverriding.Text = "Reviewed";

foreach (var series in chart.ChartData.Series)
{
    foreach (var point in series.DataPoints)
    {
        var label = point.Label;
        if (!label.IsVisible)
        {
            continue;
        }

        Console.WriteLine($"Value: {point.Value.Data}; label: {label.GetActualLabelText()}");
    }
}
ค่าที่เก็บไว้ในจุดข้อมูลยังคงเป็น 0.75 แม้ว่าป้ายจะแสดง 75% พร้อมกับชื่อประเภทและชุดข้อมูล ข้อความกำหนดเองจะแทนที่ข้อความป้ายที่สร้างโดยอัตโนมัติ GetActualLabelText จะคืนสตริงป้ายที่ได้ในทั้งสองกรณี ตรวจสอบ IsVisible แยกต่างหาก เช่นที่แสดงข้างต้น หากต้องการดึงเฉพาะป้ายที่มองเห็นได้
ควบคุมป้ายกำกับข้อมูลที่เกินค่าสูงสุดของแกน
เมื่อตั้งค่าช่วงแกนด้วยตนเอง บางจุดข้อมูลอาจเกินค่ามากที่สุด ใช้ ShowDataLabelsOverMaximum เพื่อกำหนดว่าป้ายกำกับของจุดเหล่านั้นจะแสดงหรือไม่ การตั้งค่านี้เปลี่ยนการมองเห็นของป้าย แต่ไม่เปลี่ยนช่วงแกนหรือค่าข้อมูลพื้นฐาน
ตัวอย่างด้านล่างสร้างแผนภูมิคอลัมน์กลุ่ม 2 มิติด้วยค่าที่ 60 และ 120 ตั้งค่า IsAutomaticMaxValue เป็น false และ MaxValue เป็น 100 บนแกนแนวตั้ง สไลด์แรกเปิดให้ป้ายแสดงเกินค่าสูงสุด; สไลด์สำเนาจะปิดการแสดงนั้น ทั้งสองสไลด์บันทึกเป็น DataLabelsOverMaximum.pptx
เปิดใช้ป้ายค่าด้วย ShowValue การตั้งค่าระดับแผนภูมิไม่ทำให้ค่าจะแสดงโดยอัตโนมัติหรือเขียนทับการปิดการแสดงค่าของป้ายแต่ละอัน ตัวอย่างนี้เปิดใช้งานค่าทั้งชุดและใช้ Position เพื่อวางป้ายที่ปลายภายนอกของแต่ละคอลัมน์
using Aspose.Slides;
using Aspose.Slides.Charts;
using Aspose.Slides.Export;

using var presentation = new Presentation();
var slide = presentation.Slides[0];

var chart = slide.Shapes.AddChart(ChartType.ClusteredColumn, 50, 50, 600, 400);
chart.HasLegend = false;

chart.ChartData.Series.Clear();
chart.ChartData.Categories.Clear();

var workbook = chart.ChartData.ChartDataWorkbook;

var firstCategory = workbook.GetCell(0, 1, 0, "Within range");
var secondCategory = workbook.GetCell(0, 2, 0, "Above maximum");

chart.ChartData.Categories.Add(firstCategory);
chart.ChartData.Categories.Add(secondCategory);

var seriesName = workbook.GetCell(0, 0, 1, "Values");
var series = chart.ChartData.Series.Add(seriesName, chart.Type);

var firstValue = workbook.GetCell(0, 1, 1, 60);
var secondValue = workbook.GetCell(0, 2, 1, 120);

series.DataPoints.AddDataPointForBarSeries(firstValue);
series.DataPoints.AddDataPointForBarSeries(secondValue);

series.Labels.DefaultDataLabelFormat.ShowValue = true;
series.Labels.DefaultDataLabelFormat.Position = LegendDataLabelPosition.OutsideEnd;

chart.Axes.VerticalAxis.IsAutomaticMaxValue = false;
chart.Axes.VerticalAxis.MaxValue = 100;
chart.ShowDataLabelsOverMaximum = true;

var secondSlide = presentation.Slides.AddClone(slide);
var secondChart = (IChart)secondSlide.Shapes[0];
secondChart.ShowDataLabelsOverMaximum = false;

presentation.Save("DataLabelsOverMaximum.pptx", SaveFormat.Pptx);
ภาพต่อไปแสดงสไลด์ที่บันทึกโดย Microsoft PowerPoint เมื่อค่า true ป้าย 120 จะมองเห็นได้ที่ขอบบน; เมื่อค่า false ป้ายจะถูกซ่อน ป้าย 60 ยังคงมองเห็นได้ ค่าสูงสุดของแกนคงที่ที่ 100 และจุดข้อมูลที่สองยังคงเป็น 120 ในทั้งสองกรณี
| ShowDataLabelsOverMaximum = true | ShowDataLabelsOverMaximum = false |
|---|---|
 |
 |
Chart Type
ตัวอย่างนี้ใช้แผนภูมิคอลัมน์ 2 มิติที่มีแกนค่า แผนภูมิที่ไม่มีแกนค่า เช่น แผนภูมิวงกลมและโดนัท จะไม่มีค่าสูงสุดของแกนให้จำกัดในลักษณะนี้กำหนดระยะห่างของป้ายจากแกน
ใช้ LabelOffset เพื่อควบคุมระยะห่างระหว่างป้ายแกนประเภทและแกน ค่าเป็นเปอร์เซ็นต์ของขนาดฟอนต์สูงสุดของป้ายแกน ตัวอย่างนี้สร้างแผนภูมิคอลัมน์กลุ่มและตั้งค่าออฟเซ็ตป้ายแกนแนวนอนเป็น 500 การตั้งค่านี้ส่งผลต่อป้ายแกนประเภท ไม่ใช่ป้ายที่แนบกับจุดข้อมูลแต่ละจุด
using Aspose.Slides;
using Aspose.Slides.Charts;
using Aspose.Slides.Export;

using var presentation = new Presentation();
var slide = presentation.Slides[0];

var chart = slide.Shapes.AddChart(ChartType.ClusteredColumn, 20, 20, 500, 300);
chart.Axes.HorizontalAxis.LabelOffset = 500;

presentation.Save("SetCategoryAxisLabelDistance_out.pptx", SaveFormat.Pptx);
ปรับตำแหน่งป้าย
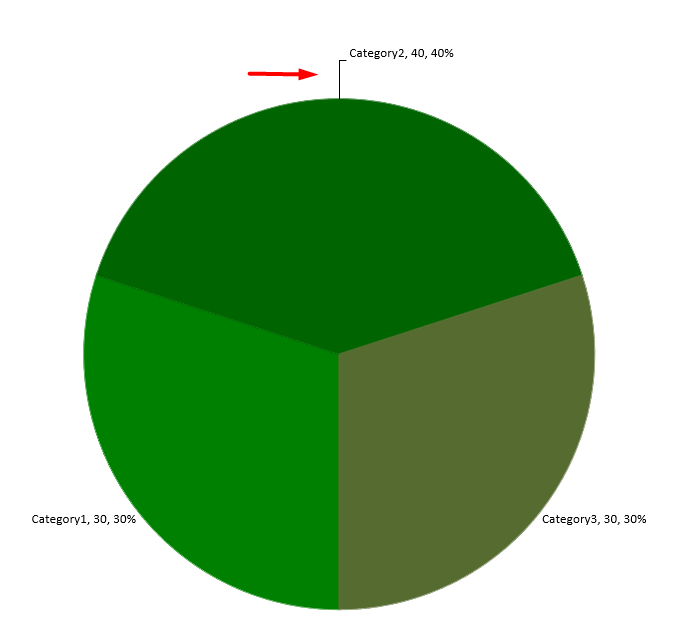
บนแผนภูมิวงกลม ปรับตำแหน่งป้ายข้อมูลเพื่อเพิ่มช่องว่างและทำให้มีพื้นที่สำหรับเส้นเชื่อม
ตัวอย่างนี้แสดงค่าของจุดข้อมูลแรก วางป้ายอยู่นอกชั้นและปรับออฟเซ็ต X และ Y ของมัน ออฟเซ็ตเหล่านี้สัมพันธ์กับความกว้างและความสูงของแผนภูมิตามลำดับ
using Aspose.Slides;
using Aspose.Slides.Charts;
using Aspose.Slides.Export;

using var presentation = new Presentation();
var slide = presentation.Slides[0];

var chart = slide.Shapes.AddChart(ChartType.Pie, 50, 50, 200, 200);
var series = chart.ChartData.Series;

var label = series[0].Labels[0];
label.DataLabelFormat.ShowValue = true;
label.DataLabelFormat.Position = LegendDataLabelPosition.OutsideEnd;
label.X = 0.71f;
label.Y = 0.04f;

presentation.Save("presentation.pptx", SaveFormat.Pptx);
FAQ
ฉันจะป้องกันไม่ให้ป้ายกำกับข้อมูลทับซ้อนบนแผนภูมิที่แน่นหนาได้อย่างไร?
ใช้การวางป้ายอัตโนมัติ, เส้นเชื่อม, และลดขนาดฟอนต์; หากจำเป็นให้ซ่อนบางฟิลด์ (เช่น ประเภท) หรือแสดงป้ายเฉพาะค่ากลางสุดหรือจุดสำคัญ
ฉันจะปิดป้ายสำหรับค่าศูนย์, ค่าเป็นลบ, หรือค่าที่ว่างเปล่าได้อย่างไร?
กรองจุดข้อมูลก่อนเปิดใช้ป้าย และปิดการแสดงค่าที่เป็น 0, ค่าเป็นลบ, หรือค่าที่หายไปตามกฎที่กำหนด
ฉันจะทำให้สไตล์ของป้ายสม่ำเสมอเมื่อส่งออกเป็น PDF/รูปภาพได้อย่างไร?
กำหนดฟอนต์และขนาดอย่างชัดเจนและตรวจสอบว่าฟอนต์นั้นพร้อมใช้งานในสภาพแวดล้อมการเรนเดอร์เพื่อหลีกเลี่ยงการใช้ฟอนต์สำรอง