Add Curve Object to PDF file
Add Curve object
A graph Curve is a connected union of projective lines, each line meeting three others in ordinary double points.
In this article, we will investigate simply graph curves, and filled curves, that you can create in your PDF document.
This example illustrates how to draw a Bézier curve programmatically within a PDF document using Aspose.PDF for Python via .NET. By leveraging the drawing module, developers can create complex graphical elements with precise control over their appearance and positioning. This capability is essential for applications that require dynamic generation of graphical content within PDFs, such as technical diagrams, charts, or custom illustrations.
Follow the steps below:
- Create Document instance.
- Create Drawing object with certain dimensions.
- Set border for Drawing object.
- Add Graph object to paragraphs collection of page.
- Save our PDF file.
    import aspose.pdf as ap
    import aspose.pdf.drawing as drawing
    import datetime

    # Create PDF document
    document = ap.Document()

    # Add page
    page = document.pages.add()

    # Create Drawing object with certain dimensions
    graph = drawing.Graph(400, 200)

    # Set border for Drawing object
    border_info = ap.BorderInfo(ap.BorderSide.ALL, ap.Color.green)
    graph.border = border_info

    # Create a curve and set its properties
    curve1 = drawing.Curve([10, 10, 50, 60, 70, 10, 100, 120])
    curve1.graph_info = drawing.GraphInfo()
    curve1.graph_info.color = ap.Color.green_yellow

    # Add the curve to the graph shapes
    graph.shapes.add(curve1)

    # Add Graph object to paragraphs collection of page
    page.paragraphs.add(graph)

    # Save PDF document
    document.save(path_outfile)
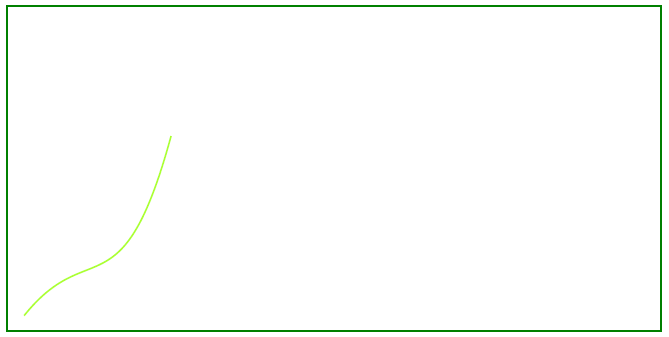
The following picture shows the result executed with our code snippet:

Create Filled Curve Object
This example shows how to add a Curve object that is filled with color.
    import aspose.pdf as ap
    import aspose.pdf.drawing as drawing
    import datetime

    # Create PDF document
    document = ap.Document()

    # Add page
    page = document.pages.add()

    # Create Drawing object with certain dimensions
    graph = drawing.Graph(400, 200)

    # Set border for Drawing object
    border_info = ap.BorderInfo(ap.BorderSide.ALL, ap.Color.green)
    graph.border = border_info

    # Create a curve and set fill color
    curve1 = drawing.Curve([10, 10, 50, 60, 70, 10, 100, 120])
    curve1.graph_info = drawing.GraphInfo()
    curve1.graph_info.fill_color = ap.Color.green_yellow

    # Add the curve to the graph shapes
    graph.shapes.add(curve1)

    # Add Graph object to paragraphs collection of page
    page.paragraphs.add(graph)

    # Save PDF document
    document.save(path_outfile)
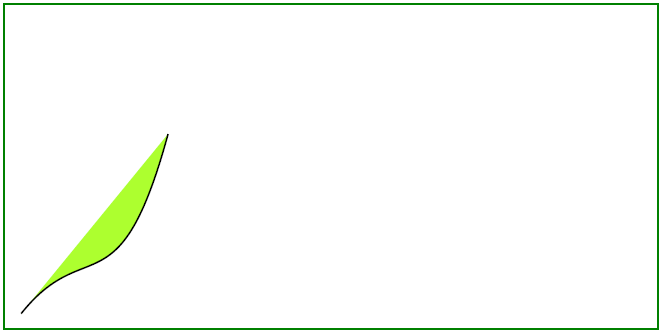
Look at the result of adding a filled Curve:
