Work with PDF Graphs in Python
Contents
[
Hide
]
What is Graph
Aspose.PDF for Python via .NET provides the Graph class for drawing vector graphics in PDF documents.
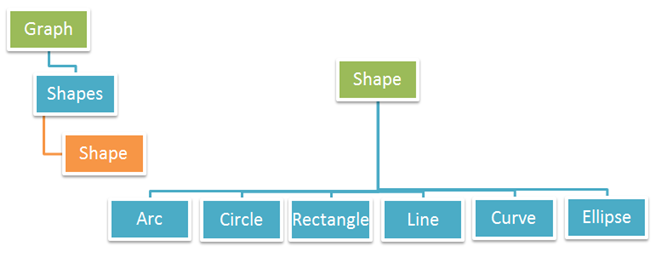
Graph is a paragraph-level element, so you add it to a page through the page paragraphs collection. Each graph contains a Shapes collection where you can add drawing objects such as lines, arcs, circles, curves, rectangles, and ellipses.
Use this section when you need to draw vector graphics directly into PDF pages in Python, whether for charts, diagrams, illustrations, or custom page annotations.
Graph Shapes Covered
The following types of shapes are supported by the Graph class:
- Arc - draw arc segments for partial circles and curved diagram elements.
- Circle - create circle outlines or filled circles for markers and visual highlights.
- Curve - add Bezier-style curves for custom paths and smooth graphical elements.
- Line - draw straight lines, including styled and dashed lines.
- Rectangle - create outlined, filled, gradient, or transparent rectangle shapes.
- Ellipse - draw oval shapes and add text inside them when needed.
You can also validate shape placement with bounds checking:
The examples in this section are illustrated in the figure below: