
PythonでPowerPointの図形をフォーマットする
概要
PowerPoint では、スライドに図形を追加できます。図形は線で構成されているため、輪郭を変更したりエフェクトを適用したりして書式設定できます。また、図形の内部をどのように塗りつぶすかを指定する設定でも書式設定できます。
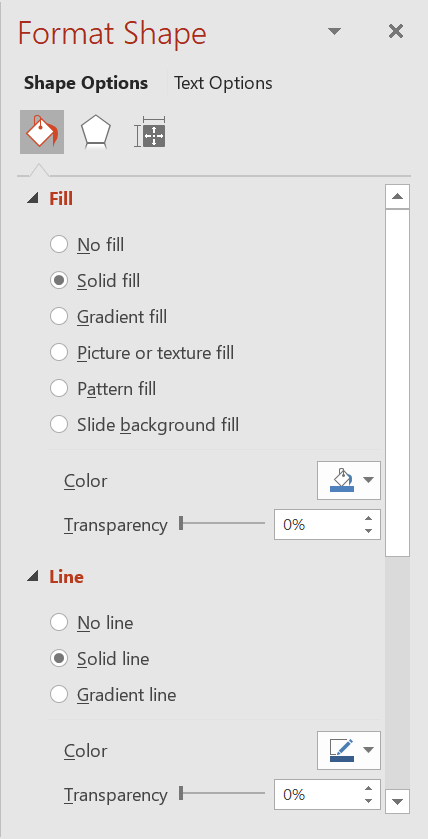
Aspose.Slides for Python は、PowerPoint で利用できる同じオプションを使用して図形をフォーマットするためのクラスとプロパティを提供します。
線の書式設定
Aspose.Slides を使用すると、図形にカスタムの線スタイルを指定できます。手順は次のとおりです。
- Presentation クラスのインスタンスを作成します。
- インデックスでスライドへの参照を取得します。
- スライドに AutoShape を追加します。
- 図形の line style を設定します。
- 線幅を設定します。
- 図形の dash style を設定します。
- 図形の線の色を設定します。
- 変更したプレゼンテーションを PPTX ファイルとして保存します。
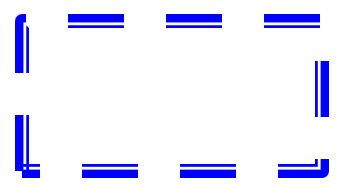
次の Python コードは、矩形の AutoShape の書式設定方法を示しています。
import aspose.slides as slides
import aspose.pydrawing as draw

# プレゼンテーション ファイルを表す Presentation クラスのインスタンスを作成します。
with slides.Presentation() as presentation:

    # 最初のスライドを取得します。
    slide = presentation.slides[0]

    # Rectangle タイプのオートシェイプを追加します。
    shape = slide.shapes.add_auto_shape(slides.ShapeType.RECTANGLE, 50, 150, 150, 75)

    # 矩形シェイプの塗りつぶしを削除し、線のみが表示されるようにします。
    shape.fill_format.fill_type = slides.FillType.NO_FILL

    # 矩形の線に書式設定を適用します。
    shape.line_format.style = slides.LineStyle.THICK_THIN
    shape.line_format.width = 7
    shape.line_format.dash_style = slides.LineDashStyle.DASH

    # 矩形の線の色を設定します。
    shape.line_format.fill_format.fill_type = slides.FillType.SOLID
    shape.line_format.fill_format.solid_fill_color.color = draw.Color.blue

    # PPTX ファイルをディスクに保存します。
    presentation.save("formatted_lines.pptx", slides.export.SaveFormat.PPTX)
結果:
図形の線にスケッチ効果を適用する
スケッチ効果は、図形の線を手描きのように見せます。[Shape.line_format](https://reference.aspose.com/slides/ja/python-net/aspose.slides/shape/line_format/) で線設定にアクセスし、[LineFormat.sketch_format](https://reference.aspose.com/slides/ja/python-net/aspose.slides/lineformat/sketch_format/) でスケッチ設定にアクセスし、[SketchFormat.sketch_type](https://reference.aspose.com/slides/ja/python-net/aspose.slides/sketchformat/sketch_type/) で [LineSketchType](https://reference.aspose.com/slides/ja/python-net/aspose.slides/linesketchtype/) 列挙体から値を選択します。
次の Python コードは、[LineSketchType.CURVED](https://reference.aspose.com/slides/ja/python-net/aspose.slides/linesketchtype/) 効果を適用し、明示的に割り当てられた値を取得し、[LineSketchType.NONE](https://reference.aspose.com/slides/ja/python-net/aspose.slides/linesketchtype/) で効果を削除する方法を示しています。
import aspose.slides as slides

with slides.Presentation() as presentation:
    slide = presentation.slides[0]
    shape = slide.shapes.add_auto_shape(slides.ShapeType.RECTANGLE, 50, 50, 200, 100)

    # 形状のライン書式とそのスケッチ書式にアクセスします。
    sketch_format = shape.line_format.sketch_format

    # スケッチ効果を適用します。
    sketch_format.sketch_type = slides.LineSketchType.CURVED

    # 形状に直接割り当てられたスケッチ効果を読み取ります。
    explicit_sketch_type = sketch_format.sketch_type
    print(f"Explicit sketch type: {explicit_sketch_type}")

    # スケッチ効果を削除します。
    sketch_format.sketch_type = slides.LineSketchType.NONE
SketchFormat.sketch_type が返す値は、図形に直接割り当てられた設定を表します。線の書式設定がテーマ、マスタースライド、レイアウトスライドから継承される可能性がある場合は、[LineFormat.get_effective](https://reference.aspose.com/slides/ja/python-net/aspose.slides/lineformat/get_effective/) を使用し、返されたオブジェクトの sketch_format プロパティにアクセスして sketch_type プロパティを読み取ります。Effective 値は継承が解決された後に実際に適用される書式設定を示します。
import aspose.slides as slides

with slides.Presentation("presentation.pptx") as presentation:
    shape = presentation.slides[0].shapes[0]
    line_format = shape.line_format

    explicit_sketch_type = line_format.sketch_format.sketch_type
    effective_line_format = line_format.get_effective()
    effective_sketch_type = effective_line_format.sketch_format.sketch_type

    print(f"Explicit sketch type: {explicit_sketch_type}")
    print(f"Effective sketch type: {effective_sketch_type}")
結合スタイルの書式設定
結合タイプのオプションは次の 3 つです。
- Round
- Miter
- Bevel
デフォルトでは、PowerPoint は角度のある 2 本の線(図形のコーナーなど)を結合するときに Round 設定を使用します。ただし、鋭角の図形を描く場合は Miter オプションを好むことがあります。
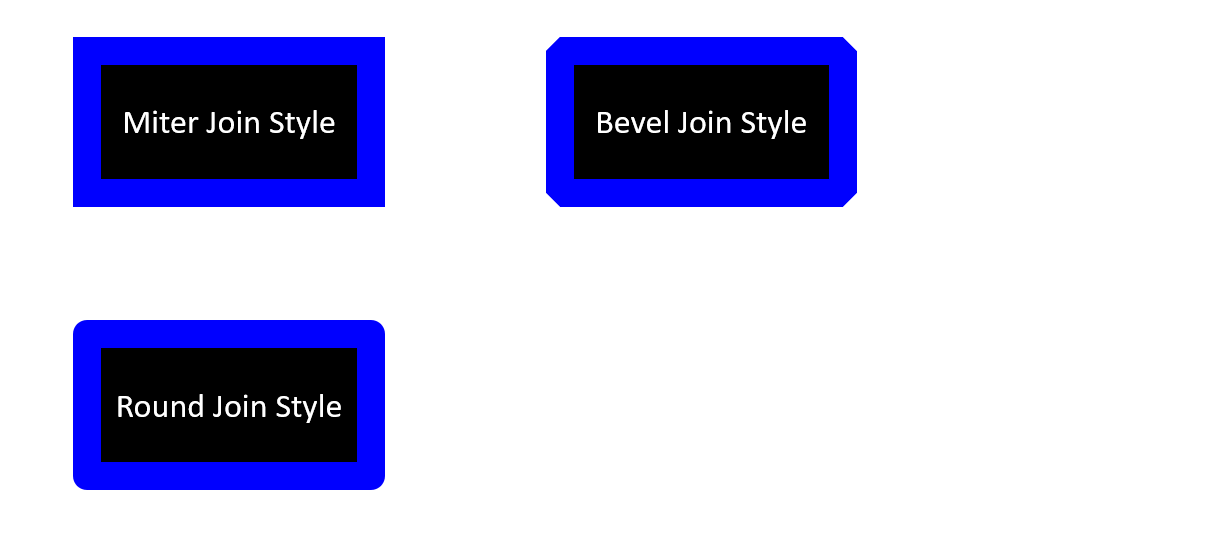
次の Python コードは、上図のように Miter、Bevel、Round の結合タイプ設定を使用して 3 つの矩形を作成した例です。
import aspose.slides as slides
import aspose.pydrawing as draw

# プレゼンテーション ファイルを表す Presentation クラスのインスタンスを作成します。
with slides.Presentation() as presentation:

	# 最初のスライドを取得します。
	slide = presentation.slides[0]

	# Rectangle タイプのオートシェイプを 3 つ追加します。
	shape1 = slide.shapes.add_auto_shape(slides.ShapeType.RECTANGLE, 20, 20, 150, 75)
	shape2 = slide.shapes.add_auto_shape(slides.ShapeType.RECTANGLE, 210, 20, 150, 75)
	shape3 = slide.shapes.add_auto_shape(slides.ShapeType.RECTANGLE, 20, 135, 150, 75)

	# 各矩形シェイプの塗りつぶし色を設定します。
	shape1.fill_format.fill_type = slides.FillType.SOLID
	shape1.fill_format.solid_fill_color.color = draw.Color.black
	shape2.fill_format.fill_type = slides.FillType.SOLID
	shape2.fill_format.solid_fill_color.color = draw.Color.black
	shape3.fill_format.fill_type = slides.FillType.SOLID
	shape3.fill_format.solid_fill_color.color = draw.Color.black

	# 線幅を設定します。
	shape1.line_format.width = 15
	shape2.line_format.width = 15
	shape3.line_format.width = 15

	# 各矩形の線の色を設定します。
	shape1.line_format.fill_format.fill_type = slides.FillType.SOLID
	shape1.line_format.fill_format.solid_fill_color.color = draw.Color.blue
	shape2.line_format.fill_format.fill_type = slides.FillType.SOLID
	shape2.line_format.fill_format.solid_fill_color.color = draw.Color.blue
	shape3.line_format.fill_format.fill_type = slides.FillType.SOLID
	shape3.line_format.fill_format.solid_fill_color.color = draw.Color.blue

	# 結合スタイルを設定します。
	shape1.line_format.join_style = slides.LineJoinStyle.MITER
	shape2.line_format.join_style = slides.LineJoinStyle.BEVEL
	shape3.line_format.join_style = slides.LineJoinStyle.ROUND

	# 各矩形にテキストを追加します。
	shape1.text_frame.text = "Miter Join style"
	shape2.text_frame.text = "Bevel Join style"
	shape3.text_frame.text = "Round Join style"

	# PPTX ファイルをディスクに保存します。
	presentation.save("join_styles.pptx", slides.export.SaveFormat.PPTX)
グラデーション 塗りつぶし
PowerPoint のグラデーション塗りつぶしは、図形に連続的なカラーのブレンドを適用できる書式設定オプションです。たとえば、2 色以上を徐々にフェードさせる形で適用できます。
Aspose.Slides を使用して図形にグラデーション塗りつぶしを適用する手順は次のとおりです。
- Presentation クラスのインスタンスを作成します。
- インデックスでスライドへの参照を取得します。
- スライドに AutoShape を追加します。
- 図形の FillType を
GRADIENTに設定します。 [GradientFormat](https://reference.aspose.com/slides/ja/python-net/aspose.slides/gradientformat/)クラスが公開するgradient_stopsコレクションのaddメソッドを使用して、位置を指定した 2 つ以上のカラーを追加します。- 変更したプレゼンテーションを PPTX ファイルとして保存します。
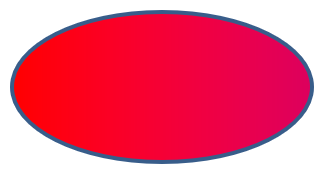
次の Python コードは、楕円にグラデーション塗りつぶし効果を適用する例です。
import aspose.slides as slides

# プレゼンテーション ファイルを表す Presentation クラスのインスタンスを作成します。
with slides.Presentation() as presentation:

    # 最初のスライドを取得します。
    slide = presentation.slides[0]

    # Ellipse タイプのオートシェイプを追加します。
    shape = slide.shapes.add_auto_shape(slides.ShapeType.ELLIPSE, 50, 50, 150, 75)

    # 楕円にグラデーション書式を適用します。
    shape.fill_format.fill_type = slides.FillType.GRADIENT
    shape.fill_format.gradient_format.gradient_shape = slides.GradientShape.LINEAR

    # グラデーションの方向を設定します。
    shape.fill_format.gradient_format.gradient_direction = slides.GradientDirection.FROM_CORNER2

    # 2 つのグラデーション ストップを追加します。
    shape.fill_format.gradient_format.gradient_stops.add(1.0, slides.PresetColor.PURPLE)
    shape.fill_format.gradient_format.gradient_stops.add(0, slides.PresetColor.RED)

    # PPTX ファイルをディスクに保存します。
    presentation.save("gradient_fill.pptx", slides.export.SaveFormat.PPTX)
結果:
パターン塗りつぶし
PowerPoint のパターン塗りつぶしは、2 色のデザイン(ドット、ストライプ、クロスハッチ、チェックなど)を図形に適用できる書式設定オプションです。パターンの前景色と背景色をカスタムで指定できます。
Aspose.Slides では、45 以上の事前定義パターンスタイルを提供しており、図形に適用してプレゼンテーションの視覚的魅力を高められます。事前定義パターンを選択した後でも、使用する正確な色を指定できます。
パターン塗りつぶしを図形に適用する手順は次のとおりです。
- Presentation クラスのインスタンスを作成します。
- インデックスでスライドへの参照を取得します。
- スライドに AutoShape を追加します。
- 図形の FillType を
PATTERNに設定します。 - 事前定義オプションからパターンスタイルを選択します。
- パターンの back_color を設定します。
- パターンの fore_color を設定します。
- 変更したプレゼンテーションを PPTX ファイルとして保存します。
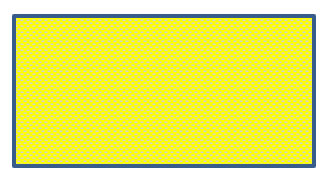
次の Python コードは、矩形にパターン塗りつぶしを適用する例です。
import aspose.slides as slides
import aspose.pydrawing as draw

# プレゼンテーション ファイルを表す Presentation クラスのインスタンスを作成します。
with slides.Presentation() as presentation:

    # 最初のスライドを取得します。
    slide = presentation.slides[0]

    # Rectangle タイプのオートシェイプを追加します。
    shape = slide.shapes.add_auto_shape(slides.ShapeType.RECTANGLE, 50, 50, 150, 75)

    # 塗りつぶしタイプを Pattern に設定します。
    shape.fill_format.fill_type = slides.FillType.PATTERN

    # パターンスタイルを設定します。
    shape.fill_format.pattern_format.pattern_style = slides.PatternStyle.TRELLIS

    # パターンの背景色と前景色を設定します。
    shape.fill_format.pattern_format.back_color.color = draw.Color.light_gray
    shape.fill_format.pattern_format.fore_color.color = draw.Color.yellow

    # PPTX ファイルをディスクに保存します。
    presentation.save("pattern_fill.pptx", slides.export.SaveFormat.PPTX)
結果:
画像塗りつぶし
PowerPoint の画像塗りつぶしは、図形の内部に画像を挿入し、画像を図形の背景として使用できる書式設定オプションです。
Aspose.Slides を使用して図形に画像塗りつぶしを適用する手順は次のとおりです。
- Presentation クラスのインスタンスを作成します。
- インデックスでスライドへの参照を取得します。
- スライドに AutoShape を追加します。
- 図形の FillType を
PICTUREに設定します。 - 画像塗りつぶしモードを
TILE(または他の好みのモード)に設定します。 - 使用したい画像から
[PPImage](https://reference.aspose.com/slides/ja/python-net/aspose.slides/ppimage/)オブジェクトを作成します。 - この画像を図形の
picture_fill_formatのpicture.imageプロパティに割り当てます。 - 変更したプレゼンテーションを PPTX ファイルとして保存します。
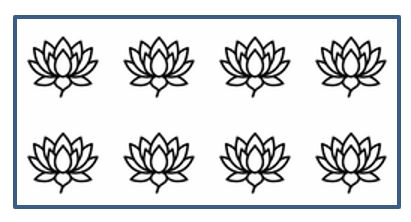
たとえば、次の画像があるとします(ファイル名 lotus.png)。

次の Python コードは、図形に画像塗りつぶしを適用する例です。
import aspose.slides as slides

# プレゼンテーション ファイルを表す Presentation クラスのインスタンスを作成します。
with slides.Presentation() as presentation:

    # 最初のスライドを取得します。
    slide = presentation.slides[0]

    # Rectangle タイプのオートシェイプを追加します。
    shape = slide.shapes.add_auto_shape(slides.ShapeType.RECTANGLE, 50, 50, 192, 95)

    # 塗りつぶしタイプを Picture に設定します。
    shape.fill_format.fill_type = slides.FillType.PICTURE

    # ピクチャーフィルモードを設定します。
    shape.fill_format.picture_fill_format.picture_fill_mode = slides.PictureFillMode.TILE

    # 画像を読み込み、プレゼンテーションのリソースに追加します。
    with slides.Images.from_file("lotus.png") as image:
        presentation_image = presentation.images.add_image(image)

    # ピクチャーを設定します。
    shape.fill_format.picture_fill_format.picture.image = presentation_image

    # PPTX ファイルをディスクに保存します。
    presentation.save("picture_fill.pptx", slides.export.SaveFormat.PPTX)
結果:
テクスチャとしてタイル画像を設定する
タイル画像をテクスチャとして使用し、タイルの配置をカスタマイズしたい場合は、PictureFillFormat クラスの次のプロパティを使用できます。
- picture_fill_mode:
TILEまたはSTRETCHを指定します。 - tile_alignment: 図形内でのタイルの配置を指定します。
- tile_flip: タイルを水平、垂直、または両方に反転させるかを制御します。
- tile_offset_x: 図形の原点からタイルの水平オフセット(ポイント)を設定します。
- tile_offset_y: 図形の原点からタイルの垂直オフセット(ポイント)を設定します。
- tile_scale_x: タイルの水平スケールをパーセンテージで定義します。
- tile_scale_y: タイルの垂直スケールをパーセンテージで定義します。
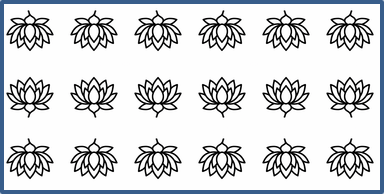
次のコードサンプルは、タイル画像塗りつぶし付きの矩形を追加し、タイルオプションを構成する方法を示しています。
import aspose.slides as slides

# プレゼンテーション ファイルを表す Presentation クラスのインスタンスを作成します。
with slides.Presentation() as presentation:

    # 最初のスライドを取得します。
    first_slide = presentation.slides[0]

    # 矩形のオートシェイプを追加します。
    shape = first_slide.shapes.add_auto_shape(slides.ShapeType.RECTANGLE, 50, 50, 190, 95)

    # 図形の塗りつぶしタイプを Picture に設定します。
    shape.fill_format.fill_type = slides.FillType.PICTURE

    # 画像を読み込み、プレゼンテーションのリソースに追加します。
    with slides.Images.from_file("lotus.png") as source_image:
        presentation_image = presentation.images.add_image(source_image)

    # 画像を図形に割り当てます。
    picture_fill_format = shape.fill_format.picture_fill_format
    picture_fill_format.picture.image = presentation_image

    # ピクチャーフィルモードとタイル設定を構成します。
    picture_fill_format.picture_fill_mode = slides.PictureFillMode.TILE
    picture_fill_format.tile_offset_x = -32
    picture_fill_format.tile_offset_y = -32
    picture_fill_format.tile_scale_x = 50
    picture_fill_format.tile_scale_y = 50
    picture_fill_format.tile_alignment = slides.RectangleAlignment.BOTTOM_RIGHT
    picture_fill_format.tile_flip = slides.TileFlip.FLIP_BOTH

    # PPTX ファイルをディスクに保存します。
    presentation.save("tile.pptx", slides.export.SaveFormat.PPTX)
結果:
単色塗りつぶし
PowerPoint の単色塗りつぶしは、図形を単一の均一な色で塗りつぶす書式設定オプションです。グラデーション、テクスチャ、パターンなどは使用せず、シンプルな背景色が適用されます。
Aspose.Slides で図形に単色塗りつぶしを適用する手順は次のとおりです。
- Presentation クラスのインスタンスを作成します。
- インデックスでスライドへの参照を取得します。
- スライドに AutoShape を追加します。
- 図形の FillType を
SOLIDに設定します。 - 好みの塗りつぶし色を図形に割り当てます。
- 変更したプレゼンテーションを PPTX ファイルとして保存します。
次の Python コードは、スライド上の矩形に単色塗りつぶしを適用する例です。
import aspose.slides as slides
import aspose.pydrawing as draw

# プレゼンテーション ファイルを表す Presentation クラスのインスタンスを作成します。
with slides.Presentation() as presentation:

    # 最初のスライドを取得します。
    slide = presentation.slides[0]

    # Rectangle タイプのオートシェイプを追加します。
    shape = slide.shapes.add_auto_shape(slides.ShapeType.RECTANGLE, 50, 50, 150, 75)

    # 塗りつぶしタイプを Solid に設定します。
    shape.fill_format.fill_type = slides.FillType.SOLID

    # 塗りつぶしの色を設定します。
    shape.fill_format.solid_fill_color.color = draw.Color.yellow

    # PPTX ファイルをディスクに保存します。
    presentation.save("solid_color_fill.pptx", slides.export.SaveFormat.PPTX)
結果:
透明度の設定
PowerPoint では、図形に単色、グラデーション、画像、またはテクスチャの塗りつぶしを適用する際に、透明度レベルを設定して塗りつぶしの不透明度を制御できます。透明度の数値が高いほど図形が透過し、背景や下にあるオブジェクトが部分的に見えるようになります。
Aspose.Slides では、塗りつぶしに使用するカラーのアルファ値を調整することで透明度を設定できます。手順は次のとおりです。
- Presentation クラスのインスタンスを作成します。
- インデックスでスライドへの参照を取得します。
- スライドに AutoShape を追加します。
- 塗りつぶしタイプを
SOLIDに設定します。 Color.from_argbを使用して、透明度を含むカラーを定義します(alpha成分が透明度を制御します)。- プレゼンテーションを保存します。
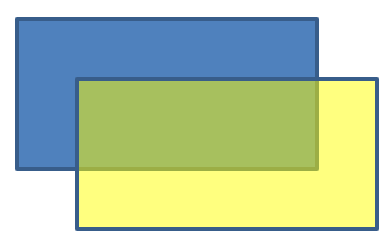
次の Python コードは、矩形に透明塗りつぶし色を適用する例です。
import aspose.pydrawing as draw
import aspose.slides as slides

# プレゼンテーション ファイルを表す Presentation クラスのインスタンスを作成します。
with slides.Presentation() as presentation:

    # 最初のスライドを取得します。
    slide = presentation.slides[0]

    # ソリッド矩形のオートシェイプを追加します。
    slide.shapes.add_auto_shape(slides.ShapeType.RECTANGLE, 50, 50, 150, 75)

    # ソリッドシェイプ上に透明矩形のオートシェイプを追加します。
    shape = slide.shapes.add_auto_shape(slides.ShapeType.RECTANGLE, 80, 80, 150, 75)
    shape.fill_format.fill_type = slides.FillType.SOLID
    shape.fill_format.solid_fill_color.color = draw.Color.from_argb(128, 204, 102, 0)

    presentation.save("shape_transparency.pptx", slides.export.SaveFormat.PPTX)
結果:
図形の回転
Aspose.Slides は、PowerPoint プレゼンテーション内の図形を回転させることができます。これは、特定の配置やデザイン要件に合わせてビジュアル要素を調整したい場合に便利です。
スライド上の図形を回転させる手順は次のとおりです。
- Presentation クラスのインスタンスを作成します。
- インデックスでスライドへの参照を取得します。
- スライドに AutoShape を追加します。
- 図形の
rotationプロパティに目的の角度を設定します。 - プレゼンテーションを保存します。
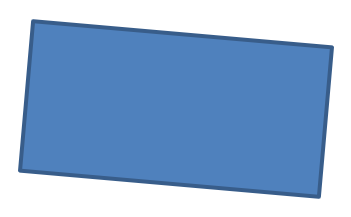
次の Python コードは、図形を 5 度回転させる例です。
import aspose.slides as slides

# プレゼンテーション ファイルを表す Presentation クラスのインスタンスを作成します。
with slides.Presentation() as presentation:

    # 最初のスライドを取得します。
    slide = presentation.slides[0]

    # Rectangle タイプのオートシェイプを追加します。
    shape = slide.shapes.add_auto_shape(slides.ShapeType.RECTANGLE, 50, 50, 150, 75)

    # 図形を 5 度回転させます。
    shape.rotation = 5

    # PPTX ファイルをディスクに保存します。
    presentation.save("shape_rotation.pptx", slides.export.SaveFormat.PPTX)
結果:
3D ベベル効果の追加
Aspose.Slides は、図形の [ThreeDFormat](https://reference.aspose.com/slides/ja/python-net/aspose.slides/threedformat/) プロパティを構成することで、3D ベベル効果を適用できます。
3D ベベル効果を図形に追加する手順は次のとおりです。
[Presentation](https://reference.aspose.com/slides/ja/python-net/aspose.slides/presentation/)クラスをインスタンス化します。- インデックスでスライドへの参照を取得します。
- スライドに
[AutoShape](https://reference.aspose.com/slides/ja/python-net/aspose.slides/autoshape/)を追加します。 - 図形の
[ThreeDFormat](https://reference.aspose.com/slides/ja/python-net/aspose.slides/threedformat/)を構成してベベル設定を定義します。 - プレゼンテーションを保存します。
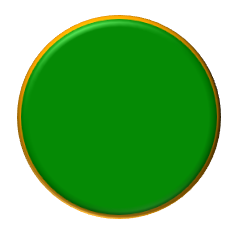
次の Python コードは、図形に 3D ベベル効果を適用する例です。
import aspose.slides as slides
import aspose.pydrawing as draw

# Presentation クラスのインスタンスを作成します。
with slides.Presentation() as presentation:

    slide = presentation.slides[0]

    # スライドにシェイプを追加します。
    shape = slide.shapes.add_auto_shape(slides.ShapeType.ELLIPSE, 50, 50, 100, 100)
    shape.fill_format.fill_type = slides.FillType.SOLID
    shape.fill_format.solid_fill_color.color = draw.Color.green
    shape.line_format.fill_format.fill_type = slides.FillType.SOLID
    shape.line_format.fill_format.solid_fill_color.color = draw.Color.orange
    shape.line_format.width = 2.0

    # シェイプの ThreeDFormat プロパティを設定します。
    shape.three_d_format.depth = 4
    shape.three_d_format.bevel_top.bevel_type = slides.BevelPresetType.CIRCLE
    shape.three_d_format.bevel_top.height = 6
    shape.three_d_format.bevel_top.width = 6
    shape.three_d_format.camera.camera_type = slides.CameraPresetType.ORTHOGRAPHIC_FRONT
    shape.three_d_format.light_rig.light_type = slides.LightRigPresetType.THREE_PT
    shape.three_d_format.light_rig.direction = slides.LightingDirection.TOP

    # プレゼンテーションを PPTX ファイルとして保存します。
    presentation.save("3D_bevel_effect.pptx", slides.export.SaveFormat.PPTX)
結果:
3D 回転効果の追加
Aspose.Slides は、図形の [ThreeDFormat](https://reference.aspose.com/slides/ja/python-net/aspose.slides/threedformat/) プロパティを構成することで、3D 回転効果を適用できます。
3D 回転を図形に適用する手順は次のとおりです。
[Presentation](https://reference.aspose.com/slides/ja/python-net/aspose.slides/presentation/)クラスのインスタンスを作成します。- インデックスでスライドへの参照を取得します。
- スライドに
[AutoShape](https://reference.aspose.com/slides/ja/python-net/aspose.slides/autoshape/)を追加します。 - 図形の
[camera_type](https://reference.aspose.com/slides/ja/python-net/aspose.slides/camera/camera_type/)と[light_type](https://reference.aspose.com/slides/ja/python-net/aspose.slides/lightrig/light_type/)を設定して 3D 回転を定義します。 - プレゼンテーションを保存します。
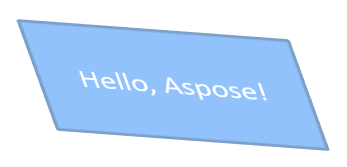
次の Python コードは、図形に 3D 回転効果を適用する例です。
import aspose.slides as slides

# Presentation クラスのインスタンスを作成します。
with slides.Presentation() as presentation:

    slide = presentation.slides[0]

    auto_shape = slide.shapes.add_auto_shape(slides.ShapeType.RECTANGLE, 50, 50, 150, 75)
    auto_shape.text_frame.text = "Hello, Aspose!"

    auto_shape.three_d_format.depth = 6
    auto_shape.three_d_format.camera.set_rotation(40, 35, 20)
    auto_shape.three_d_format.camera.camera_type = slides.CameraPresetType.ISOMETRIC_LEFT_UP
    auto_shape.three_d_format.light_rig.light_type = slides.LightRigPresetType.BALANCED

    # プレゼンテーションを PPTX ファイルとして保存します.
    presentation.save("3D_rotation_effect.pptx", slides.export.SaveFormat.PPTX)
結果:
図形の白黒表示制御
[Shape.black_white_mode](https://reference.aspose.com/slides/ja/python-net/aspose.slides/shape/black_white_mode/) プロパティは、プレゼンテーションが白黒モードで表示または処理される場合に、個々の図形がどのようにレンダリングされるかを指定します。白黒表示自体を有効にするものではなく、通常のカラー表示時の図形の塗り、線、その他の書式設定も変更しません。
[BlackWhiteMode](https://reference.aspose.com/slides/ja/python-net/aspose.slides/blackwhitemode/) 列挙体の値を使用して動作を選択します。たとえば、AUTOMATIC はレンダリングアプリケーションに変換を任せ、GRAY と LIGHT_GRAY はグレー表示、BLACK_WHITE は黒と白のみ、BLACK と WHITE は単一色、COLOR は通常のカラー保持、HIDDEN は白黒モードで図形を非表示にします。NOT_DEFINED は図形レベルでのモードが未設定であることを意味します。
次の Python コードは、カラーの図形を作成し、白黒表示モードでグレーに表示させる例です。
import aspose.slides as slides
import aspose.pydrawing as draw

with slides.Presentation() as presentation:
    slide = presentation.slides[0]

    shape = slide.shapes.add_auto_shape(slides.ShapeType.RECTANGLE, 50, 50, 200, 100)
    shape.fill_format.fill_type = slides.FillType.SOLID
    shape.fill_format.solid_fill_color.color = draw.Color.orange

    # カラーモードではオレンジの塗りつぶしを保持し、白黒モードでは図形をグレーで表示します。
    shape.black_white_mode = slides.BlackWhiteMode.GRAY

    presentation.save("shape_black_white_mode.pptx", slides.export.SaveFormat.PPTX)
通常のカラー表示では、矩形はオレンジの塗りつぶしを保持します。白黒表示のワークフローでは、モードが GRAY に設定されているためグレーで表示されます。これにより、フルカラーのスライドを保持しつつ、印刷やプレビューなど、プレゼンテーションの白黒表示設定を尊重するワークフローで別の外観を定義できます。
書式のリセット
次の Python コードは、スライドの書式をリセットし、[LayoutSlide](https://reference.aspose.com/slides/ja/python-net/aspose.slides/layoutslide/) 上のプレースホルダー付きすべての図形の位置、サイズ、書式をデフォルト設定に戻す方法を示しています。
import aspose.slides as slides

with slides.Presentation("sample.pptx") as presentation:

    for slide in presentation.slides:
        # レイアウトにプレースホルダーがあるスライド上の各シェイプをリセットします。
        slide.reset()

    presentation.save("reset_formatting.pptx", slides.export.SaveFormat.PPTX)
FAQ
図形の書式設定は最終的なプレゼンテーション ファイル サイズに影響しますか?
ほとんど影響しません。埋め込み画像やメディアがファイルサイズの大部分を占め、色やエフェクト、グラデーションなどの図形パラメータはメタデータとして保存され、実質的なサイズ増加はほぼありません。
同じ書式設定を持つ図形をスライド上で検出し、グループ化するにはどうすればよいですか?
各図形の主要な書式プロパティ(塗り、線、エフェクト設定)を比較します。すべての対応する値が一致すれば、書式が同一とみなし、論理的にグループ化できます。これにより、後のスタイル管理が簡素化されます。
カスタム図形スタイルのセットを別ファイルに保存し、他のプレゼンテーションで再利用できますか?
可能です。目的のスタイルを持つサンプル図形をテンプレート スライド デッキまたは .POTX テンプレート ファイルに保存します。新しいプレゼンテーションを作成する際にテンプレートを開き、必要なスタイルの図形をクローンして、必要な場所で書式を再適用します。