
在 Python 中格式化 PowerPoint 圖形
簡介
在 PowerPoint 中,您可以在投影片上加入圖形。由於圖形是由線條組成,您可以透過修改或套用效果來格式化它們的輪廓。此外,您亦可透過指定內部填滿的設定來格式化圖形。
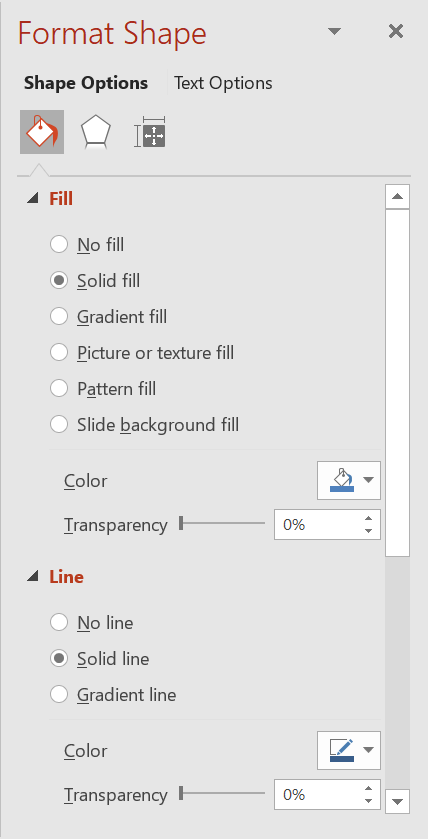
Aspose.Slides for Python 提供類別與屬性,讓您使用 PowerPoint 中相同的選項來格式化圖形。
格式化線條
使用 Aspose.Slides,您可以為圖形指定自訂的線條樣式。以下步驟說明了操作流程:
- 建立 Presentation 類別的實例。
- 依索引取得投影片參考。
- 在投影片上新增 AutoShape。
- 設定圖形的 line style。
- 設定線條寬度。
- 設定圖形的 dash style。
- 設定圖形的線條顏色。
- 將修改後的簡報另存為 PPTX 檔案。
以下 Python 程式碼示範如何格式化矩形 AutoShape:
import aspose.slides as slides
import aspose.pydrawing as draw

# 實例化代表簡報檔案的 Presentation 類別。
with slides.Presentation() as presentation:

    # 取得第一張投影片。
    slide = presentation.slides[0]

    # 加入矩形類型的自動圖形。
    shape = slide.shapes.add_auto_shape(slides.ShapeType.RECTANGLE, 50, 150, 150, 75)

    # 移除矩形圖形的填滿,使僅顯示其線條。
    shape.fill_format.fill_type = slides.FillType.NO_FILL

    # 套用格式化到矩形的線條。
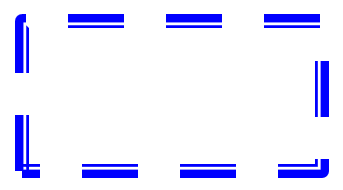
    shape.line_format.style = slides.LineStyle.THICK_THIN
    shape.line_format.width = 7
    shape.line_format.dash_style = slides.LineDashStyle.DASH

    # 設定矩形線條的顏色。
    shape.line_format.fill_format.fill_type = slides.FillType.SOLID
    shape.line_format.fill_format.solid_fill_color.color = draw.Color.blue

    # 將 PPTX 檔案儲存至磁碟。
    presentation.save("formatted_lines.pptx", slides.export.SaveFormat.PPTX)
結果:
為圖形線條套用草圖效果
草圖效果會使圖形線條看起來像手繪。使用 Shape.line_format 取得線條設定,使用 LineFormat.sketch_format 取得草圖設定,並使用 SketchFormat.sketch_type 從 LineSketchType 列舉中選取值。
以下 Python 程式碼顯示如何套用 LineSketchType.CURVED 效果、讀取明確指派的值,並使用 LineSketchType.NONE 移除效果:
import aspose.slides as slides

with slides.Presentation() as presentation:
    slide = presentation.slides[0]
    shape = slide.shapes.add_auto_shape(slides.ShapeType.RECTANGLE, 50, 50, 200, 100)

    # 取得圖形的線條格式及其草圖格式。
    sketch_format = shape.line_format.sketch_format

    # 套用草圖效果。
    sketch_format.sketch_type = slides.LineSketchType.CURVED

    # 讀取直接指派給圖形的草圖效果。
    explicit_sketch_type = sketch_format.sketch_type
    print(f"Explicit sketch type: {explicit_sketch_type}")

    # 移除草圖效果。
    sketch_format.sketch_type = slides.LineSketchType.NONE
SketchFormat.sketch_type 回傳的值代表直接指派給圖形的設定。如果線條格式是從佈景主題、母片或版面投影片繼承而來,請使用 LineFormat.get_effective,存取回傳物件的 sketch_format 屬性,並讀取其 sketch_type 屬性。Effective 值會在繼承解析後反映實際套用的格式:
import aspose.slides as slides

with slides.Presentation("presentation.pptx") as presentation:
    shape = presentation.slides[0].shapes[0]
    line_format = shape.line_format

    explicit_sketch_type = line_format.sketch_format.sketch_type
    effective_line_format = line_format.get_effective()
    effective_sketch_type = effective_line_format.sketch_format.sketch_type

    print(f"Explicit sketch type: {explicit_sketch_type}")
    print(f"Effective sketch type: {effective_sketch_type}")
格式化接合樣式
以下是三種接合類型選項:
- Round
- Miter
- Bevel
預設情況下,PowerPoint 在角度處(例如圖形的角落)連接兩條線時,使用 Round 設定。但如果您繪製的是尖銳角度的圖形,可能會較偏好 Miter 選項。
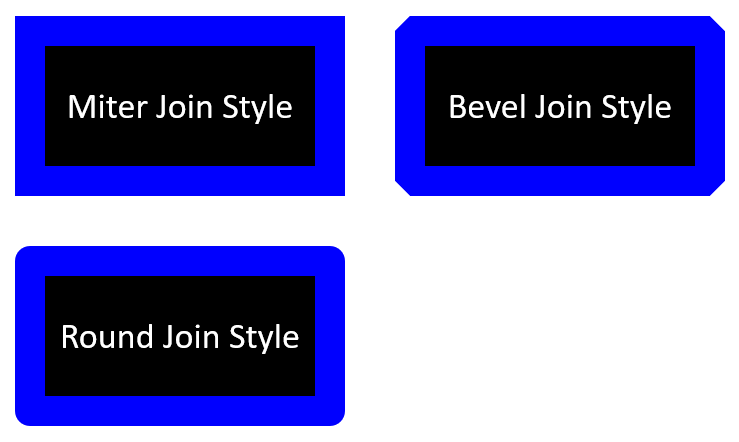
以下 Python 程式碼示範如何使用 Miter、Bevel 與 Round 接合類型設定建立三個矩形(如上圖所示):
import aspose.slides as slides
import aspose.pydrawing as draw

# 實例化代表簡報檔案的 Presentation 類別。
with slides.Presentation() as presentation:

	# 取得第一張投影片。
	slide = presentation.slides[0]

	# 新增三個矩形類型的自動圖形。
	shape1 = slide.shapes.add_auto_shape(slides.ShapeType.RECTANGLE, 20, 20, 150, 75)
	shape2 = slide.shapes.add_auto_shape(slides.ShapeType.RECTANGLE, 210, 20, 150, 75)
	shape3 = slide.shapes.add_auto_shape(slides.ShapeType.RECTANGLE, 20, 135, 150, 75)

	# 設定每個矩形圖形的填色。
	shape1.fill_format.fill_type = slides.FillType.SOLID
	shape1.fill_format.solid_fill_color.color = draw.Color.black
	shape2.fill_format.fill_type = slides.FillType.SOLID
	shape2.fill_format.solid_fill_color.color = draw.Color.black
	shape3.fill_format.fill_type = slides.FillType.SOLID
	shape3.fill_format.solid_fill_color.color = draw.Color.black

	# 設定線條寬度。
	shape1.line_format.width = 15
	shape2.line_format.width = 15
	shape3.line_format.width = 15

	# 設定每個矩形線條的顏色。
	shape1.line_format.fill_format.fill_type = slides.FillType.SOLID
	shape1.line_format.fill_format.solid_fill_color.color = draw.Color.blue
	shape2.line_format.fill_format.fill_type = slides.FillType.SOLID
	shape2.line_format.fill_format.solid_fill_color.color = draw.Color.blue
	shape3.line_format.fill_format.fill_type = slides.FillType.SOLID
	shape3.line_format.fill_format.solid_fill_color.color = draw.Color.blue

	# 設定接合樣式。
	shape1.line_format.join_style = slides.LineJoinStyle.MITER
	shape2.line_format.join_style = slides.LineJoinStyle.BEVEL
	shape3.line_format.join_style = slides.LineJoinStyle.ROUND

	# 為每個矩形加入文字。
	shape1.text_frame.text = "Miter Join style"
	shape2.text_frame.text = "Bevel Join style"
	shape3.text_frame.text = "Round Join style"

	# 將 PPTX 檔案儲存至磁碟。
	presentation.save("join_styles.pptx", slides.export.SaveFormat.PPTX)
漸層填滿
在 PowerPoint 中,漸層填滿是一種格式化選項,允許您對圖形套用連續的顏色混合。例如,您可以以逐漸淡出方式將兩種或以上的顏色應用於圖形。
以下說明如何使用 Aspose.Slides 為圖形套用漸層填滿:
- 建立 Presentation 類別的實例。
- 依索引取得投影片參考。
- 在投影片上新增 AutoShape。
- 將圖形的 FillType 設為
GRADIENT。 - 使用 GradientFormat 類別所公開的
gradient_stops集合的add方法,依您定義的位置加入兩個首選顏色。 - 將修改後的簡報另存為 PPTX 檔案。
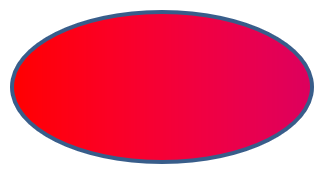
以下 Python 程式碼示範如何為橢圓套用漸層填滿效果:
import aspose.slides as slides

# 實例化代表簡報檔案的 Presentation 類別。
with slides.Presentation() as presentation:

    # 取得第一張投影片。
    slide = presentation.slides[0]

    # 新增橢圓類型的自動圖形。
    shape = slide.shapes.add_auto_shape(slides.ShapeType.ELLIPSE, 50, 50, 150, 75)

    # 套用漸層格式至橢圓。
    shape.fill_format.fill_type = slides.FillType.GRADIENT
    shape.fill_format.gradient_format.gradient_shape = slides.GradientShape.LINEAR

    # 設定漸層的方向。
    shape.fill_format.gradient_format.gradient_direction = slides.GradientDirection.FROM_CORNER2

    # 新增兩個漸層停止點。
    shape.fill_format.gradient_format.gradient_stops.add(1.0, slides.PresetColor.PURPLE)
    shape.fill_format.gradient_format.gradient_stops.add(0, slides.PresetColor.RED)

    # 將 PPTX 檔案儲存至磁碟。
    presentation.save("gradient_fill.pptx", slides.export.SaveFormat.PPTX)
結果:
圖案填滿
在 PowerPoint 中,圖案填滿是一種格式化選項,允許您以兩種顏色的設計(例如點、條紋、交叉陰影或格子)來填滿圖形。您可以為圖案的前景色與背景色選擇自訂顏色。
Aspose.Slides 提供超過 45 種預定義圖案樣式,您可以套用於圖形以提升簡報的視覺效果。即使選取了預定義圖案,仍可自行指定其使用的確切顏色。
以下說明如何使用 Aspose.Slides 為圖形套用圖案填滿:
- 建立 Presentation 類別的實例。
- 依索引取得投影片參考。
- 在投影片上新增 AutoShape。
- 將圖形的 FillType 設為
PATTERN。 - 從預定義選項中選擇圖案樣式。
- 設定圖案的 back_color。
- 設定圖案的 fore_color。
- 將修改後的簡報另存為 PPTX 檔案。
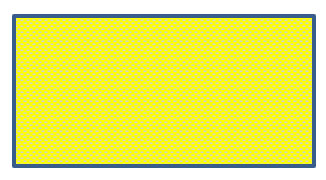
以下 Python 程式碼示範如何為矩形套用圖案填滿:
import aspose.slides as slides
import aspose.pydrawing as draw

# 實例化代表簡報檔案的 Presentation 類別。
with slides.Presentation() as presentation:

    # 取得第一張投影片。
    slide = presentation.slides[0]

    # 新增矩形類型的自動圖形。
    shape = slide.shapes.add_auto_shape(slides.ShapeType.RECTANGLE, 50, 50, 150, 75)

    # 設定填充類型為圖案。
    shape.fill_format.fill_type = slides.FillType.PATTERN

    # 設定圖案樣式。
    shape.fill_format.pattern_format.pattern_style = slides.PatternStyle.TRELLIS

    # 設定圖案的背景色和前景色。
    shape.fill_format.pattern_format.back_color.color = draw.Color.light_gray
    shape.fill_format.pattern_format.fore_color.color = draw.Color.yellow

    # 將 PPTX 檔案儲存至磁碟。
    presentation.save("pattern_fill.pptx", slides.export.SaveFormat.PPTX)
結果:
圖片填滿
在 PowerPoint 中,圖片填滿是一種格式化選項,允許您在圖形內插入圖片──實質上將圖片作為圖形的背景。
以下說明如何使用 Aspose.Slides 為圖形套用圖片填滿:
- 建立 Presentation 類別的實例。
- 依索引取得投影片參考。
- 在投影片上新增 AutoShape。
- 將圖形的 FillType 設為
PICTURE。 - 將圖片填滿模式設為
TILE(或其他您偏好的模式)。 - 從您要使用的影像建立一個 PPImage 物件。
- 將此影像指派給圖形的
picture_fill_format之picture.image屬性。 - 將修改後的簡報另存為 PPTX 檔案。
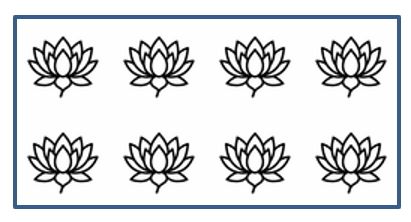
假設我們有一個名為 “lotus.png” 的檔案,其圖片如下:

以下 Python 程式碼示範如何以圖片填滿圖形:
import aspose.slides as slides

# 實例化代表簡報檔案的 Presentation 類別。
with slides.Presentation() as presentation:

    # 取得第一張投影片。
    slide = presentation.slides[0]

    # 新增矩形類型的自動圖形。
    shape = slide.shapes.add_auto_shape(slides.ShapeType.RECTANGLE, 50, 50, 192, 95)

    # 設定填充類型為圖片。
    shape.fill_format.fill_type = slides.FillType.PICTURE

    # 設定圖片填充模式。
    shape.fill_format.picture_fill_format.picture_fill_mode = slides.PictureFillMode.TILE

    # 載入影像並將其加入簡報資源。
    with slides.Images.from_file("lotus.png") as image:
        presentation_image = presentation.images.add_image(image)

    # 設定圖片。
    shape.fill_format.picture_fill_format.picture.image = presentation_image

    # 將 PPTX 檔案儲存至磁碟。
    presentation.save("picture_fill.pptx", slides.export.SaveFormat.PPTX)
結果:
將圖片平鋪為紋理
如果您想將平鋪的圖片作為紋理,並自訂平鋪行為,可使用 PictureFillFormat 類別的以下屬性:
- picture_fill_mode:設定圖片填滿模式──
TILE或STRETCH。 - tile_alignment:指定平鋪在圖形內的對齊方式。
- tile_flip:控制平鋪是否水平、垂直或同時翻轉。
- tile_offset_x:設定平鋪相對於圖形原點的水平偏移(單位為點)。
- tile_offset_y:設定平鋪相對於圖形原點的垂直偏移(單位為點)。
- tile_scale_x:以百分比定義水平縮放比例。
- tile_scale_y:以百分比定義垂直縮放比例。
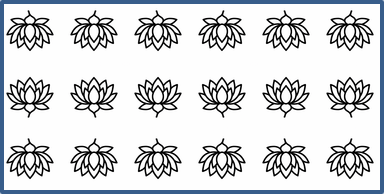
以下程式碼範例示範如何新增一個帶有平鋪圖片填滿的矩形,並設定平鋪選項:
import aspose.slides as slides

# 實例化代表簡報檔案的 Presentation 類別。
with slides.Presentation() as presentation:

    # 取得第一張投影片。
    first_slide = presentation.slides[0]

    # 新增矩形自動圖形。
    shape = first_slide.shapes.add_auto_shape(slides.ShapeType.RECTANGLE, 50, 50, 190, 95)

    # 設定圖形的填充類型為圖片。
    shape.fill_format.fill_type = slides.FillType.PICTURE

    # 載入影像並將其加入簡報資源。
    with slides.Images.from_file("lotus.png") as source_image:
        presentation_image = presentation.images.add_image(source_image)

    # 將影像指派給圖形。
    picture_fill_format = shape.fill_format.picture_fill_format
    picture_fill_format.picture.image = presentation_image

    # 設定圖片填充模式與平鋪屬性。
    picture_fill_format.picture_fill_mode = slides.PictureFillMode.TILE
    picture_fill_format.tile_offset_x = -32
    picture_fill_format.tile_offset_y = -32
    picture_fill_format.tile_scale_x = 50
    picture_fill_format.tile_scale_y = 50
    picture_fill_format.tile_alignment = slides.RectangleAlignment.BOTTOM_RIGHT
    picture_fill_format.tile_flip = slides.TileFlip.FLIP_BOTH

    # 將 PPTX 檔案儲存至磁碟。
    presentation.save("tile.pptx", slides.export.SaveFormat.PPTX)
結果:
實色填滿
在 PowerPoint 中,實色填滿是一種格式化選項,會以單一、均勻的顏色填滿圖形。此純色背景不含任何漸層、紋理或圖案。
使用 Aspose.Slides 為圖形套用實色填滿,請依下列步驟操作:
- 建立 Presentation 類別的實例。
- 依索引取得投影片參考。
- 在投影片上新增 AutoShape。
- 將圖形的 FillType 設為
SOLID。 - 將您偏好的填色指派給圖形。
- 將修改後的簡報另存為 PPTX 檔案。
以下 Python 程式碼示範如何在 PowerPoint 投影片的矩形上套用實色填滿:
import aspose.slides as slides
import aspose.pydrawing as draw

# 實例化代表簡報檔案的 Presentation 類別。
with slides.Presentation() as presentation:

    # 取得第一張投影片。
    slide = presentation.slides[0]

    # 新增矩形類型的自動圖形。
    shape = slide.shapes.add_auto_shape(slides.ShapeType.RECTANGLE, 50, 50, 150, 75)

    # 設定填充類型為實色。
    shape.fill_format.fill_type = slides.FillType.SOLID

    # 設定填充顏色。
    shape.fill_format.solid_fill_color.color = draw.Color.yellow

    # 將 PPTX 檔案儲存至磁碟。
    presentation.save("solid_color_fill.pptx", slides.export.SaveFormat.PPTX)
結果:
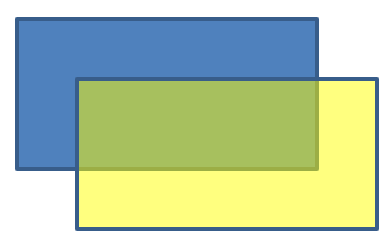
設定透明度
在 PowerPoint 中,當您對圖形套用實色、漸層、圖片或紋理填滿時,也可以設定透明度,以控制填滿的不透明程度。較高的透明度值會讓圖形更透,讓背景或底層物件部分可見。
Aspose.Slides 允許您透過調整用於填滿的顏色的 Alpha 值來設定透明度。操作步驟如下:
- 建立 Presentation 類別的實例。
- 依索引取得投影片參考。
- 在投影片上新增 AutoShape。
- 將填滿類型設為
SOLID。 - 使用
Color.from_argb定義具透明度的顏色(alpha元素控制透明度)。 - 儲存簡報。
以下 Python 程式碼示範如何為矩形套用透明填色:
import aspose.pydrawing as draw
import aspose.slides as slides

# 實例化代表簡報檔案的 Presentation 類別。
with slides.Presentation() as presentation:

    # 取得第一張投影片。
    slide = presentation.slides[0]

    # 新增實色矩形自動圖形。
    slide.shapes.add_auto_shape(slides.ShapeType.RECTANGLE, 50, 50, 150, 75)

    # 在實色圖形上方新增透明矩形自動圖形。
    shape = slide.shapes.add_auto_shape(slides.ShapeType.RECTANGLE, 80, 80, 150, 75)
    shape.fill_format.fill_type = slides.FillType.SOLID
    shape.fill_format.solid_fill_color.color = draw.Color.from_argb(128, 204, 102, 0)

    presentation.save("shape_transparency.pptx", slides.export.SaveFormat.PPTX)
結果:
旋轉圖形
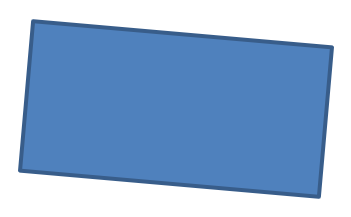
Aspose.Slides 讓您在 PowerPoint 簡報中旋轉圖形。這在需要特定對齊或設計需求的視覺元素定位時非常實用。
要在投影片上旋轉圖形,請依以下步驟操作:
- 建立 Presentation 類別的實例。
- 依索引取得投影片參考。
- 在投影片上新增 AutoShape。
- 將圖形的
rotation屬性設定為目標角度。 - 儲存簡報。
以下 Python 程式碼示範如何將圖形旋轉 5 度:
import aspose.slides as slides

# 實例化代表簡報檔案的 Presentation 類別。
with slides.Presentation() as presentation:

    # 取得第一張投影片。
    slide = presentation.slides[0]

    # 新增矩形類型的自動圖形。
    shape = slide.shapes.add_auto_shape(slides.ShapeType.RECTANGLE, 50, 50, 150, 75)

    # 將圖形旋轉 5 度。
    shape.rotation = 5

    # 將 PPTX 檔案儲存至磁碟。
    presentation.save("shape_rotation.pptx", slides.export.SaveFormat.PPTX)
結果:
新增 3D 倒角效果
Aspose.Slides 允許您透過設定圖形的 ThreeDFormat 屬性,為圖形加入 3D 倒角效果。
要為圖形新增 3D 倒角效果,請依以下步驟操作:
- 實例化 Presentation 類別。
- 依索引取得投影片參考。
- 在投影片上新增 AutoShape。
- 設定圖形的 ThreeDFormat 以定義倒角設定。
- 儲存簡報。
以下 Python 程式碼顯示如何為圖形套用 3D 倒角效果:
import aspose.slides as slides
import aspose.pydrawing as draw

# 建立 Presentation 類別的實例。
with slides.Presentation() as presentation:

    slide = presentation.slides[0]

    # 在投影片上加入圖形。
    shape = slide.shapes.add_auto_shape(slides.ShapeType.ELLIPSE, 50, 50, 100, 100)
    shape.fill_format.fill_type = slides.FillType.SOLID
    shape.fill_format.solid_fill_color.color = draw.Color.green
    shape.line_format.fill_format.fill_type = slides.FillType.SOLID
    shape.line_format.fill_format.solid_fill_color.color = draw.Color.orange
    shape.line_format.width = 2.0

    # 設定圖形的 ThreeDFormat 屬性。
    shape.three_d_format.depth = 4
    shape.three_d_format.bevel_top.bevel_type = slides.BevelPresetType.CIRCLE
    shape.three_d_format.bevel_top.height = 6
    shape.three_d_format.bevel_top.width = 6
    shape.three_d_format.camera.camera_type = slides.CameraPresetType.ORTHOGRAPHIC_FRONT
    shape.three_d_format.light_rig.light_type = slides.LightRigPresetType.THREE_PT
    shape.three_d_format.light_rig.direction = slides.LightingDirection.TOP

    # 將簡報儲存為 PPTX 檔案。
    presentation.save("3D_bevel_effect.pptx", slides.export.SaveFormat.PPTX)
結果:

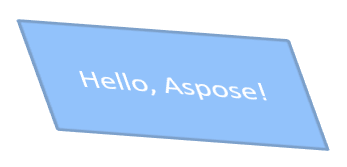
新增 3D 旋轉效果
Aspose.Slides 允許您透過設定圖形的 ThreeDFormat 屬性,為圖形加入 3D 旋轉效果。
要為圖形套用 3D 旋轉:
- 建立 Presentation 類別的實例。
- 依索引取得投影片參考。
- 在投影片上新增 AutoShape。
- 設定圖形的 camera_type 與 light_type 以定義 3D 旋轉。
- 儲存簡報。
以下 Python 程式碼示範如何為圖形套用 3D 旋轉效果:
import aspose.slides as slides

# 建立 Presentation 類別的實例。
with slides.Presentation() as presentation:

    slide = presentation.slides[0]

    auto_shape = slide.shapes.add_auto_shape(slides.ShapeType.RECTANGLE, 50, 50, 150, 75)
    auto_shape.text_frame.text = "Hello, Aspose!"

    auto_shape.three_d_format.depth = 6
    auto_shape.three_d_format.camera.set_rotation(40, 35, 20)
    auto_shape.three_d_format.camera.camera_type = slides.CameraPresetType.ISOMETRIC_LEFT_UP
    auto_shape.three_d_format.light_rig.light_type = slides.LightRigPresetType.BALANCED

    # 將簡報儲存為 PPTX 檔案。
    presentation.save("3D_rotation_effect.pptx", slides.export.SaveFormat.PPTX)
結果:
控制圖形的黑白顯示
Shape.black_white_mode 屬性指定當簡報以黑白模式檢視或處理時,單一圖形的呈現方式。它本身不會啟用黑白顯示,也不會在正常彩色模式下改變圖形的填滿、線條或其他格式。
使用 BlackWhiteMode 列舉中的值來選擇所需行為。例如,AUTOMATIC 讓渲染應用程式自行決定轉換方式,GRAY 與 LIGHT_GRAY 使用灰階顏色,BLACK_WHITE 僅使用黑白,BLACK 與 WHITE 強制單一顏色,COLOR 保留正常顏色,HIDDEN 在黑白模式下隱藏圖形,NOT_DEFINED 表示未指派圖形層級的模式。
以下 Python 程式碼建立一個彩色圖形,並在黑白顯示模式下讓其呈現為灰色:
import aspose.slides as slides
import aspose.pydrawing as draw

with slides.Presentation() as presentation:
    slide = presentation.slides[0]

    shape = slide.shapes.add_auto_shape(slides.ShapeType.RECTANGLE, 50, 50, 200, 100)
    shape.fill_format.fill_type = slides.FillType.SOLID
    shape.fill_format.solid_fill_color.color = draw.Color.orange

    # 在彩色模式下保留橙色填色,但在黑白模式下以灰色顯示圖形。
    shape.black_white_mode = slides.BlackWhiteMode.GRAY

    presentation.save("shape_black_white_mode.pptx", slides.export.SaveFormat.PPTX)
在正常彩色模式下,矩形保留橙色填色;在黑白顯示工作流程中,因模式設定為 GRAY,因此使用灰色顯示。這讓您在保留完整彩色投影片的同時,為列印、預覽或其他遵循簡報黑白顯示設定的工作流程定義不同的外觀。
重設格式
以下 Python 程式碼示範如何重設投影片的格式,並將所有佔位符圖形在 LayoutSlide 上的位置、大小與格式還原為預設設定:
import aspose.slides as slides

with slides.Presentation("sample.pptx") as presentation:

    for slide in presentation.slides:
        # 重設投影片上具有版面佔位符的每個圖形。
        slide.reset()

    presentation.save("reset_formatting.pptx", slides.export.SaveFormat.PPTX)
常見問題
圖形格式化會影響最終簡報檔案大小嗎?
影響極小。嵌入的影像與媒體佔用大部分檔案空間,而顏色、效果與漸層等圖形參數以中繼資料形式儲存,幾乎不會增加額外大小。
如何偵測投影片上具有相同格式的圖形,以便將它們分組?
比較每個圖形的關鍵格式屬性──填滿、線條與效果設定。若所有對應值皆相同,則視為格式相同,可在邏輯上將這些圖形分組,從而簡化後續的樣式管理。
我可以將自訂的圖形樣式集合儲存為單獨的檔案,以便在其他簡報中重複使用嗎?
可以。將帶有所需樣式的樣本圖形儲存於範本投影片或 .POTX 範本檔案中。建立新簡報時,開啟該範本,複製您需要的樣式圖形,然後在需要的地方重新套用其格式。