
Manage Chart Workbooks in Presentations Using Python via Java
Overview
This article explains how to work with chart workbooks in Aspose.Slides. It shows how to read and write chart data through workbook streams, use workbook cells as chart data labels, access worksheet collections, and specify the data source type for chart values.
It also covers working with external workbooks as chart data sources. The examples demonstrate how to create and assign an external workbook, retrieve the path of an external workbook linked to a chart, and edit chart data when the workbook is available.
For workbook cells that represent missing data, see Control the Display of Empty Cells for the difference between an empty cell and zero, and a line-chart comparison of the available display modes.
Include Data from Hidden Rows and Columns
Use Chart.setPlotVisibleCellsOnly to control whether a chart plots data from hidden worksheet rows and columns. Set it to True to plot only visible cells, or False to include both visible and hidden cells. This setting controls chart plotting; it does not hide or unhide worksheet rows or columns.
Download hidden-source-data.pptx and place it in the working directory. Its first slide contains a column chart as the first shape. The embedded worksheet, Sheet1, contains the following source range, A1:C4. Row 3 and column C are hidden, but their cells still contain values.
| Worksheet row | A: Month | B: Retail | C: Wholesale (hidden column) |
|---|---|---|---|
| 2 | January | 10 | 30 |
| 3 (hidden row) | February | 40 | 60 |
| 4 | March | 20 | 50 |
Access source cells through ChartData.getChartDataWorkbook and read ChartDataCell.isHidden to inspect their hidden status. This method reports the hidden status without changing it. In this file, B2 is visible, B3 belongs to the hidden row, and C2 belongs to the hidden column; the example prints False, True, and True, respectively.
For this example, refresh the chart data after changing the plotting setting: retain the embedded workbook with readWorkbookStream and reload it with writeWorkbookStream. When including all cells, also use setRange to restore the complete range, including the hidden February category. Simply changing the flag is insufficient to refresh this sample’s cached chart data and category labels.
import jpype
import asposeslides

if not jpype.isJVMStarted():
    jpype.startJVM()

from asposeslides.api import Chart, Presentation, SaveFormat

presentation = Presentation("hidden-source-data.pptx")
try:
    slide = presentation.getSlides().get_Item(0)

    shape_count = slide.getShapes().size()
    if shape_count > 0 and isinstance(slide.getShapes().get_Item(0), Chart):
        chart = slide.getShapes().get_Item(0)
        workbook = chart.getChartData().getChartDataWorkbook()
        print("B2 hidden:", workbook.getCell(0, "B2").isHidden())
        print("B3 hidden:", workbook.getCell(0, "B3").isHidden())
        print("C2 hidden:", workbook.getCell(0, "C2").isHidden())

        workbook_data = chart.getChartData().readWorkbookStream()
        for visible_only in (True, False):
            chart.setPlotVisibleCellsOnly(visible_only)

            # Refresh the chart data from the embedded workbook.
            chart.getChartData().writeWorkbookStream(workbook_data)
            if not visible_only:
                # Restore the complete source range, including hidden categories.
                chart.getChartData().setRange("Sheet1!$A$1:$C$4")

            presentation.save(f"hidden_cells_{visible_only}.pptx", SaveFormat.Pptx)
    else:
        print("The first shape is not a chart.")
finally:
    presentation.dispose()
The example saves hidden_cells_True.pptx with only the visible Retail values (10 and 20), and hidden_cells_False.pptx with all six values. The images below illustrate the two plotting modes. Row 3 and column C remain hidden in both embedded workbooks.
Only visible cells (True) |
All cells (False) |
|---|---|
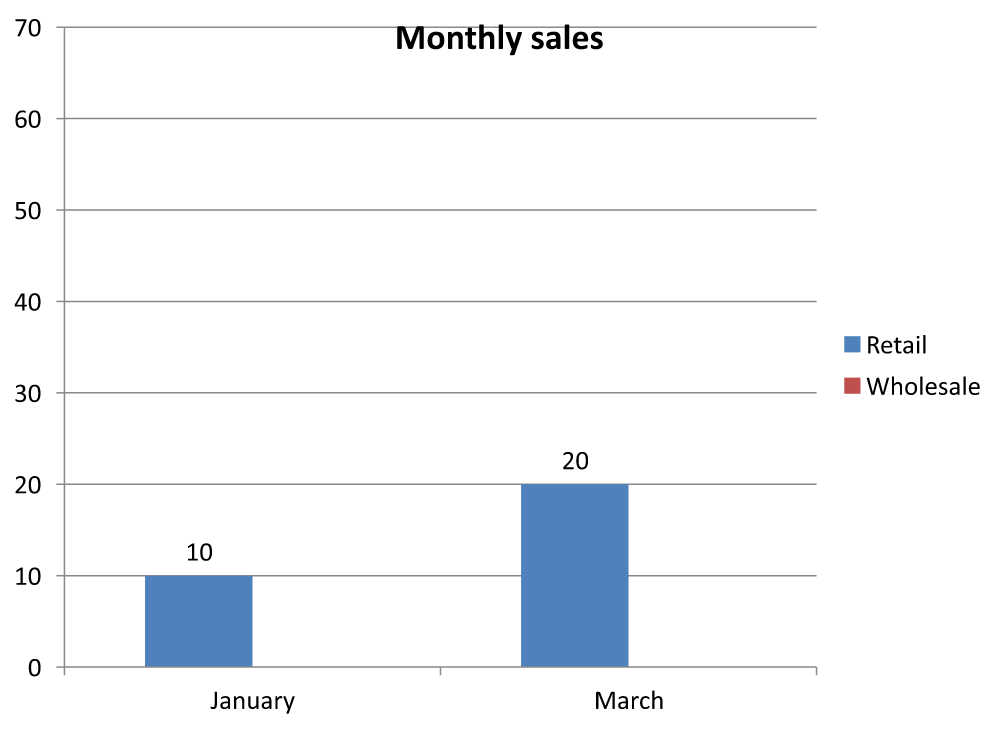 |
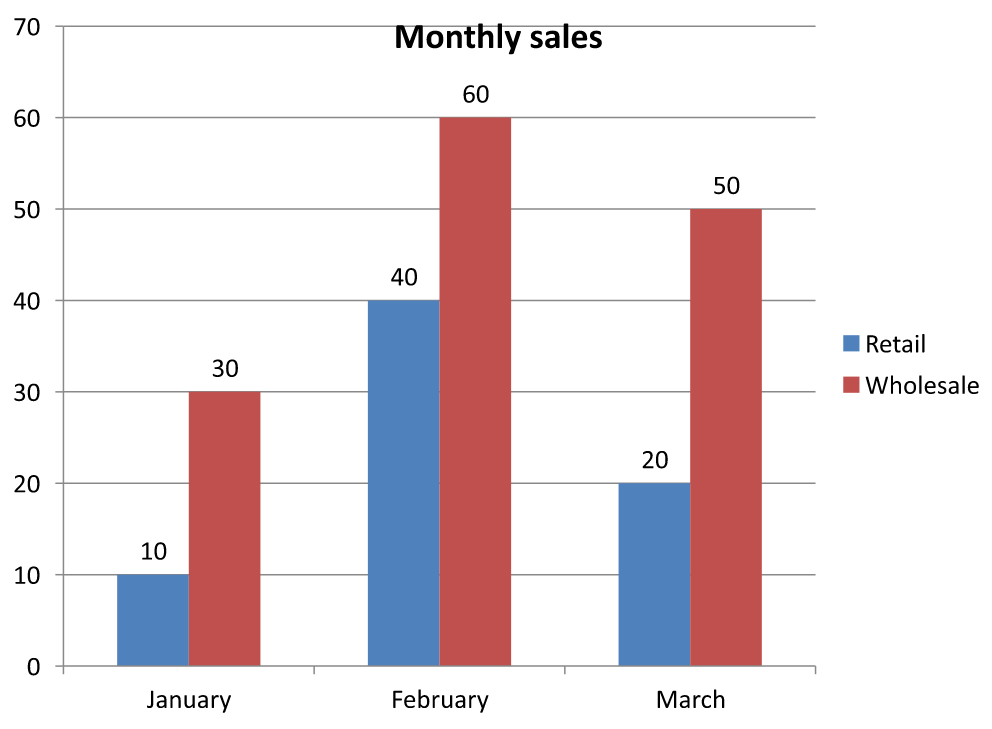 |
A hidden cell containing a value is different from an empty cell. Chart.setDisplayBlanksAs controls how missing values are displayed; it does not include or exclude hidden source data. See Control the Display of Empty Cells for an example.
Read and Write Chart Data from a Workbook
Aspose.Slides for Python via Java provides the readWorkbookStream and writeWorkbookStream methods that allow you to read and write chart data workbooks (containing chart data edited with Aspose.Cells). Note that the chart data has to be organized in the same manner or must have a structure similar to the source.
This example opens chart.pptx, which must contain a chart as the first shape on its first slide. It reads the embedded workbook into a byte array, clears the existing series and categories, and writes the same workbook back. The changes remain in memory; the example does not save the presentation.
import jpype
import asposeslides

if not jpype.isJVMStarted():
    jpype.startJVM()

from asposeslides.api import Chart, Presentation

presentation = Presentation("chart.pptx")
try:
    slide = presentation.getSlides().get_Item(0)

    shape_count = slide.getShapes().size()
    if shape_count > 0 and isinstance(slide.getShapes().get_Item(0), Chart):
        chart = slide.getShapes().get_Item(0)
        chart_data = chart.getChartData()
        workbook_data = chart_data.readWorkbookStream()

        chart_data.getSeries().clear()
        chart_data.getCategories().clear()

        chart_data.writeWorkbookStream(workbook_data)
    else:
        print("The first shape is not a chart.")
finally:
    presentation.dispose()
Validate Chart Layout After Workbook Modification
When you replace an embedded workbook with a modified one, the chart retains its original series and category collections. This mismatch can cause Chart.validateChartLayout to fail with an index-out-of-range error. Clear the existing series and categories before writing the updated workbook back to the chart. This example requires chart.pptx with a chart as the first shape on its first slide. The comment marks where workbook editing would occur; the runnable example writes the original workbook back and validates the layout in memory.
import jpype
import asposeslides

if not jpype.isJVMStarted():
    jpype.startJVM()

from asposeslides.api import Chart, Presentation

presentation = Presentation("chart.pptx")
try:
    slide = presentation.getSlides().get_Item(0)

    shape_count = slide.getShapes().size()
    if shape_count > 0 and isinstance(slide.getShapes().get_Item(0), Chart):
        chart = slide.getShapes().get_Item(0)
        chart_data = chart.getChartData()
        workbook_data = chart_data.readWorkbookStream()

        # Modify the workbook bytes here, for example, using Aspose.Cells.

        chart_data.getSeries().clear()
        chart_data.getCategories().clear()

        chart_data.writeWorkbookStream(workbook_data)
        chart.validateChartLayout()
    else:
        print("The first shape is not a chart.")
finally:
    presentation.dispose()
Clearing the collections removes stale data references before the workbook is written back. Rebuild any required series and category mappings for the updated workbook before using the chart.
Set a Workbook Cell as a Chart Data Label
You can use text from workbook cells as chart data labels. The following steps show how to link the labels in a bubble chart to cells in its data workbook.
- Create an instance of the Presentation class.
- Access the first slide by its zero-based index.
- Add a bubble chart with default data.
- Access the chart series.
- Set the workbook cell as a data label.
- Save the presentation.
This example opens chart2.pptx, which must contain at least one slide, and adds a bubble chart with default data. It uses cells A10:A12 on worksheet 0 for the first three labels in the first series, enables labels from cells, and saves the result to resultchart.pptx.
import jpype
import asposeslides

if not jpype.isJVMStarted():
    jpype.startJVM()

from asposeslides.api import ChartType, Presentation, SaveFormat

presentation = Presentation("chart2.pptx")
try:
    slide = presentation.getSlides().get_Item(0)
    label_values = ["Label 0 cell value", "Label 1 cell value", "Label 2 cell value"]

    chart = slide.getShapes().addChart(ChartType.Bubble, 50, 50, 600, 400, True)
    series = chart.getChartData().getSeries()
    data_labels = series.get_Item(0).getLabels()
    data_labels.getDefaultDataLabelFormat().setShowLabelValueFromCell(True)
    workbook = chart.getChartData().getChartDataWorkbook()
    for i in range(3):
        label_cell = workbook.getCell(0, f"A{10 + i}", label_values[i])
        data_labels.get_Item(i).setValueFromCell(label_cell)

    presentation.save("resultchart.pptx", SaveFormat.Pptx)
finally:
    presentation.dispose()
Manage Worksheets
The ChartDataWorkbook.getWorksheets method provides access to the worksheets in a chart workbook. This example creates a pie chart with default data and prints each worksheet name to the console.
import jpype
import asposeslides

if not jpype.isJVMStarted():
    jpype.startJVM()

from asposeslides.api import ChartType, Presentation

presentation = Presentation()
try:
    slide = presentation.getSlides().get_Item(0)

    chart = slide.getShapes().addChart(ChartType.Pie, 50, 50, 400, 500)
    workbook = chart.getChartData().getChartDataWorkbook()
    for i in range(workbook.getWorksheets().size()):
        print(workbook.getWorksheets().get_Item(i).getName())
finally:
    presentation.dispose()
Specify the Data Source Type
This example creates a 3D column chart with default data and sets two series names using different data sources. The first name uses a string literal; the second uses cell C1 on worksheet 0. The DataSourceType enumeration selects the source for each name. The result is saved to pres.pptx.
import jpype
import asposeslides

if not jpype.isJVMStarted():
    jpype.startJVM()

from asposeslides.api import ChartType, DataSourceType, Presentation, SaveFormat

presentation = Presentation()
try:
    slide = presentation.getSlides().get_Item(0)

    chart = slide.getShapes().addChart(ChartType.Column3D, 50, 50, 600, 400, True)
    literal_name = chart.getChartData().getSeries().get_Item(0).getName()
    literal_name.setDataSourceType(DataSourceType.StringLiterals)
    literal_name.setData("LiteralString")
    cell_name = chart.getChartData().getSeries().get_Item(1).getName()
    name_cell = chart.getChartData().getChartDataWorkbook().getCell(0, "C1", "NewCell")
    cell_name.setDataSourceType(DataSourceType.Worksheet)
    cell_name.setData(name_cell)

    presentation.save("pres.pptx", SaveFormat.Pptx)
finally:
    presentation.dispose()
Detect Unsupported Embedded Workbook Formats
Aspose.Slides does not support the Excel binary workbook (.xlsb) format that can be embedded in some charts. You can use the getEmbeddedWorkbookType method on ChartData together with the WorkbookType enumeration to detect unsupported formats and skip those charts. This example inspects the shapes on the first slide of sample.pptx, skips non-chart shapes, and prints a diagnostic message for each chart with an embedded .xlsb workbook.
import jpype
import asposeslides

if not jpype.isJVMStarted():
    jpype.startJVM()

from asposeslides.api import Chart, ChartDataSourceType, Presentation, WorkbookType

presentation = Presentation("sample.pptx")
try:
    slide = presentation.getSlides().get_Item(0)

    for shape in slide.getShapes():
        if not isinstance(shape, Chart):
            continue

        chart_data = shape.getChartData()

        is_internal_workbook = chart_data.getDataSourceType() == ChartDataSourceType.InternalWorkbook
        is_binary_macro = chart_data.getEmbeddedWorkbookType() == WorkbookType.WorkbookBinaryMacro

        if is_internal_workbook and is_binary_macro:
            print("Skipping a chart with an unsupported .xlsb workbook.")
            continue
        # Read or modify supported chart workbook data here.
finally:
    presentation.dispose()
External Workbook
Aspose.Slides supports using external workbooks as a data source for charts.
Create an External Workbook
Use readWorkbookStream and setExternalWorkbook to export an embedded chart workbook to a file and link the chart to that external workbook.
This example creates a pie chart with default data, writes its workbook to externalWorkbook1.xlsx, and completes the file write before assigning the file as the chart data source. It saves the linked presentation to externalWorkbook.pptx.
import jpype
import asposeslides

if not jpype.isJVMStarted():
    jpype.startJVM()

from asposeslides.api import ChartType, Presentation, SaveFormat

from pathlib import Path

presentation = Presentation()
try:
    slide = presentation.getSlides().get_Item(0)

    chart = slide.getShapes().addChart(ChartType.Pie, 50, 50, 400, 600)
    workbook_path = Path("externalWorkbook1.xlsx").resolve()
    workbook_data = chart.getChartData().readWorkbookStream()
    Path(workbook_path).write_bytes(bytes(workbook_data))
    chart.getChartData().setExternalWorkbook(str(workbook_path))

    presentation.save("externalWorkbook.pptx", SaveFormat.Pptx)
finally:
    presentation.dispose()
Set an External Workbook
Using the setExternalWorkbook method, you can assign an external workbook to a chart as its data source. This method can also be used to update a path to the external workbook (if the latter has been moved).
While you cannot edit the data in workbooks stored in remote locations or resources, you can still use such workbooks as an external data source. If the relative path for an external workbook is provided, it gets converted to a full path automatically.
This example requires externalWorkbook.xlsx in the working directory. Its worksheet named Sheet1 must contain a series name in B1, category names in A2:A4, and numeric values in B2:B4. The example creates a pie chart, links the workbook, and uses setRange to map A1:B4 to one series and three categories. It saves the result to Presentation_with_externalWorkbook.pptx.
import jpype
import asposeslides

if not jpype.isJVMStarted():
    jpype.startJVM()

from asposeslides.api import ChartType, Presentation, SaveFormat

from pathlib import Path

presentation = Presentation()
try:
    slide = presentation.getSlides().get_Item(0)

    chart = slide.getShapes().addChart(ChartType.Pie, 50, 50, 400, 600, True)
    chart_data = chart.getChartData()
    workbook_path = str(Path("externalWorkbook.xlsx").resolve())
    chart_data.setExternalWorkbook(workbook_path)
    chart_data.setRange("Sheet1!$A$1:$B$4")

    presentation.save("Presentation_with_externalWorkbook.pptx", SaveFormat.Pptx)
finally:
    presentation.dispose()
The updateChartData parameter of setExternalWorkbook controls whether the workbook is loaded.
- When
updateChartDataisFalse, only the workbook path is updated. The chart data is not loaded or updated from the target workbook, so the workbook can be unavailable. - When
updateChartDataisTrue, the chart data is updated from the target workbook.
The following example assigns a placeholder URL with updateChartData set to False. It retains the pie chart’s default data and saves the presentation without loading the unavailable workbook.
import jpype
import asposeslides

if not jpype.isJVMStarted():
    jpype.startJVM()

from asposeslides.api import ChartType, Presentation, SaveFormat

presentation = Presentation()
try:
    slide = presentation.getSlides().get_Item(0)

    chart = slide.getShapes().addChart(ChartType.Pie, 50, 50, 400, 600, True)
    chart_data = chart.getChartData()
    chart_data.setExternalWorkbook("https://example.com/unavailable-workbook.xlsx", False)

    presentation.save("SetExternalWorkbookWithUpdateChartData.pptx", SaveFormat.Pptx)
finally:
    presentation.dispose()
Get the External Data Source Workbook Path of a Chart
To identify the workbook linked to a chart, first check whether the chart uses an external data source. If it does, you can retrieve the workbook path by following these steps.
- Create an instance of the Presentation class.
- Access the first slide by its zero-based index.
- Check that the first shape is a chart.
- Read the chart data source type.
- If the source is an external workbook, read its path.
This example opens externalWorkbook.pptx, created in the earlier example, and inspects the first shape on the first slide. If it is a chart linked to an external workbook, the example prints getExternalWorkbookPath to the console. It then saves a copy of the presentation to Result.pptx.
import jpype
import asposeslides

if not jpype.isJVMStarted():
    jpype.startJVM()

from asposeslides.api import Chart, ChartDataSourceType, Presentation, SaveFormat

presentation = Presentation("externalWorkbook.pptx")
try:
    slide = presentation.getSlides().get_Item(0)

    shape_count = slide.getShapes().size()
    if shape_count > 0 and isinstance(slide.getShapes().get_Item(0), Chart):
        chart = slide.getShapes().get_Item(0)
        chart_data = chart.getChartData()
        if chart_data.getDataSourceType() == ChartDataSourceType.ExternalWorkbook:
            print(chart_data.getExternalWorkbookPath())
        else:
            print("The chart does not use an external workbook.")
    else:
        print("The first shape is not a chart.")

    presentation.save("Result.pptx", SaveFormat.Pptx)
finally:
    presentation.dispose()
Edit Chart Data
You can edit the data in external workbooks the same way you make changes to the contents of internal workbooks. When an external workbook cannot be loaded, an exception is thrown.
This example requires presentation.pptx with a chart as the first shape on the first slide and an accessible external workbook. It sets the cell-backed value of the first data point in the first series to 100 and saves the presentation to presentation_out.pptx. Editing cell values can update the linked external XLSX file, so use a copy if you need to preserve the original workbook.
import jpype
import asposeslides

if not jpype.isJVMStarted():
    jpype.startJVM()

from asposeslides.api import Chart, Presentation, SaveFormat

presentation = Presentation("presentation.pptx")
try:
    slide = presentation.getSlides().get_Item(0)

    shape_count = slide.getShapes().size()
    if shape_count > 0 and isinstance(slide.getShapes().get_Item(0), Chart):
        chart = slide.getShapes().get_Item(0)
        series = chart.getChartData().getSeries()
        if series.size() > 0 and series.get_Item(0).getDataPoints().size() > 0:
            value_cell = series.get_Item(0).getDataPoints().get_Item(0).getValue().getAsCell()
            if value_cell is not None:
                value_cell.setValue(jpype.JInt(100))
                presentation.save("presentation_out.pptx", SaveFormat.Pptx)
            else:
                print("The first data point is not linked to a workbook cell.")
        else:
            print("The chart has no data points to edit.")
    else:
        print("The first shape is not a chart.")
finally:
    presentation.dispose()
Recover a Workbook from the Chart Cache
If a chart uses an external workbook that is missing or unavailable, Aspose.Slides can reconstruct the chart workbook from the data cached in the presentation. Create LoadOptions, call LoadOptions.setSpreadsheetOptions, and set SpreadsheetOptions.setRecoverWorkbookFromChartCache to True before opening the presentation.
The following Python example opens presentation.pptx, whose first shape on the first slide must be a chart referencing an unavailable external workbook, and accesses the recovered data through Chart.getChartData and ChartData.getChartDataWorkbook:
import jpype
import asposeslides

if not jpype.isJVMStarted():
    jpype.startJVM()

from asposeslides.api import Chart, LoadOptions, Presentation, SpreadsheetOptions

spreadsheet_options = SpreadsheetOptions()
spreadsheet_options.setRecoverWorkbookFromChartCache(True)

load_options = LoadOptions()
load_options.setSpreadsheetOptions(spreadsheet_options)

presentation = Presentation("presentation.pptx", load_options)
try:
    slide = presentation.getSlides().get_Item(0)

    shape_count = slide.getShapes().size()
    if shape_count > 0 and isinstance(slide.getShapes().get_Item(0), Chart):
        chart = slide.getShapes().get_Item(0)
        recovered_workbook = chart.getChartData().getChartDataWorkbook()

        # Read or modify the recovered workbook data here.
    else:
        print("The first shape is not a chart.")
finally:
    presentation.dispose()
If the external workbook is unavailable and recovery is disabled, Aspose.Slides throws an exception. Enable recovery only when using the cached chart data is an acceptable fallback, because the cache may not contain changes made to the external workbook after the presentation was last updated.
FAQ
Can I determine whether a specific chart is linked to an external or an embedded workbook?
Yes. A chart has a data source type and a path to an external workbook; if the source is an external workbook, you can read the full path to make sure an external file is being used.
Are relative paths to external workbooks supported, and how are they stored?
Yes. If you specify a relative path, it is automatically converted to an absolute path. The presentation stores the absolute path in the PPTX file, so moving the workbook may require updating the link.
Can I use workbooks located on network resources/shares?
Yes, such workbooks can be used as an external data source. However, editing remote workbooks directly from Aspose.Slides is not supported—they can only be used as a source.
Does Aspose.Slides overwrite the external XLSX when saving the presentation?
The presentation stores a link to the external file. Editing cell-backed chart data can also update the linked local XLSX file. Use a copy of the workbook if the original must remain unchanged.
What should I do if the external file is password-protected?
Aspose.Slides does not accept a password when linking. A common approach is to remove protection in advance or prepare a decrypted copy (for example, using Aspose.Cells) and link to that copy.
Can multiple charts reference the same external workbook?
Yes. Each chart stores its own link. If they all point to the same file, updating that file will be reflected in each chart the next time the data is loaded.