
ปรับแต่งจุดข้อมูลในแผนภูมิ Treemap และ Sunburst ด้วย JavaScript
บทนำ
ในหมวดอื่นของแผนภูมิ PowerPoint มีประเภท “เชิงลำดับชั้น” สองประเภท คือแผนภูมิ Treemap และ Sunburst (ที่เรียกอีกอย่างว่า Sunburst Graph, Sunburst Diagram, Radial Chart, Radial Graph หรือ Multi Level Pie Chart) แผนภูมิเหล่านี้แสดงข้อมูลเชิงลำดับชั้นที่จัดเรียงเป็นต้นไม้ ตั้งแต่ใบไม้จนถึงยอดกิ่ง ใบไม้ถูกกำหนดโดยจุดข้อมูลของซีรีส์ และแต่ละระดับการจัดกลุ่มซ้อนกันต่อไปถูกกำหนดโดยประเภทที่สอดคล้อง Aspose.Slides for Node.js ผ่าน Java ช่วยให้สามารถจัดรูปแบบจุดข้อมูลของแผนภูมิ Sunburst และ Treemap ด้วย JavaScript ได้
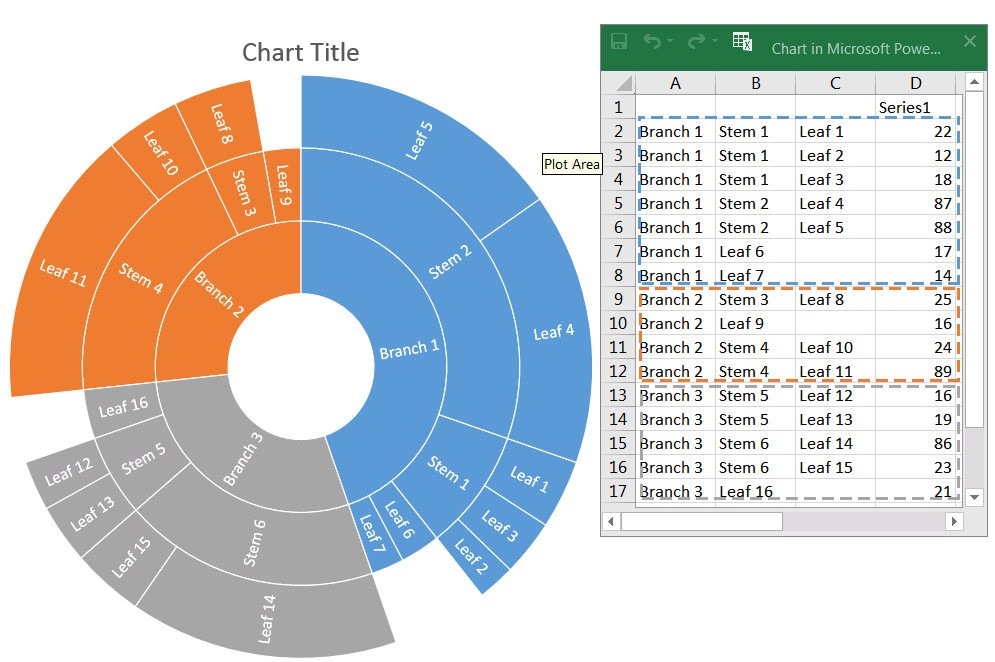
นี่คือแผนภูมิ Sunburst ซึ่งข้อมูลในคอลัมน์ Series1 กำหนดโนด leaf ส่วนคอลัมน์อื่นกำหนดจุดข้อมูลเชิงลำดับชั้น:
เริ่มต้นด้วยการเพิ่มแผนภูมิ Sunburst ใหม่ลงในงานนำเสนอ:
var pres = new aspose.slides.Presentation();
try {
    var chart = pres.getSlides().get_Item(0).getShapes().addChart(aspose.slides.ChartType.Sunburst, 100, 100, 450, 400);
    // ...
} finally {
    if (pres != null) {
        pres.dispose();
    }
}
หากต้องการจัดรูปแบบจุดข้อมูลของแผนภูมิ เราควรใช้สิ่งต่อไปนี้:
ChartDataPointLevelsManager, ChartDataPointLevel classes and ChartDataPoint.getDataPointLevels method provide access to format data points of Treemap and Sunburst charts. ChartDataPointLevelsManager is used for accessing multi-level categories - it represents the container of ChartDataPointLevel objects. Basically it is a wrapper for ChartCategoryLevelsManager with the properties added specific for data points. ChartDataPointLevel class has two methods: getFormat and getDataLabel which provide access to corresponding settings.
แสดงค่าจุดข้อมูล
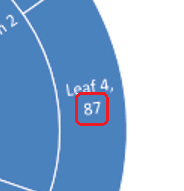
แสดงค่าของจุดข้อมูล “Leaf 4”:
var dataPoints = chart.getChartData().getSeries().get_Item(0).getDataPoints();
dataPoints.get_Item(3).getDataPointLevels().get_Item(0).getLabel().getDataLabelFormat().setShowValue(true);
ตั้งค่าป้ายและสีจุดข้อมูล
ตั้งค่าป้ายข้อมูล “Branch 1” ให้แสดงชื่อซีรีส์ (“Series1”) แทนชื่อประเภท จากนั้นตั้งค่าสีข้อความเป็นสีเหลือง:
var branch1Label = dataPoints.get_Item(0).getDataPointLevels().get_Item(0).getLabel();
branch1Label.getDataLabelFormat().setShowCategoryName(false);
branch1Label.getDataLabelFormat().setShowSeriesName(true);
branch1Label.getDataLabelFormat().getTextFormat().getPortionFormat().getFillFormat().setFillType(java.newByte(aspose.slides.FillType.Solid));
branch1Label.getDataLabelFormat().getTextFormat().getPortionFormat().getFillFormat().getSolidFillColor().setColor(java.getStaticFieldValue("java.awt.Color", "YELLOW"));

ตั้งค่าสีสาขาจุดข้อมูล
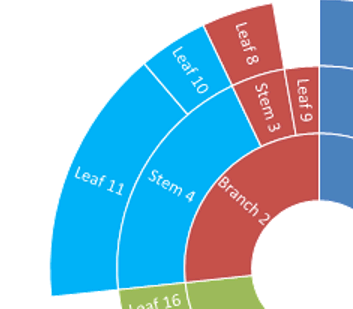
เปลี่ยนสีของสาขา “Steam 4”:
var pres = new aspose.slides.Presentation();
try {
    var chart = pres.getSlides().get_Item(0).getShapes().addChart(aspose.slides.ChartType.Sunburst, 100, 100, 450, 400);
    var dataPoints = chart.getChartData().getSeries().get_Item(0).getDataPoints();
    var stem4branch = dataPoints.get_Item(9).getDataPointLevels().get_Item(1);
    stem4branch.getFormat().getFill().setFillType(java.newByte(aspose.slides.FillType.Solid));
    stem4branch.getFormat().getFill().getSolidFillColor().setColor(java.getStaticFieldValue("java.awt.Color", "RED"));
    pres.save("pres.pptx", aspose.slides.SaveFormat.Pptx);
} finally {
    if (pres != null) {
        pres.dispose();
    }
}
คำถามที่พบบ่อย
Can I change the order (sorting) of segments in Sunburst/Treemap?
No. PowerPoint sorts segments automatically (typically by descending values, clockwise). Aspose.Slides mirrors this behavior: you can’t change the order directly; you achieve it by preprocessing the data.
How does the presentation theme affect the colors of segments and labels?
Chart colors inherit the presentation’s theme/palette unless you explicitly set fills/fonts. For consistent results, lock in solid fills and text formatting at the required levels.
Will export to PDF/PNG preserve custom branch colors and label settings?
Yes. When exporting the presentation, chart settings (fills, labels) are preserved in the output formats because Aspose.Slides renders with the chart’s formatting applied.
Can I compute the actual coordinates of a label/element for custom overlay placement on top of the chart?
Yes. After the chart layout is validated, actual X and actual Y are available for elements (for example, a DataLabel), which helps with precise positioning of overlays.