
Java Kullanarak Sunumlarda Grafik Çalışma Kitaplarını Yönetme
Genel Bakış
Bu makale, Aspose.Slides’ta grafik çalışma kitaplarıyla nasıl çalışılacağını açıklar. Çalışma kitabı akışları aracılığıyla grafik verilerini okuma ve yazma, çalışma kitabı hücrelerini grafik veri etiketleri olarak kullanma, çalışma sayfası koleksiyonlarına erişme ve grafik değerleri için veri kaynağı türünü belirtme yollarını gösterir.
Ayrıca, dış çalışma kitaplarını grafik veri kaynakları olarak kullanmayı da kapsar. Örnekler, dış bir çalışma kitabı oluşturup atamayı, bir grafiğe bağlı dış çalışma kitabının yolunu almayı ve çalışma kitabı kullanılabilir olduğunda grafik verilerini düzenlemeyi gösterir.
Eksik veriyi temsil eden çalışma kitabı hücreleri için boş bir hücre ile sıfır arasındaki farkı ve mevcut gösterim modlarının bir çizgi grafik karşılaştırmasını görmek üzere Boş Hücrelerin Görüntülenmesini Kontrol Et sayfasına bakın.
Gizli Satır ve Sütunlardaki Verileri Dahil Et
Use IChart.setPlotVisibleCellsOnly to control whether a chart plots data from hidden worksheet rows and columns. Set it to true to plot only visible cells, or false to include both visible and hidden cells. This setting controls chart plotting; it does not hide or unhide worksheet rows or columns.
Download hidden-source-data.pptx and place it in the working directory. Its first slide contains a column chart as the first shape. The embedded worksheet, Sheet1, contains the following source range, A1:C4. Row 3 and column C are hidden, but their cells still contain values.
| Çalışma sayfası satırı | A: Ay | B: Perakende | C: Toptan (gizli sütun) |
|---|---|---|---|
| 2 | Ocak | 10 | 30 |
| 3 (gizli satır) | Şubat | 40 | 60 |
| 4 | Mart | 20 | 50 |
Access source cells through IChartData.getChartDataWorkbook and read IChartDataCell.isHidden to inspect their hidden status. This method reports the hidden status without changing it. In this file, B2 is visible, B3 belongs to the hidden row, and C2 belongs to the hidden column; the example prints false, true, and true, respectively.
For this example, refresh the chart data after changing the plotting setting: retain the embedded workbook with readWorkbookStream and reload it with writeWorkbookStream. When including all cells, also use setRange to restore the complete range, including the hidden February category. Simply changing the flag is insufficient to refresh this sample’s cached chart data and category labels.
import com.aspose.slides.*;

Presentation presentation = new Presentation("hidden-source-data.pptx");
try {
    ISlide slide = presentation.getSlides().get_Item(0);

    int shapeCount = slide.getShapes().size();
    if (shapeCount > 0 && slide.getShapes().get_Item(0) instanceof IChart) {
        IChart chart = (IChart) slide.getShapes().get_Item(0);
        IChartDataWorkbook workbook = chart.getChartData().getChartDataWorkbook();
        System.out.println("B2 hidden: " + workbook.getCell(0, "B2").isHidden());
        System.out.println("B3 hidden: " + workbook.getCell(0, "B3").isHidden());
        System.out.println("C2 hidden: " + workbook.getCell(0, "C2").isHidden());

        byte[] workbookData = chart.getChartData().readWorkbookStream();
        for (boolean visibleOnly : new boolean[] { true, false }) {
            chart.setPlotVisibleCellsOnly(visibleOnly);

            // Gömülü çalışma kitabından grafik verilerini yenile.
            chart.getChartData().writeWorkbookStream(workbookData);
            if (!visibleOnly) {
                // Gizli kategoriler dahil olmak üzere tam kaynak aralığını geri yükle.
                chart.getChartData().setRange("Sheet1!$A$1:$C$4");
            }

            presentation.save("hidden_cells_" + visibleOnly + ".pptx", SaveFormat.Pptx);
        }
    } else {
        System.out.println("The first shape is not a chart.");
    }
} finally {
    presentation.dispose();
}
The example saves hidden_cells_true.pptx with only the visible Retail values (10 and 20), and hidden_cells_false.pptx with all six values. The images below illustrate the two plotting modes. Row 3 and column C remain hidden in both embedded workbooks.
Yalnızca görünür hücreler (true) |
Tüm hücreler (false) |
|---|---|
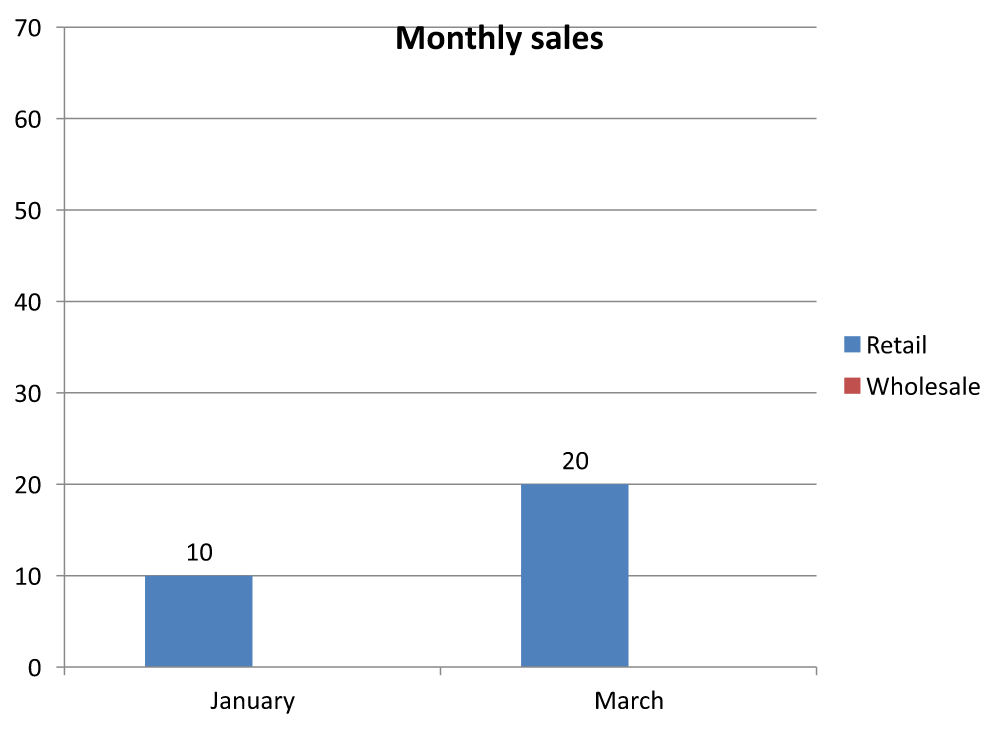 |
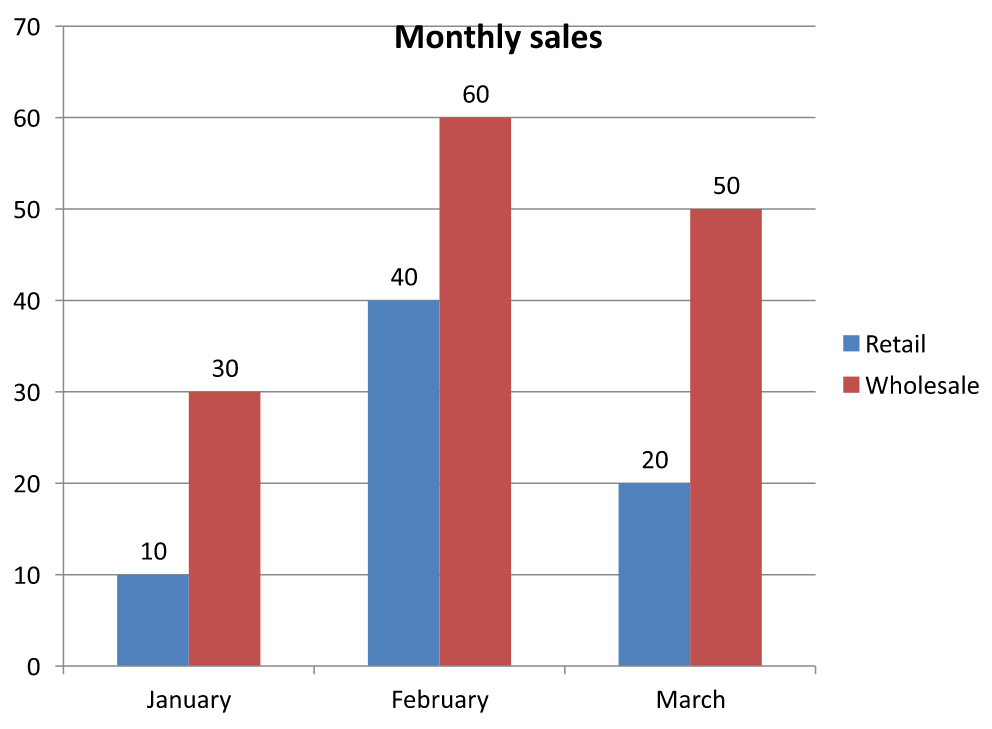 |
A hidden cell containing a value is different from an empty cell. IChart.setDisplayBlanksAs controls how missing values are displayed; it does not include or exclude hidden source data. See Boş Hücrelerin Görüntülenmesini Kontrol Et for an example.
Çalışma Kitaplarından Grafik Verilerini Okuma ve Yazma
Aspose.Slides for Java provides the readWorkbookStream and writeWorkbookStream methods that allow you to read and write chart data workbooks (containing chart data edited with Aspose.Cells). Not that the chart data has to be organized in the same manner or must have a structure similar to the source.
This example opens chart.pptx, which must contain a chart as the first shape on its first slide. It reads the embedded workbook into a byte array, clears the existing series and categories, and writes the same workbook back. The changes remain in memory; the example does not save the presentation.
import com.aspose.slides.*;

Presentation presentation = new Presentation("chart.pptx");
try {
    ISlide slide = presentation.getSlides().get_Item(0);

    int shapeCount = slide.getShapes().size();
    if (shapeCount > 0 && slide.getShapes().get_Item(0) instanceof IChart) {
        IChart chart = (IChart) slide.getShapes().get_Item(0);
        IChartData chartData = chart.getChartData();
        byte[] workbookData = chartData.readWorkbookStream();

        chartData.getSeries().clear();
        chartData.getCategories().clear();

        chartData.writeWorkbookStream(workbookData);
    } else {
        System.out.println("The first shape is not a chart.");
    }
} finally {
    presentation.dispose();
}
Çalışma Kitabı Değiştirildikten Sonra Grafik Düzenini Doğrulama
When you replace an embedded workbook with a modified one, the chart retains its original series and category collections. This mismatch can cause IChart.validateChartLayout to fail with an index-out-of-range error. Clear the existing series and categories before writing the updated workbook back to the chart. This example requires chart.pptx with a chart as the first shape on its first slide. The comment marks where workbook editing would occur; the runnable example writes the original workbook back and validates the layout in memory.
import com.aspose.slides.*;

Presentation presentation = new Presentation("chart.pptx");
try {
    ISlide slide = presentation.getSlides().get_Item(0);

    int shapeCount = slide.getShapes().size();
    if (shapeCount > 0 && slide.getShapes().get_Item(0) instanceof IChart) {
        IChart chart = (IChart) slide.getShapes().get_Item(0);
        IChartData chartData = chart.getChartData();
        byte[] workbookData = chartData.readWorkbookStream();

        // Çalışma kitabı baytlarını burada değiştirin, örneğin Aspose.Cells kullanarak.

        chartData.getSeries().clear();
        chartData.getCategories().clear();

        chartData.writeWorkbookStream(workbookData);
        chart.validateChartLayout();
    } else {
        System.out.println("The first shape is not a chart.");
    }
} finally {
    presentation.dispose();
}
Clearing the collections removes stale data references before the workbook is written back. Rebuild any required series and category mappings for the updated workbook before using the chart.
Bir Çalışma Kitabı Hücresini Grafik Veri Etiketi Olarak Ayarlama
You can use text from workbook cells as chart data labels. The following steps show how to link the labels in a bubble chart to cells in its data workbook.
- Create an instance of the Presentation class.
- Access the first slide by its zero-based index.
- Add a bubble chart with default data.
- Access the chart series.
- Set the workbook cell as a data label.
- Save the presentation.
This example opens chart2.pptx, which must contain at least one slide, and adds a bubble chart with default data. It uses cells A10:A12 on worksheet 0 for the first three labels in the first series, enables labels from cells, and saves the result to resultchart.pptx.
import com.aspose.slides.*;

Presentation presentation = new Presentation("chart2.pptx");
try {
    ISlide slide = presentation.getSlides().get_Item(0);

    IChart chart = slide.getShapes().addChart(ChartType.Bubble, 50, 50, 600, 400, true);
    IChartSeries series = chart.getChartData().getSeries().get_Item(0);
    IChartDataWorkbook workbook = chart.getChartData().getChartDataWorkbook();

    series.getLabels().getDefaultDataLabelFormat().setShowLabelValueFromCell(true);
    series.getLabels().get_Item(0).setValueFromCell(workbook.getCell(0, "A10", "Label 0 cell value"));
    series.getLabels().get_Item(1).setValueFromCell(workbook.getCell(0, "A11", "Label 1 cell value"));
    series.getLabels().get_Item(2).setValueFromCell(workbook.getCell(0, "A12", "Label 2 cell value"));

    presentation.save("resultchart.pptx", SaveFormat.Pptx);
} finally {
    presentation.dispose();
}
Çalışma Sayfalarını Yönetme
The IChartDataWorkbook.getWorksheets method provides access to the worksheets in a chart workbook. This example creates a pie chart with default data and prints each worksheet name to the console.
import com.aspose.slides.*;

Presentation presentation = new Presentation();
try {
    ISlide slide = presentation.getSlides().get_Item(0);

    IChart chart = slide.getShapes().addChart(ChartType.Pie, 50, 50, 400, 500);
    IChartDataWorkbook workbook = chart.getChartData().getChartDataWorkbook();

    for (int i = 0; i < workbook.getWorksheets().size(); i++) {
        System.out.println(workbook.getWorksheets().get_Item(i).getName());
    }
} finally {
    presentation.dispose();
}
Veri Kaynağı Türünü Belirleme
This example creates a 3D column chart with default data and sets two series names using different data sources. The first name uses a string literal; the second uses cell C1 on worksheet 0. The DataSourceType enumeration selects the source for each name. The result is saved to pres.pptx.
import com.aspose.slides.*;

Presentation presentation = new Presentation();
try {
    ISlide slide = presentation.getSlides().get_Item(0);

    IChart chart = slide.getShapes().addChart(ChartType.Column3D, 50, 50, 600, 400, true);
    IStringChartValue literalName = chart.getChartData().getSeries().get_Item(0).getName();

    literalName.setDataSourceType(DataSourceType.StringLiterals);
    literalName.setData("LiteralString");

    IStringChartValue cellName = chart.getChartData().getSeries().get_Item(1).getName();
    IChartDataCell nameCell = chart.getChartData().getChartDataWorkbook().getCell(0, "C1", "NewCell");
    cellName.setDataSourceType(DataSourceType.Worksheet);
    cellName.setData(nameCell);

    presentation.save("pres.pptx", SaveFormat.Pptx);
} finally {
    presentation.dispose();
}
Desteklenmeyen Gömülü Çalışma Kitabı Biçimlerini Algılama
Aspose.Slides does not support the Excel binary workbook (.xlsb) format that can be embedded in some charts. You can use the getEmbeddedWorkbookType method on IChartData together with the WorkbookType enumeration to detect unsupported formats and skip those charts. This example inspects the shapes on the first slide of sample.pptx, skips non-chart shapes, and prints a diagnostic message for each chart with an embedded .xlsb workbook.
import com.aspose.slides.*;

Presentation presentation = new Presentation("sample.pptx");
try {
    ISlide slide = presentation.getSlides().get_Item(0);

    for (IShape shape : slide.getShapes()) {
        if (!(shape instanceof IChart)) {
            continue;
        }

        IChart chart = (IChart) shape;
        IChartData chartData = chart.getChartData();
        boolean isInternalWorkbook = chartData.getDataSourceType() == ChartDataSourceType.InternalWorkbook;
        boolean isBinaryMacro = chartData.getEmbeddedWorkbookType() == WorkbookType.WorkbookBinaryMacro;

        if (isInternalWorkbook && isBinaryMacro) {
            System.out.println("Skipping a chart with an unsupported .xlsb workbook.");
            continue;
        }

        // Desteklenen grafik çalışma kitabı verilerini burada okuyun veya değiştirin.
    }
} finally {
    presentation.dispose();
}
Harici Çalışma Kitabı
Aspose.Slides supports using external workbooks as a data source for charts.
Harici Bir Çalışma Kitabı Oluşturma
Use readWorkbookStream and setExternalWorkbook to export an embedded chart workbook to a file and link the chart to that external workbook.
This example creates a pie chart with default data, writes its workbook to externalWorkbook1.xlsx, and completes the file write before assigning the file as the chart data source. It saves the linked presentation to externalWorkbook.pptx.
import com.aspose.slides.*;
import java.io.IOException;
import java.nio.file.Files;
import java.nio.file.Path;
import java.nio.file.Paths;

Presentation presentation = new Presentation();
try {
    ISlide slide = presentation.getSlides().get_Item(0);

    IChart chart = slide.getShapes().addChart(ChartType.Pie, 50, 50, 400, 600);
    Path workbookPath = Paths.get("externalWorkbook1.xlsx").toAbsolutePath();
    byte[] workbookData = chart.getChartData().readWorkbookStream();
    try {
        Files.write(workbookPath, workbookData);
        chart.getChartData().setExternalWorkbook(workbookPath.toString());
        presentation.save("externalWorkbook.pptx", SaveFormat.Pptx);
    } catch (IOException exception) {
        System.out.println("Could not write the external workbook: " + exception.getMessage());
    }
} finally {
    presentation.dispose();
}
Harici Bir Çalışma Kitabı Atama
Using the setExternalWorkbook method, you can assign an external workbook to a chart as its data source. This method can also be used to update a path to the external workbook (if the latter has been moved).
While you cannot edit the data in workbooks stored in remote locations or resources, you can still use such workbooks as an external data source. If the relative path for an external workbook is provided, it gets converted to a full path automatically.
This example requires externalWorkbook.xlsx in the working directory. Its worksheet named Sheet1 must contain a series name in B1, category names in A2:A4, and numeric values in B2:B4. The example creates a pie chart, links the workbook, and uses setRange to map A1:B4 to one series and three categories. It saves the result to Presentation_with_externalWorkbook.pptx.
import com.aspose.slides.*;
import java.nio.file.Paths;

Presentation presentation = new Presentation();
try {
    ISlide slide = presentation.getSlides().get_Item(0);

    IChart chart = slide.getShapes().addChart(ChartType.Pie, 50, 50, 400, 600, true);
    IChartData chartData = chart.getChartData();
    String workbookPath = Paths.get("externalWorkbook.xlsx").toAbsolutePath().toString();

    chartData.setExternalWorkbook(workbookPath);
    chartData.setRange("Sheet1!$A$1:$B$4");

    presentation.save("Presentation_with_externalWorkbook.pptx", SaveFormat.Pptx);
} finally {
    presentation.dispose();
}
The updateChartData parameter of setExternalWorkbook controls whether the workbook is loaded.
- When
updateChartDataisfalse, only the workbook path is updated. The chart data is not loaded or updated from the target workbook, so the workbook can be unavailable. - When
updateChartDataistrue, the chart data is updated from the target workbook.
The following example assigns a placeholder URL with updateChartData set to false. It retains the pie chart’s default data and saves the presentation without loading the unavailable workbook.
import com.aspose.slides.*;

Presentation presentation = new Presentation();
try {
    ISlide slide = presentation.getSlides().get_Item(0);

    IChart chart = slide.getShapes().addChart(ChartType.Pie, 50, 50, 400, 600, true);
    chart.getChartData().setExternalWorkbook("https://example.com/unavailable-workbook.xlsx", false);

    presentation.save("SetExternalWorkbookWithUpdateChartData.pptx", SaveFormat.Pptx);
} finally {
    presentation.dispose();
}
Bir Grafiğin Harici Veri Kaynağı Çalışma Kitabı Yolunu Alma
To identify the workbook linked to a chart, first check whether the chart uses an external data source. If it does, you can retrieve the workbook path by following these steps.
- Create an instance of the Presentation class.
- Access the first slide by its zero-based index.
- Check that the first shape is a chart.
- Read the chart data source type.
- If the source is an external workbook, read its path.
This example opens externalWorkbook.pptx, created in the earlier example, and inspects the first shape on the first slide. If it is a chart linked to an external workbook, the example prints getExternalWorkbookPath to the console. It then saves a copy of the presentation to Result.pptx.
import com.aspose.slides.*;

Presentation presentation = new Presentation("externalWorkbook.pptx");
try {
    ISlide slide = presentation.getSlides().get_Item(0);

    if (slide.getShapes().size() > 0 && slide.getShapes().get_Item(0) instanceof IChart) {
        IChart chart = (IChart) slide.getShapes().get_Item(0);
        IChartData chartData = chart.getChartData();
        if (chartData.getDataSourceType() == ChartDataSourceType.ExternalWorkbook) {
            System.out.println(chartData.getExternalWorkbookPath());
        } else {
            System.out.println("The chart does not use an external workbook.");
        }
    } else {
        System.out.println("The first shape is not a chart.");
    }

    presentation.save("Result.pptx", SaveFormat.Pptx);
} finally {
    presentation.dispose();
}
Grafik Verilerini Düzenleme
You can edit the data in external workbooks the same way you make changes to the contents of internal workbooks. When an external workbook cannot be loaded, an exception is thrown.
This example requires presentation.pptx with a chart as the first shape on the first slide and an accessible external workbook. It sets the cell-backed value of the first data point in the first series to 100 and saves the presentation to presentation_out.pptx. Editing cell values can update the linked external XLSX file, so use a copy if you need to preserve the original workbook.
import com.aspose.slides.*;

Presentation presentation = new Presentation("presentation.pptx");
try {
    ISlide slide = presentation.getSlides().get_Item(0);

    int shapeCount = slide.getShapes().size();
    if (shapeCount > 0 && slide.getShapes().get_Item(0) instanceof IChart) {
        IChart chart = (IChart) slide.getShapes().get_Item(0);
        IChartSeriesCollection series = chart.getChartData().getSeries();
        if (series.size() > 0 && series.get_Item(0).getDataPoints().size() > 0) {
            IChartDataCell valueCell = series.get_Item(0).getDataPoints().get_Item(0).getValue().getAsCell();
            if (valueCell != null) {
                valueCell.setValue(100);
                presentation.save("presentation_out.pptx", SaveFormat.Pptx);
            } else {
                System.out.println("The first data point is not linked to a workbook cell.");
            }
        } else {
            System.out.println("The chart has no data points to edit.");
        }
    } else {
        System.out.println("The first shape is not a chart.");
    }
} finally {
    presentation.dispose();
}
Grafik Önbelleğinden Çalışma Kitabını Kurtarma
If a chart uses an external workbook that is missing or unavailable, Aspose.Slides can reconstruct the chart workbook from the data cached in the presentation. Create LoadOptions, call LoadOptions.setSpreadsheetOptions, and set ISpreadsheetOptions.setRecoverWorkbookFromChartCache to true before opening the presentation.
The following Java example opens presentation.pptx, whose first shape on the first slide must be a chart referencing an unavailable external workbook, and accesses the recovered data through IChart.getChartData and IChartData.getChartDataWorkbook:
import com.aspose.slides.*;

SpreadsheetOptions spreadsheetOptions = new SpreadsheetOptions();
spreadsheetOptions.setRecoverWorkbookFromChartCache(true);

LoadOptions loadOptions = new LoadOptions();
loadOptions.setSpreadsheetOptions(spreadsheetOptions);

Presentation presentation = new Presentation("presentation.pptx", loadOptions);
try {
    ISlide slide = presentation.getSlides().get_Item(0);

    int shapeCount = slide.getShapes().size();
    if (shapeCount > 0 && slide.getShapes().get_Item(0) instanceof IChart) {
        IChart chart = (IChart) slide.getShapes().get_Item(0);
        IChartDataWorkbook recoveredWorkbook = chart.getChartData().getChartDataWorkbook();

        // Kurtarılan çalışma kitabı verilerini burada okuyun veya değiştirin.
    } else {
        System.out.println("The first shape is not a chart.");
    }
} finally {
    presentation.dispose();
}
If the external workbook is unavailable and recovery is disabled, Aspose.Slides throws an exception. Enable recovery only when using the cached chart data is an acceptable fallback, because the cache may not contain changes made to the external workbook after the presentation was last updated.
SSS
Belirli bir grafiğin harici bir çalışma kitabına mı yoksa gömülü bir çalışma kitabına mı bağlı olduğunu belirleyebilir miyim?
Evet. Bir grafiğin veri kaynağı türü ve harici çalışma kitabı yolu vardır; kaynak harici bir çalışma kitabıysa, tam yolu okuyarak dış bir dosyanın kullanıldığını doğrulayabilirsiniz.
Harici çalışma kitapları için göreli yollar destekleniyor mu ve nasıl depolanıyor?
Evet. Göreli bir yol belirtirseniz, otomatik olarak mutlak yola dönüştürülür. Sunum, mutlak yolu PPTX dosyasında saklar, bu nedenle çalışma kitabını taşımak bağlantının güncellenmesini gerektirebilir.
Ağ kaynakları/paylaşımları üzerindeki çalışma kitaplarını kullanabilir miyim?
Evet, bu tür çalışma kitapları harici veri kaynağı olarak kullanılabilir. Ancak, uzak çalışma kitaplarını Aspose.Slides ile doğrudan düzenlemek desteklenmez; yalnızca kaynak olarak kullanılabilirler.
Sunumu kaydederken Aspose.Slides harici XLSX dosyasını üzerine yazıyor mu?
Sunum, dış dosyaya bir bağlantı saklar. Hücre tabanlı grafik verilerini düzenlemek, bağlanılan yerel XLSX dosyasını da güncelleyebilir. Orijinalinin değişmemesi gerekiyorsa çalışma kitabının bir kopyasını kullanın.
Harici dosya şifre korumalıysa ne yapmalıyım?
Aspose.Slides, bağlanırken şifre kabul etmez. Yaygın bir yaklaşım, şifreyi önceden kaldırmak veya bir şifre çözülmüş kopya (ör. Aspose.Cells) hazırlayıp ona bağlanmaktır.
Birden çok grafik aynı harici çalışma kitabına başvurabilir mi?
Evet. Her grafik kendi bağlantısını saklar. Hepsi aynı dosyaya işaret ediyorsa, dosya güncellendiğinde her grafik bir sonraki veri yüklemesinde bu değişikliği yansıtır.