
使用 Python 在演示文稿中自定义 3D 图表
概述
Aspose.Slides for Python via .NET 允许您通过 Chart.rotation_3d 属性自定义 3D 图表的视图。本文演示如何调整旋转、高度比例、深度、直角坐标轴以及系列之间的间距,然后将演示文稿保存为 PPTX 格式。
设置 3D 图表的旋转和深度
下面的示例创建一个 Presentation 并使用 ShapeCollection.add_chart 在其第一张幻灯片上添加一个堆叠的 3D 柱形图。它用两个每个包含三个值的系列替换默认的系列和类别。工作表索引 0 标识图表的第一个数据工作表;行 0 保存系列名称,列 0 保存类别标签。
rotation_x 和 rotation_y 属性分别将图表的旋转设置为 40 度和 270 度。depth_percents 将其深度设置为宽度的 150%,而 right_angle_axes 启用直角坐标轴而非透视。生成的演示文稿包含具有这些 3D 视图设置的填充图表。
import aspose.slides as slides
import aspose.slides.charts as charts

with slides.Presentation() as presentation:
    slide = presentation.slides[0]

    chart = slide.shapes.add_chart(charts.ChartType.STACKED_COLUMN_3D, 0, 0, 500, 500)

    chart.chart_data.series.clear()
    chart.chart_data.categories.clear()

    workbook = chart.chart_data.chart_data_workbook
    worksheet_index = 0

    values = [[20, 50, 30], [30, 10, 60]]

    for category_index in range(3):
        category_cell = workbook.get_cell(worksheet_index, category_index + 1, 0, f"Category {category_index + 1}")
        chart.chart_data.categories.add(category_cell)

    for series_index in range(2):
        series_cell = workbook.get_cell(worksheet_index, 0, series_index + 1, f"Series {series_index + 1}")
        series = chart.chart_data.series.add(series_cell, chart.type)

        for category_index in range(3):
            value_cell = workbook.get_cell(worksheet_index, category_index + 1, series_index + 1, values[series_index][category_index])
            series.data_points.add_data_point_for_bar_series(value_cell)

    chart.rotation_3d.right_angle_axes = True
    chart.rotation_3d.rotation_x = 40
    chart.rotation_3d.rotation_y = 270
    chart.rotation_3d.depth_percents = 150

    presentation.save("Rotation3D_out.pptx", slides.export.SaveFormat.PPTX)
调整 3D 图表的高度比例
使用 Rotation3D.height_percents 将 3D 图表的高度设置为其宽度的百分比。这会在不改变幻灯片上图表对象尺寸的情况下更改 3D 场景的比例。
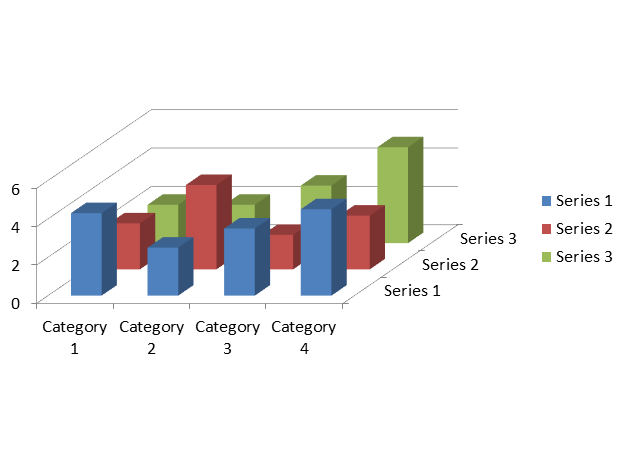
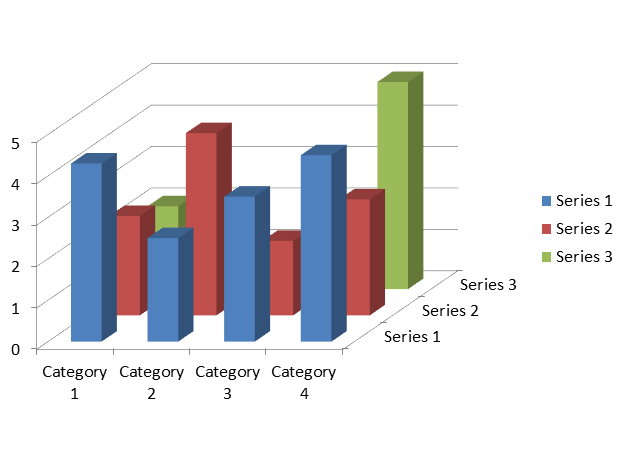
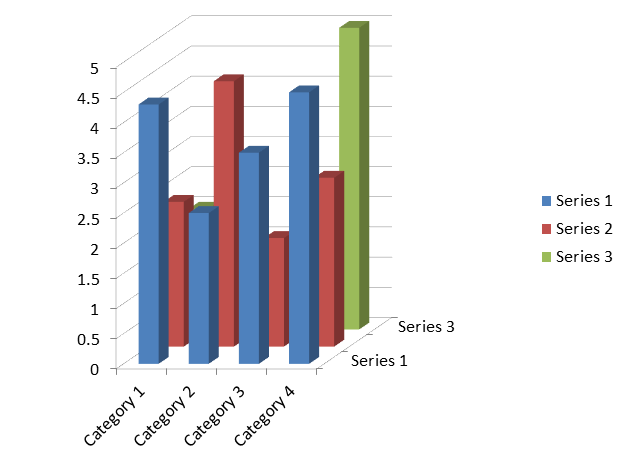
下面的示例创建一个 COLUMN_3D 图表,使用默认数据:三系列和四类别。它保存三个演示文稿,分别使用 50%、100% 和 200% 的高度比例。图表的位置、宽度和高度保持不变。数据、旋转、深度、系列间距和格式在所有文件中均相同,仅高度百分比不同。
import aspose.slides as slides
import aspose.slides.charts as charts

with slides.Presentation() as presentation:
    slide = presentation.slides[0]

    chart = slide.shapes.add_chart(charts.ChartType.COLUMN_3D, 40, 30, 620, 460)
    chart.rotation_3d.rotation_x = 20
    chart.rotation_3d.rotation_y = 30
    chart.rotation_3d.right_angle_axes = True
    chart.rotation_3d.depth_percents = 100
    chart.chart_data.series[0].parent_series_group.gap_depth = 150

    for height_percent in (50, 100, 200):
        chart.rotation_3d.height_percents = height_percent
        presentation.save(f"chart_height_{height_percent}.pptx", slides.export.SaveFormat.PPTX)
以下图像是使用 Microsoft PowerPoint 从生成的演示文稿导出的。较小的百分比产生更平坦的场景,而较大的百分比在相同的图表对象内产生更高的场景。PowerPoint 可能还会调整坐标轴刻度间隔和标签位置以适应场景。
| 高度: 50% | 高度: 100% | 高度: 200% |
|---|---|---|
 |
 |
 |
这些属性控制图表的不同方面:
| 属性 | 效果 |
|---|---|
| Rotation3D.height_percents | 3D 场景的高度,占其宽度的百分比。 |
| Chart.height | 幻灯片上图表对象的高度,单位为点。 |
| Rotation3D.depth_percents | 3D 场景的深度,占其宽度的百分比。 |
| ChartSeriesGroup.gap_depth | 系列沿深度轴的间距,占标记宽度的百分比。 |
高度设置影响 3D 柱形和条形图,包括圆柱体、圆锥体和金字塔变体,以及 3D 折线、面积、饼图和曲面图。上述比较使用经验证的 COLUMN_3D 类型。此设置不会改变 2D CLUSTERED_COLUMN 图表或 BUBBLE_WITH_3D 图表的外观;这些名称是 ChartType 枚举的成员。有关其他图表外观设置,请参阅 Chart Formatting。
调整系列之间的间隔
使用 ChartSeriesGroup.gap_depth 控制 3D 图表中数据系列沿深度轴的距离,表示为标记宽度的百分比。使用 0 到 500(含)的值:0 移除间隔,较大的值增加间距。图表深度固定时,增大间隔会使标记在深度轴上更纤细。
通过 ChartSeries.parent_series_group 访问该组。此设置适用于该组中的每个系列,而不仅仅是用于访问它的系列。ChartSeries.gap_depth 为只读,反映父组的设置。
此设置影响 3D 柱形和条形图,包括其圆柱体、圆锥体和金字塔变体,以及 3D 折线和面积图。外观取决于系列是按深度、聚类还是堆叠排列。若要清晰比较不同系列之间的间隔,请使用来自 ChartType 枚举的 ChartType.COLUMN_3D。
这些属性控制图表的不同方面:
| 属性 | 效果 |
|---|---|
| ChartSeriesGroup.gap_depth | 系列沿深度轴的间距,占标记宽度的百分比。 |
| ChartSeriesGroup.gap_width | 相邻条形或柱形簇之间的间距,占条形或柱形宽度的百分比。 |
| Rotation3D.depth_percents | 整体图表深度,占图表宽度的百分比。 |
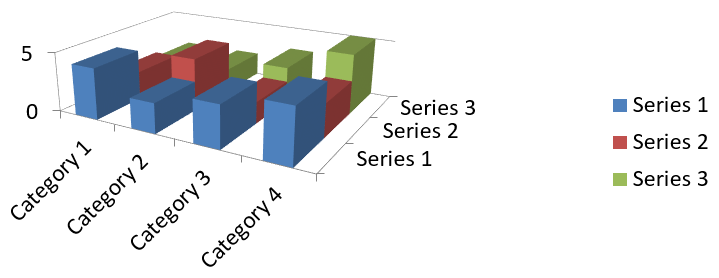
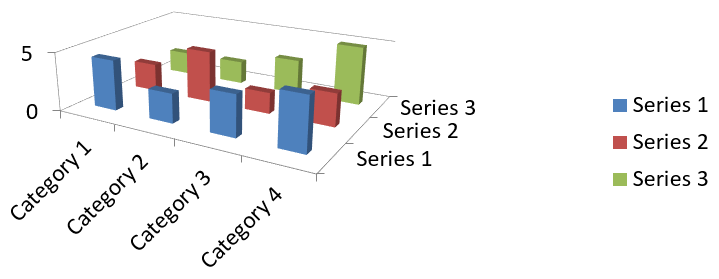
下面的示例使用默认图表数据,包含三系列和四类别。它保存两个演示文稿,数据、旋转、间隔宽度和图表深度完全相同,仅间隔深度不同。
import aspose.slides as slides
import aspose.slides.charts as charts

with slides.Presentation() as presentation:
    slide = presentation.slides[0]

    chart = slide.shapes.add_chart(charts.ChartType.COLUMN_3D, 40, 30, 620, 230)

    chart.rotation_3d.rotation_x = 20
    chart.rotation_3d.rotation_y = 30
    chart.rotation_3d.depth_percents = 100

    series = chart.chart_data.series[0]
    group = series.parent_series_group
    group.gap_width = 150

    for gap_depth in (0, 500):
        group.gap_depth = gap_depth
        file_name = f"series_gap_depth_{gap_depth}.pptx"
        presentation.save(file_name, slides.export.SaveFormat.PPTX)
以下图像是使用 Microsoft PowerPoint 从生成的演示文稿导出的。
| 间隔深度: 0% | 间隔深度: 500% |
|---|---|
 |
 |
更改 3D 系列类型和条形形状
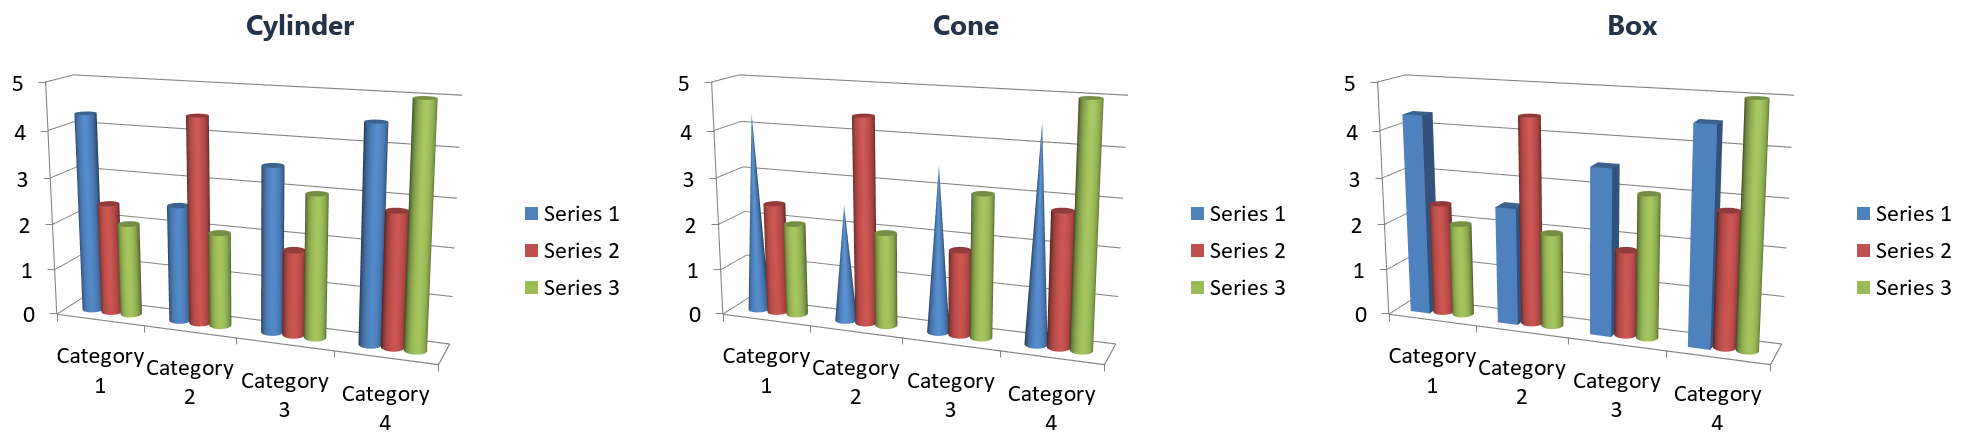
在聚类圆柱体图表中,第一系列从圆柱形条开始。示例在每次更改前后读取 ChartSeries.type 和 ChartSeries.bar_3d_shape。
import aspose.slides as slides
import aspose.slides.charts as charts

with slides.Presentation() as presentation:
    slide = presentation.slides[0]

    chart = slide.shapes.add_chart(charts.ChartType.CLUSTERED_CYLINDER, 20, 20, 500, 300)
    series = chart.chart_data.series[0]

    print(f"{series.type.name} | {series.bar_3d_shape.name}")

    series.type = charts.ChartType.CLUSTERED_CONE
    print(f"{series.type.name} | {series.bar_3d_shape.name}")

    series.bar_3d_shape = charts.ChartShapeType.BOX
    print(f"{series.type.name} | {series.bar_3d_shape.name}")

    presentation.save("series_shape.pptx", slides.export.SaveFormat.PPTX)
| 更改第一系列 | type |
bar_3d_shape |
|---|---|---|
| 创建图表 | CLUSTERED_CYLINDER |
CYLINDER |
将 type 设置为 CLUSTERED_CONE |
CLUSTERED_CONE |
CONE |
将 bar_3d_shape 设置为 BOX |
CLUSTERED_COLUMN_3D |
BOX |
将形状设置为 BOX 还会将系列类型更改为 CLUSTERED_COLUMN_3D。如果代码根据系列类型分支,请在更改形状后读取 series.type。在赋值前缓存的值仍会选择 CLUSTERED_CONE 分支。
FAQ
哪些图表类型在 Aspose.Slides 中支持 3D 模式?
Aspose.Slides 支持柱形图的 3D 变体,包括 Column 3D、Clustered Column 3D、Stacked Column 3D 和 100% Stacked Column 3D,以及通过 ChartType 枚举公开的相关 3D 类型。要获取精确且最新的列表,请在已安装版本的 API 参考中查看 ChartType 成员。
我可以获得 3D 图表的栅格图像用于报告或网页吗?
可以。您可以使用 Shape.get_image 将图表导出为图像,或使用 render the entire slide 导出为 PNG、JPEG 等格式。当需要栅格预览或将在文档、仪表板或网页中嵌入图表且不希望依赖 PowerPoint 时,这非常有用。
构建和渲染大型 3D 图表的性能如何?
性能取决于数据量和视觉复杂度。为获得最佳结果,请尽量减少 3D 效果,避免在墙面和绘图区使用大型纹理,尽可能限制每个系列的数据点数量,并将渲染输出的分辨率和尺寸设定为匹配目标显示或打印需求的合适大小。