Adding Custom Labels to Data Points in the Series of the Chart
Contents
[
Hide
]
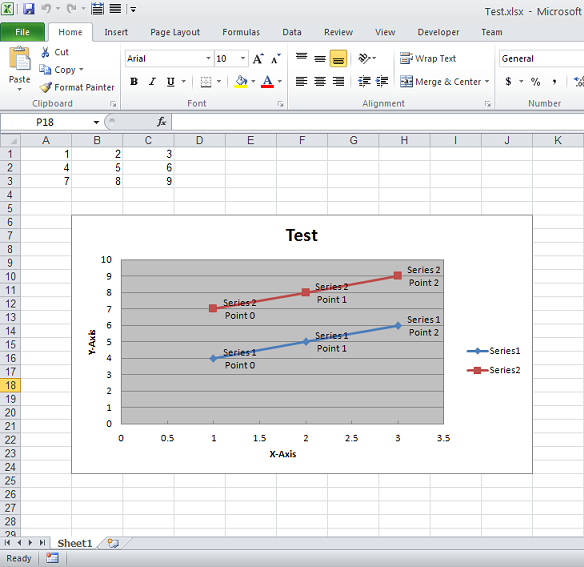
You can add custom labels to data points in the series of the chart. Aspose.Cells provides ChartPoint.getDataLabels().setText() property to add these custom labels. This article will explain how to use this property to add custom labels to data points in the series of the chart.
Adding Custom Labels to Data Points in the Series of the Chart
The following code creates Scatter Chart Connected By Lines With Data Markers and then adds Custom Labels to the Data Points in the Series of the Chart. Each custom label shows Series Name and Point Name. You can use any other text instead of it. After the execution of the code, the following Excel file is created. As you can see inside the Chart, each DataPoint has Custom Label set.
This file contains hidden or bidirectional Unicode text that may be interpreted or compiled differently than what appears below. To review, open the file in an editor that reveals hidden Unicode characters.
Learn more about bidirectional Unicode characters
| // For complete examples and data files, please go to https://github.com/aspose-cells/Aspose.Cells-for-Java | |
| // The path to the documents directory. | |
| String dataDir = Utils.getDataDir(AddCustomLabelsToDataPoints.class); | |
| Workbook workbook = new Workbook(FileFormatType.XLSX); | |
| Worksheet sheet = workbook.getWorksheets().get(0); | |
| // Put data | |
| sheet.getCells().get(0, 0).putValue(1); | |
| sheet.getCells().get(0, 1).putValue(2); | |
| sheet.getCells().get(0, 2).putValue(3); | |
| sheet.getCells().get(1, 0).putValue(4); | |
| sheet.getCells().get(1, 1).putValue(5); | |
| sheet.getCells().get(1, 2).putValue(6); | |
| sheet.getCells().get(2, 0).putValue(7); | |
| sheet.getCells().get(2, 1).putValue(8); | |
| sheet.getCells().get(2, 2).putValue(9); | |
| // Generate the chart | |
| int chartIndex = sheet.getCharts().add(ChartType.SCATTER_CONNECTED_BY_LINES_WITH_DATA_MARKER, 5, 1, 24, 10); | |
| Chart chart = sheet.getCharts().get(chartIndex); | |
| chart.getTitle().setText("Test"); | |
| chart.getCategoryAxis().getTitle().setText("X-Axis"); | |
| chart.getValueAxis().getTitle().setText("Y-Axis"); | |
| chart.getNSeries().setCategoryData("A1:C1"); | |
| // Insert series | |
| chart.getNSeries().add("A2:C2", false); | |
| Series series = chart.getNSeries().get(0); | |
| int pointCount = series.getPoints().getCount(); | |
| for (int i = 0; i < pointCount; i++) { | |
| ChartPoint pointIndex = series.getPoints().get(i); | |
| pointIndex.getDataLabels().setText("Series 1" + "\n" + "Point " + i); | |
| } | |
| // Insert series | |
| chart.getNSeries().add("A3:C3", false); | |
| series = chart.getNSeries().get(1); | |
| pointCount = series.getPoints().getCount(); | |
| for (int i = 0; i < pointCount; i++) { | |
| ChartPoint pointIndex = series.getPoints().get(i); | |
| pointIndex.getDataLabels().setText("Series 2" + "\n" + "Point " + i); | |
| } | |
| workbook.save(dataDir + "Test.xlsx", SaveFormat.XLSX); |