
Diagramme in Präsentationen formatieren in C++
Übersicht
Dieser Artikel erklärt, wie Diagramme in PowerPoint‑Präsentationen mit Aspose.Slides formatiert werden. Er zeigt, wie wichtige Diagrammelemente wie Achsen, Gitternetzlinien, Titel, Legenden, der Plot‑Bereich und Wandfüllungen angepasst werden können, um das Aussehen und die Lesbarkeit von Diagrammdaten zu verbessern.
Er demonstriert zudem, wie Schriftarteigenschaften für Diagramm‑Text festgelegt, vordefinierte Zahlenformate auf Diagrammdaten angewendet und abgerundete Ecken für den Diagrammbereich aktiviert werden. Zusammen zeigen diese Beispiele, wie sowohl der visuelle Stil als auch die Datenpräsentation von Diagrammen in einer Präsentation gesteuert werden können.
Diagramm‑Entitäten formatieren
Verwenden Sie IChart, um Diagrammtitel, Achsen, Gitternetzlinien, Legenden und den Plot‑Bereich zu formatieren. Dieses Beispiel erstellt ein Liniendiagramm mit Markern und Standarddaten und wendet dann getrennte Text‑ und Linienstile auf seine Werte‑ und Kategorien‑Achsen an. Schriftgrößen und Linienstärken werden in Punkten angegeben; Kategorien‑Beschriftungen werden um 45 Grad gedreht.
Die Werte‑Achse verwendet get_NumberFormat unabhängig von den Quellzellen. Ihr Maßstab reicht von –2 bis 15, mit Hauptintervallen von 2 und Nebenintervallen von 0,5. Das Beispiel kombiniert Prozentformatierung mit get_DisplayUnit auf Tausend, passen Sie diese Einstellungen also an die Bedeutung und Größenordnung Ihrer Daten an. Die Legende bleibt außerhalb des Plot‑Bereichs, weil get_Overlay deaktiviert ist. Rückwand‑ und Bodengrundfüllungen werden über get_BackWall und get_Floor konfiguriert, diese Flächen sind jedoch nur in 3D‑Diagrammen sichtbar.
#include <system/shared_ptr.h>
#include <DOM/Presentation.h>
#include <DOM/ISlide.h>
#include <DOM/IShapeCollection.h>
#include <DOM/IChart.h>
#include <Export/SaveFormat.h>
#include <DOM/Chart/ChartType.h>
#include <DOM/Chart/IChartTextFormat.h>
#include <DOM/Chart/IChartPortionFormat.h>
#include <DOM/IPortionFormat.h>
#include <drawing/color.h>
#include <DOM/FillType.h>
#include <DOM/NullableBool.h>
#include <DOM/LineDashStyle.h>
#include <DOM/Fonts/FontData.h>
#include <DOM/IFillFormat.h>
#include <DOM/IColorFormat.h>
#include <DOM/ILineFormat.h>
#include <DOM/ILineFillFormat.h>
#include <DOM/ITextFrame.h>
#include <DOM/IParagraphCollection.h>
#include <DOM/IParagraph.h>
#include <DOM/IPortionCollection.h>
#include <DOM/IPortion.h>
#include <DOM/Chart/IAxesManager.h>
#include <DOM/Chart/IAxis.h>
#include <DOM/Chart/IChartLinesFormat.h>
#include <DOM/Chart/IChartTitle.h>
#include <DOM/Chart/IFormat.h>
#include <DOM/Chart/DisplayUnitType.h>
#include <DOM/Chart/TickLabelPositionType.h>
#include <DOM/Chart/ILegend.h>
#include <DOM/Chart/IChartWall.h>
#include <DOM/Chart/IChartPlotArea.h>

using namespace Aspose::Slides;
using namespace Aspose::Slides::Charts;
using namespace Aspose::Slides::Export;

auto presentation = System::MakeObject<Presentation>();
auto slide = presentation->get_Slide(0);

auto chart = slide->get_Shapes()->AddChart(ChartType::LineWithMarkers, 50, 50, 500, 400);

chart->set_HasTitle(true);
chart->get_ChartTitle()->AddTextFrameForOverriding(u"");
auto chartTitle = chart->get_ChartTitle()->get_TextFrameForOverriding()->get_Paragraphs()->idx_get(0)->get_Portions()->idx_get(0);
chartTitle->set_Text(u"Sample Chart");
chartTitle->get_PortionFormat()->get_FillFormat()->set_FillType(FillType::Solid);
chartTitle->get_PortionFormat()->get_FillFormat()->get_SolidFillColor()->set_Color(System::Drawing::Color::get_Gray());
chartTitle->get_PortionFormat()->set_FontHeight(20);
chartTitle->get_PortionFormat()->set_FontBold(NullableBool::True);
chartTitle->get_PortionFormat()->set_FontItalic(NullableBool::True);

chart->get_Axes()->get_VerticalAxis()->get_MajorGridLinesFormat()->get_Line()->get_FillFormat()->set_FillType(FillType::Solid);
chart->get_Axes()->get_VerticalAxis()->get_MajorGridLinesFormat()->get_Line()->get_FillFormat()->get_SolidFillColor()->set_Color(System::Drawing::Color::get_Blue());
chart->get_Axes()->get_VerticalAxis()->get_MajorGridLinesFormat()->get_Line()->set_Width(5);
chart->get_Axes()->get_VerticalAxis()->get_MajorGridLinesFormat()->get_Line()->set_DashStyle(LineDashStyle::DashDot);

chart->get_Axes()->get_VerticalAxis()->get_MinorGridLinesFormat()->get_Line()->get_FillFormat()->set_FillType(FillType::Solid);
chart->get_Axes()->get_VerticalAxis()->get_MinorGridLinesFormat()->get_Line()->get_FillFormat()->get_SolidFillColor()->set_Color(System::Drawing::Color::get_Red());
chart->get_Axes()->get_VerticalAxis()->get_MinorGridLinesFormat()->get_Line()->set_Width(3);

chart->get_Axes()->get_VerticalAxis()->set_IsNumberFormatLinkedToSource(false);
chart->get_Axes()->get_VerticalAxis()->set_DisplayUnit(DisplayUnitType::Thousands);
chart->get_Axes()->get_VerticalAxis()->set_NumberFormat(u"0.0%");

chart->get_Axes()->get_VerticalAxis()->set_IsAutomaticMajorUnit(false);
chart->get_Axes()->get_VerticalAxis()->set_IsAutomaticMaxValue(false);
chart->get_Axes()->get_VerticalAxis()->set_IsAutomaticMinorUnit(false);
chart->get_Axes()->get_VerticalAxis()->set_IsAutomaticMinValue(false);

chart->get_Axes()->get_VerticalAxis()->set_MaxValue(15.0f);
chart->get_Axes()->get_VerticalAxis()->set_MinValue(-2.0f);
chart->get_Axes()->get_VerticalAxis()->set_MinorUnit(0.5f);
chart->get_Axes()->get_VerticalAxis()->set_MajorUnit(2.0f);

auto valueAxisText = chart->get_Axes()->get_VerticalAxis()->get_TextFormat()->get_PortionFormat();
valueAxisText->set_FontBold(NullableBool::True);
valueAxisText->set_FontHeight(16);
valueAxisText->set_FontItalic(NullableBool::True);
valueAxisText->get_FillFormat()->set_FillType(FillType::Solid);
valueAxisText->get_FillFormat()->get_SolidFillColor()->set_Color(System::Drawing::Color::get_DarkGreen());
auto valueAxisFont = System::MakeObject<FontData>(u"Times New Roman");
valueAxisText->set_LatinFont(valueAxisFont);

chart->get_Axes()->get_VerticalAxis()->set_HasTitle(true);
chart->get_Axes()->get_VerticalAxis()->get_Title()->AddTextFrameForOverriding(u"");
auto valueAxisTitle = chart->get_Axes()->get_VerticalAxis()->get_Title()->get_TextFrameForOverriding()->get_Paragraphs()->idx_get(0)->get_Portions()->idx_get(0);
valueAxisTitle->set_Text(u"Primary Axis");
valueAxisTitle->get_PortionFormat()->get_FillFormat()->set_FillType(FillType::Solid);
valueAxisTitle->get_PortionFormat()->get_FillFormat()->get_SolidFillColor()->set_Color(System::Drawing::Color::get_Gray());
valueAxisTitle->get_PortionFormat()->set_FontHeight(20);
valueAxisTitle->get_PortionFormat()->set_FontBold(NullableBool::True);
valueAxisTitle->get_PortionFormat()->set_FontItalic(NullableBool::True);

chart->get_Axes()->get_HorizontalAxis()->get_MajorGridLinesFormat()->get_Line()->get_FillFormat()->set_FillType(FillType::Solid);
chart->get_Axes()->get_HorizontalAxis()->get_MajorGridLinesFormat()->get_Line()->get_FillFormat()->get_SolidFillColor()->set_Color(System::Drawing::Color::get_Green());
chart->get_Axes()->get_HorizontalAxis()->get_MajorGridLinesFormat()->get_Line()->set_Width(5);

chart->get_Axes()->get_HorizontalAxis()->get_MinorGridLinesFormat()->get_Line()->get_FillFormat()->set_FillType(FillType::Solid);
chart->get_Axes()->get_HorizontalAxis()->get_MinorGridLinesFormat()->get_Line()->get_FillFormat()->get_SolidFillColor()->set_Color(System::Drawing::Color::get_Yellow());
chart->get_Axes()->get_HorizontalAxis()->get_MinorGridLinesFormat()->get_Line()->set_Width(3);

auto categoryAxisText = chart->get_Axes()->get_HorizontalAxis()->get_TextFormat()->get_PortionFormat();
categoryAxisText->set_FontBold(NullableBool::True);
categoryAxisText->set_FontHeight(16);
categoryAxisText->set_FontItalic(NullableBool::True);
categoryAxisText->get_FillFormat()->set_FillType(FillType::Solid);
categoryAxisText->get_FillFormat()->get_SolidFillColor()->set_Color(System::Drawing::Color::get_Blue());
auto categoryAxisFont = System::MakeObject<FontData>(u"Arial");
categoryAxisText->set_LatinFont(categoryAxisFont);

chart->get_Axes()->get_HorizontalAxis()->set_HasTitle(true);
chart->get_Axes()->get_HorizontalAxis()->get_Title()->AddTextFrameForOverriding(u"");

auto categoryAxisTitle = chart->get_Axes()->get_HorizontalAxis()->get_Title()->get_TextFrameForOverriding()->get_Paragraphs()->idx_get(0)->get_Portions()->idx_get(0);
categoryAxisTitle->set_Text(u"Sample Category");
categoryAxisTitle->get_PortionFormat()->get_FillFormat()->set_FillType(FillType::Solid);
categoryAxisTitle->get_PortionFormat()->get_FillFormat()->get_SolidFillColor()->set_Color(System::Drawing::Color::get_Gray());
categoryAxisTitle->get_PortionFormat()->set_FontHeight(20);
categoryAxisTitle->get_PortionFormat()->set_FontBold(NullableBool::True);
categoryAxisTitle->get_PortionFormat()->set_FontItalic(NullableBool::True);

chart->get_Axes()->get_HorizontalAxis()->set_TickLabelPosition(TickLabelPositionType::Low);
chart->get_Axes()->get_HorizontalAxis()->set_TickLabelRotationAngle(45);

auto legendText = chart->get_Legend()->get_TextFormat()->get_PortionFormat();
legendText->set_FontBold(NullableBool::True);
legendText->set_FontHeight(16);
legendText->set_FontItalic(NullableBool::True);
legendText->get_FillFormat()->set_FillType(FillType::Solid);
legendText->get_FillFormat()->get_SolidFillColor()->set_Color(System::Drawing::Color::get_DarkRed());

chart->get_Legend()->set_Overlay(false);

chart->get_BackWall()->set_Thickness(1);
chart->get_BackWall()->get_Format()->get_Fill()->set_FillType(FillType::Solid);
chart->get_BackWall()->get_Format()->get_Fill()->get_SolidFillColor()->set_Color(System::Drawing::Color::get_Orange());

chart->get_Floor()->get_Format()->get_Fill()->set_FillType(FillType::Solid);
chart->get_Floor()->get_Format()->get_Fill()->get_SolidFillColor()->set_Color(System::Drawing::Color::get_Red());

chart->get_PlotArea()->get_Format()->get_Fill()->set_FillType(FillType::Solid);
chart->get_PlotArea()->get_Format()->get_Fill()->get_SolidFillColor()->set_Color(System::Drawing::Color::get_LightCyan());

presentation->Save(u"FormattedChart_out.pptx", SaveFormat::Pptx);
Schriftart‑Eigenschaften für ein Diagramm festlegen
Setzen Sie die Standardschriftgröße für Diagramm‑Text über Chart::get_TextFormat. Das Beispiel erstellt ein gruppiertes Säulendiagramm mit einer 20‑Punkt‑Schrift und aktiviert Wert‑Beschriftungen für die erste Serie über set_ShowValue. Textelemente mit eigenen expliziten Schriftarteinstellungen können den Diagramm‑Standard überschreiben.
#include <system/shared_ptr.h>
#include <DOM/Presentation.h>
#include <DOM/ISlide.h>
#include <DOM/IShapeCollection.h>
#include <DOM/IChart.h>
#include <Export/SaveFormat.h>
#include <DOM/Chart/ChartType.h>
#include <DOM/Chart/IChartTextFormat.h>
#include <DOM/Chart/IChartPortionFormat.h>
#include <DOM/IPortionFormat.h>
#include <DOM/Chart/IChartData.h>
#include <DOM/Chart/IChartSeriesCollection.h>
#include <DOM/Chart/IChartSeries.h>
#include <DOM/Chart/IDataLabelCollection.h>
#include <DOM/Chart/IDataLabelFormat.h>

using namespace Aspose::Slides;
using namespace Aspose::Slides::Charts;
using namespace Aspose::Slides::Export;

auto presentation = System::MakeObject<Presentation>();
auto slide = presentation->get_Slide(0);

auto chart = slide->get_Shapes()->AddChart(ChartType::ClusteredColumn, 100, 100, 500, 400);
chart->get_TextFormat()->get_PortionFormat()->set_FontHeight(20);
chart->get_ChartData()->get_Series()->idx_get(0)->get_Labels()->get_DefaultDataLabelFormat()->set_ShowValue(true);

presentation->Save(u"FontPropertiesForChart.pptx", SaveFormat::Pptx);
Numerisches Format festlegen
Verwenden Sie IChartDataCell::set_PresetNumberFormat, um ein integriertes Zahlenformat auf Diagramm‑Arbeitsmappenzellen anzuwenden. Dieses Beispiel erstellt ein gruppiertes Säulendiagramm mit Standard‑, zellgebundenen Daten und wendet Format‑Index 10 (0.00%) auf jede Serienwert‑Zelle an. Dadurch ändert sich die Anzeige der Werte in der Arbeitsmappe, ohne die zugrunde liegenden Zahlen zu verändern; zum Beispiel wird 0,25 als 25,00 % dargestellt. Achsen‑ und Daten‑Beschriftungsformate können separat konfiguriert werden.
#include <system/shared_ptr.h>
#include <DOM/Presentation.h>
#include <DOM/ISlide.h>
#include <DOM/IShapeCollection.h>
#include <DOM/IChart.h>
#include <Export/SaveFormat.h>
#include <DOM/Chart/ChartType.h>
#include <DOM/Chart/IChartTextFormat.h>
#include <DOM/Chart/IChartPortionFormat.h>
#include <DOM/IPortionFormat.h>
#include <DOM/Chart/IChartData.h>
#include <DOM/Chart/IChartSeriesCollection.h>
#include <DOM/Chart/IChartSeries.h>
#include <DOM/Chart/IChartDataPointCollection.h>
#include <DOM/Chart/IChartDataPoint.h>
#include <DOM/Chart/IDoubleChartValue.h>
#include <DOM/Chart/IChartDataCell.h>

using namespace Aspose::Slides;
using namespace Aspose::Slides::Charts;
using namespace Aspose::Slides::Export;

auto presentation = System::MakeObject<Presentation>();
auto slide = presentation->get_Slide(0);

auto chart = slide->get_Shapes()->AddChart(ChartType::ClusteredColumn, 50, 50, 500, 400);
auto series = chart->get_ChartData()->get_Series();

for (auto chartSeries : series)
{
    for (auto dataPoint : chartSeries->get_DataPoints())
    {
        dataPoint->get_Value()->get_AsCell()->set_PresetNumberFormat(10); // 0.00%
    }
}

presentation->Save(u"PresetNumberFormat_out.pptx", SaveFormat::Pptx);
Die folgende Tabelle listet integrierte Zahlenformat‑Indizes mit repräsentativen Excel‑Formaten für die englische (Vereinigte Staaten) Lokale auf. Die genauen Formatzeichenfolgen und deren Anzeige können je nach Anwendung und Locale variieren, insbesondere bei Währung und Datum. Einige Excel‑Formate weichen zudem von den Vorgaben des OOXML‑Standards ab, wie in den Microsoft’s number format implementation notes beschrieben.
| Index | Format |
|---|---|
| 0 | General |
| 1 | 0 |
| 2 | 0.00 |
| 3 | #,##0 |
| 4 | #,##0.00 |
| 5 | "$"#,##0_);("$"#,##0) |
| 6 | "$"#,##0_);[Red]("$"#,##0) |
| 7 | "$"#,##0.00_);("$"#,##0.00) |
| 8 | "$"#,##0.00_);[Red]("$"#,##0.00) |
| 9 | 0% |
| 10 | 0.00% |
| 11 | 0.00E+00 |
| 12 | # ?/? |
| 13 | # ??/?? |
| 14 | m/d/yyyy |
| 15 | d-mmm-yy |
| 16 | d-mmm |
| 17 | mmm-yy |
| 18 | h:mm AM/PM |
| 19 | h:mm:ss AM/PM |
| 20 | h:mm |
| 21 | h:mm:ss |
| 22 | m/d/yyyy h:mm |
| 37 | #,##0_);(#,##0) |
| 38 | #,##0_);[Red](#,##0) |
| 39 | #,##0.00_);(#,##0.00) |
| 40 | #,##0.00_);[Red](#,##0.00) |
| 41 | _(* #,##0_);_(* (#,##0);_(* "-"_);_(@_) |
| 42 | _("$"* #,##0_);_("$"* (#,##0);_("$"* "-"_);_(@_) |
| 43 | _(* #,##0.00_);_(* (#,##0.00);_(* "-"??_);_(@_) |
| 44 | _("$"* #,##0.00_);_("$"* (#,##0.00);_("$"* "-"??_);_(@_) |
| 45 | mm:ss |
| 46 | [h]:mm:ss |
| 47 | mm:ss.0 |
| 48 | ##0.0E+0 |
| 49 | @ |
Abgerundete Ränder im Diagrammbereich festlegen
Aktivieren Sie IChart::set_HasRoundedCorners, um die Ecken des Diagrammbereichs abzurunden. Das Beispiel erstellt ein gruppiertes Säulendiagramm und verwendet get_LineFormat, um seiner Kontur eine einheitliche graue Farbe und einen ein‑Zug‑Stil zu geben, bevor die Präsentation gespeichert wird.
#include <system/shared_ptr.h>
#include <DOM/Presentation.h>
#include <DOM/ISlide.h>
#include <DOM/IShapeCollection.h>
#include <DOM/IChart.h>
#include <Export/SaveFormat.h>
#include <DOM/Chart/ChartType.h>
#include <DOM/Chart/IChartTextFormat.h>
#include <DOM/Chart/IChartPortionFormat.h>
#include <DOM/IPortionFormat.h>
#include <drawing/color.h>
#include <DOM/FillType.h>
#include <DOM/LineStyle.h>
#include <DOM/ILineFormat.h>
#include <DOM/ILineFillFormat.h>
#include <DOM/IColorFormat.h>

using namespace Aspose::Slides;
using namespace Aspose::Slides::Charts;
using namespace Aspose::Slides::Export;

auto presentation = System::MakeObject<Presentation>();
auto slide = presentation->get_Slide(0);

auto chart = slide->get_Shapes()->AddChart(ChartType::ClusteredColumn, 20, 100, 600, 400);
chart->get_LineFormat()->get_FillFormat()->set_FillType(FillType::Solid);
chart->get_LineFormat()->get_FillFormat()->get_SolidFillColor()->set_Color(System::Drawing::Color::get_Gray());
chart->get_LineFormat()->set_Style(LineStyle::Single);
chart->set_HasRoundedCorners(true);

presentation->Save(u"out.pptx", SaveFormat::Pptx);
Vorhandene Diagramm‑Anmerkungen bearbeiten
Ein Diagramm kann benutzerdefinierte Formen enthalten, etwa eine Text‑Anmerkung, die den Status eines Berichts erklärt. Greifen Sie über IChart::get_UserShapes darauf zu, auch aufgeführt unter Chart::get_UserShapes in der Chart‑API‑Referenz. Seine get_Shapes‑Sammlung enthält die zum Diagramm gehörenden Formen.
Ein gewöhnliches Textfeld, das über einem Diagramm platziert ist, gehört zur Folie, selbst wenn es wie Teil des Diagramms aussieht. Das Durchlaufen von Slide::get_Shapes findet das Diagramm und die normalen Folienformen, enumeriert jedoch nicht die einzelnen Formen innerhalb des Diagramms. Diagrammtitel und Datenbeschriftungen sind separate Diagrammelemente, keine benutzerdefinierten Anmerkungen in dieser Sammlung.
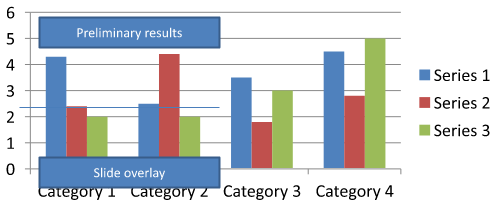
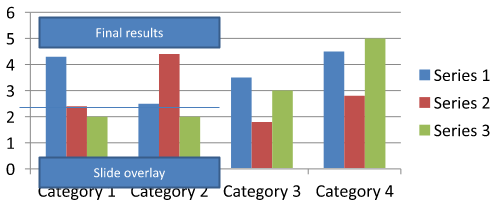
Laden Sie chart-annotations.pptx herunter und platzieren Sie die Datei im Arbeitsverzeichnis der Anwendung. Die erste Folie enthält ein Diagramm mit einer nicht gruppierten Anmerkung „Preliminary results“, einer zum Diagramm gehörenden Linie und einem normalen Folientextfeld „Slide overlay“. Das Beispiel findet das erste Diagramm auf dieser Folie und ändert die Anmerkung zu „Final results“, sobald der Bericht veröffentlicht werden soll. Es prüft, ob die Sammlung leer ist, und bearbeitet nur ein IAutoShape mit einem nicht‑null‑get_TextFrame und dem erwarteten Text.
#include <system/shared_ptr.h>
#include <DOM/Presentation.h>
#include <DOM/ISlide.h>
#include <DOM/IShapeCollection.h>
#include <DOM/IChart.h>
#include <Export/SaveFormat.h>
#include <system/console.h>
#include <DOM/IGroupShape.h>
#include <DOM/IAutoShape.h>
#include <DOM/ITextFrame.h>

using namespace Aspose::Slides;
using namespace Aspose::Slides::Charts;
using namespace Aspose::Slides::Export;

auto presentation = System::MakeObject<Presentation>(u"chart-annotations.pptx");
auto slide = presentation->get_Slide(0);

System::SharedPtr<IChart> chart;
for (auto shape : slide->get_Shapes())
{
    auto candidate = System::DynamicCast<IChart>(shape);
    if (candidate != nullptr)
    {
        chart = candidate;
        break;
    }
}

if (chart == nullptr || chart->get_UserShapes()->get_Shapes()->get_Count() == 0)
{
    System::Console::WriteLine(u"No chart or chart-owned shapes found.");
    return;
}

auto updated = false;
for (auto shape : chart->get_UserShapes()->get_Shapes())
{
    auto annotation = System::DynamicCast<IAutoShape>(shape);
    if (annotation != nullptr &&
        annotation->get_TextFrame() != nullptr &&
        annotation->get_TextFrame()->get_Text() == u"Preliminary results")
    {
        annotation->get_TextFrame()->set_Text(u"Final results");
        updated = true;
        break;
    }
}

if (updated)
{
    presentation->Save(u"chart-annotations-updated.pptx", SaveFormat::Pptx);
}
else
{
    System::Console::WriteLine(u"No matching text annotation found.");
}
Die Linie und das Folientextfeld bleiben unverändert. Die folgenden Bilder zeigen die Eingabe und das gespeicherte, erneut geöffnete Ergebnis:
| Vor der Bearbeitung | Nach der Bearbeitung |
|---|---|
 |
 |
Note
Das Beispiel prüft nur die obersten, zum Diagramm gehörenden Formen. Befindet sich eine Anmerkung innerhalb einer IGroupShape, muss auch die get_Shapes‑Sammlung dieser Gruppe untersucht werden. Wiederholen Sie diesen Vorgang rekursiv für verschachtelte Gruppen und wenden Sie dieselben Textprüfungen auf deren Kindformen an. Eine Gruppe selbst ist ein Container; behandeln Sie sie nicht wie ein Textfeld.FAQ
Kann ich halbtransparente Füllungen für Säulen/Flächen festlegen, während die Kontur undurchsichtig bleibt?
Ja. Füllungs‑Transparenz und Kontur werden separat konfiguriert. Dies ist nützlich, um die Lesbarkeit des Gitternetzes und der Daten in dichten Visualisierungen zu verbessern.
Wie kann ich mit Datenbeschriftungen umgehen, wenn sie überlappen?
Reduzieren Sie die Schriftgröße, deaktivieren Sie nicht wesentliche Beschriftungskomponenten (z. B. Kategorien), passen Sie die Beschriftungsposition an, zeigen Sie Beschriftungen nur für ausgewählte Punkte an oder wechseln Sie das Format zu „Wert + Legende“.
Kann ich Farbverläufe oder Musterfüllungen auf Serien anwenden?
Ja. Serien unterstützen einfarbige, Verlauf‑ und Musterfüllungen. Verwenden Sie Verläufe sparsam und vermeiden Sie Kombinationen, die den Kontrast zum Gitternetz und zum Text verringern.