
Customize Chart Axes in Presentations Using JavaScript
Overview
This article explains how to customize chart axes with Aspose.Slides for Node.js via Java. It covers calculated axis values, switching chart rows and columns, axis visibility, category label and tick-mark intervals, date categories and formatting, title rotation, axis positioning, display units, and logarithmic scaling.
Get the Max Values on the Vertical Axis on Charts
Create a Presentation and add an area chart with default data. Call validateChartLayout before reading calculated axis values so that the chart layout is up to date.
Read getActualMaxValue and getActualMinValue for the axis limits, and getActualMajorUnit and getActualMinorUnit for the tick intervals. getActualMajorUnitScale and getActualMinorUnitScale provide time-unit scales, which are relevant to date axes. The example stores these values in local variables and saves the chart.
var aspose = aspose || {};
aspose.slides = require("aspose.slides.via.java");

var presentation = new aspose.slides.Presentation();
try {
    var slide = presentation.getSlides().get_Item(0);

    var chart = slide.getShapes().addChart(aspose.slides.ChartType.Area, 100, 100, 500, 350);
    chart.validateChartLayout();

    var maxValue = chart.getAxes().getVerticalAxis().getActualMaxValue();
    var minValue = chart.getAxes().getVerticalAxis().getActualMinValue();

    var majorUnit = chart.getAxes().getVerticalAxis().getActualMajorUnit();
    var minorUnit = chart.getAxes().getVerticalAxis().getActualMinorUnit();

    var majorUnitScale = chart.getAxes().getVerticalAxis().getActualMajorUnitScale();
    var minorUnitScale = chart.getAxes().getVerticalAxis().getActualMinorUnitScale();

    presentation.save("AxisValues_out.pptx", aspose.slides.SaveFormat.Pptx);
} finally {
    presentation.dispose();
}
Swap the Data between Axes
Use switchRowColumn to exchange the roles of series and categories in chart data. Each former category becomes a series, and each former series becomes a category. This changes how the data is grouped; it does not exchange the horizontal and vertical axes. The example uses setRange to bind the default data to Sheet1!A1:D5, including the header row and category column, before switching rows and columns. It saves a chart with four series and three categories.
var aspose = aspose || {};
aspose.slides = require("aspose.slides.via.java");

var presentation = new aspose.slides.Presentation();
try {
    var slide = presentation.getSlides().get_Item(0);

    var chart = slide.getShapes().addChart(aspose.slides.ChartType.ClusteredColumn, 100, 100, 400, 300);
    chart.getChartData().setRange("Sheet1!A1:D5");
    chart.getChartData().switchRowColumn();

    presentation.save("SwitchChartRowColumns_out.pptx", aspose.slides.SaveFormat.Pptx);
} finally {
    presentation.dispose();
}
Disable the Vertical Axis for Line Charts
Call setVisible with false on the vertical axis to hide it. The example creates a line chart with default data and saves it with the vertical axis hidden.
var aspose = aspose || {};
aspose.slides = require("aspose.slides.via.java");

var presentation = new aspose.slides.Presentation();
try {
    var slide = presentation.getSlides().get_Item(0);

    var chart = slide.getShapes().addChart(aspose.slides.ChartType.Line, 100, 100, 400, 300);
    chart.getAxes().getVerticalAxis().setVisible(false);

    presentation.save("HiddenVerticalAxis.pptx", aspose.slides.SaveFormat.Pptx);
} finally {
    presentation.dispose();
}
Disable the Horizontal Axis for Line Charts
Call setVisible with false on the horizontal axis to hide it. The example creates a line chart with default data and saves it with the horizontal axis hidden.
var aspose = aspose || {};
aspose.slides = require("aspose.slides.via.java");

var presentation = new aspose.slides.Presentation();
try {
    var slide = presentation.getSlides().get_Item(0);

    var chart = slide.getShapes().addChart(aspose.slides.ChartType.Line, 100, 100, 400, 300);
    chart.getAxes().getHorizontalAxis().setVisible(false);

    presentation.save("HiddenHorizontalAxis.pptx", aspose.slides.SaveFormat.Pptx);
} finally {
    presentation.dispose();
}
Change a Category Axis
Use setCategoryAxisType to choose a date or text category axis. This example requires ExistingChart.pptx, with a chart as the first shape on the first slide and category cells containing numeric Excel date values. It changes the horizontal axis to a date axis. Calling setAutomaticMajorUnit with false, setMajorUnit with 1, and setMajorUnitScale with TimeUnitType.Months places major ticks at one-month intervals.
var aspose = aspose || {};
aspose.slides = require("aspose.slides.via.java");

var presentation = new aspose.slides.Presentation("ExistingChart.pptx");
try {
    var slide = presentation.getSlides().get_Item(0);

    var chart = slide.getShapes().get_Item(0);
    chart.getAxes().getHorizontalAxis().setCategoryAxisType(aspose.slides.CategoryAxisType.Date);
    chart.getAxes().getHorizontalAxis().setAutomaticMajorUnit(false);
    chart.getAxes().getHorizontalAxis().setMajorUnit(1);
    chart.getAxes().getHorizontalAxis().setMajorUnitScale(aspose.slides.TimeUnitType.Months);

    presentation.save("ChangeChartCategoryAxis_out.pptx", aspose.slides.SaveFormat.Pptx);
} finally {
    presentation.dispose();
}
Control Category Axis Label Intervals
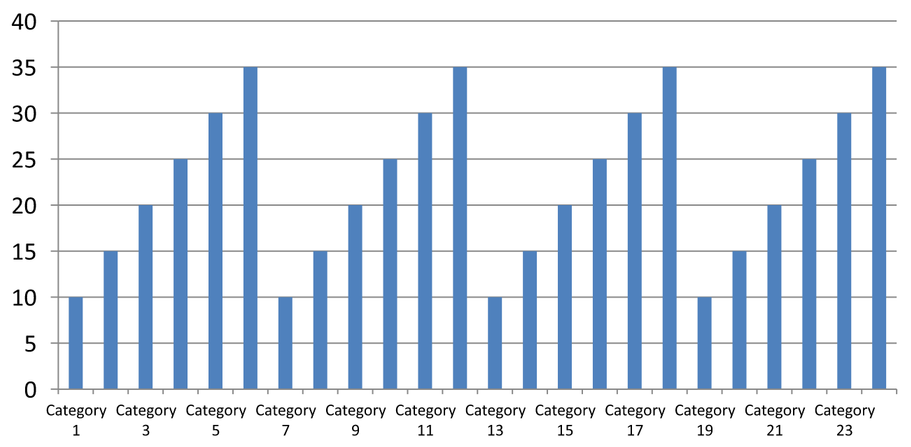
When a chart has many categories, reduce the number of visible axis labels without removing categories or data points. Call setAutomaticTickLabelSpacing with false, then pass the desired category interval to setTickLabelSpacing. For text categories in their normal order, counting starts at the first category:
| Interval | Labels displayed in the example |
|---|---|
1 |
Category 1, Category 2, Category 3, … Category 24 |
2 |
Category 1, Category 3, Category 5, … Category 23 |
3 |
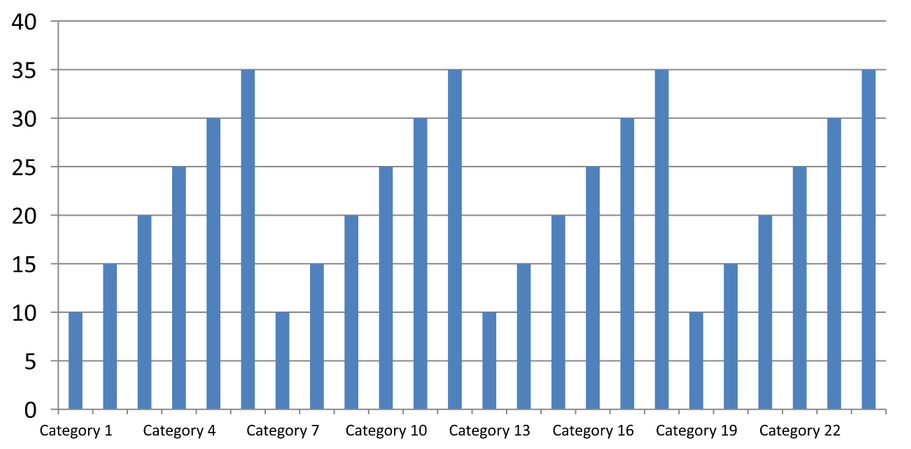
Category 1, Category 4, Category 7, … Category 22 |
An interval of 3 displays every third label, leaving two labels hidden between displayed labels. It does not remove the corresponding columns. Automatic spacing chooses an interval based on the available space; it does not necessarily display every label.
Tick marks have separate controls. Call setAutomaticTickMarksSpacing with false and use setTickMarksSpacing to set their interval. For example, 1 keeps a tick mark at every category interval while labels appear only every third category. Use setMajorTickMark with a visible style so you can see the result. Calling either automatic-spacing setter with true again lets the chart choose that interval again.
The following self-contained example creates 24 categories and one series, then saves three slides in CategoryAxisIntervals.pptx: automatic spacing, manual label spacing with independent tick marks, and restored automatic spacing. The two copies retain the original chart data. No input presentation is required. Horizontal label text makes the difference in density easy to see.
var aspose = aspose || {};
aspose.slides = require("aspose.slides.via.java");

var presentation = new aspose.slides.Presentation();
try {
    var slide = presentation.getSlides().get_Item(0);

    var chart = slide.getShapes().addChart(aspose.slides.ChartType.ClusteredColumn, 30, 40, 660, 320);

    chart.setLegend(false);
    chart.getChartData().getCategories().clear();
    chart.getChartData().getSeries().clear();

    var workbook = chart.getChartData().getChartDataWorkbook();
    workbook.clear(0);

    var series = chart.getChartData().getSeries().add(aspose.slides.ChartType.ClusteredColumn);
    for (var i = 0; i < 24; i++) {
        var categoryCell = workbook.getCell(0, i + 1, 0, "Category " + (i + 1));
        chart.getChartData().getCategories().add(categoryCell);
        var valueCell = workbook.getCell(0, i + 1, 1, 10 + i % 6 * 5);
        series.getDataPoints().addDataPointForBarSeries(valueCell);
    }

    var axis = chart.getAxes().getHorizontalAxis();
    axis.setCategoryAxisType(aspose.slides.CategoryAxisType.Text);
    axis.getTextFormat().getTextBlockFormat().setRotationAngle(0);
    axis.getTextFormat().getPortionFormat().setFontHeight(12);
    axis.setMajorTickMark(aspose.slides.TickMarkType.Outside);
    axis.setAutomaticTickLabelSpacing(true);
    axis.setAutomaticTickMarksSpacing(true);

    // Slide 2: show every third label, but keep a tick mark for every category.
    var manualSlide = presentation.getSlides().addClone(slide);
    var manualChart = manualSlide.getShapes().get_Item(0);
    var manualAxis = manualChart.getAxes().getHorizontalAxis();
    manualAxis.setAutomaticTickLabelSpacing(false);
    manualAxis.setTickLabelSpacing(3);
    manualAxis.setAutomaticTickMarksSpacing(false);
    manualAxis.setTickMarksSpacing(1);

    // Slide 3: let the chart choose both intervals again.
    var restoredSlide = presentation.getSlides().addClone(manualSlide);
    var restoredChart = restoredSlide.getShapes().get_Item(0);
    restoredChart.getAxes().getHorizontalAxis().setAutomaticTickLabelSpacing(true);
    restoredChart.getAxes().getHorizontalAxis().setAutomaticTickMarksSpacing(true);

    presentation.save("CategoryAxisIntervals.pptx", aspose.slides.SaveFormat.Pptx);
} finally {
    presentation.dispose();
}
Automatic spacing (slide 1): In this rendering, every second category label is displayed and wraps onto two lines. The automatic result can vary with chart size, fonts, and the renderer.
Manual spacing (slide 2): Every third label is displayed on one line, while tick marks remain at every category interval. All 24 columns, including those without labels, remain visible with the same values. Slide 3 restores the automatic appearance shown above.
Choose the Correct Axis and Interval
Use this category-count interval for a text category axis, such as the category axis of a column, line, area, or bar chart. In a column chart, it is the horizontal axis. In a horizontal bar chart, the category axis is vertical, so apply these settings to the axis returned by getVerticalAxis. Tick-mark spacing also applies to a series axis in charts that have one.
Do not use category label spacing to set the numeric scale of a value axis. On a value axis, setMajorUnit specifies a difference in values: for example, a major unit of 10 produces ticks at 0, 10, 20, and so on when the axis starts at zero. A category label interval of 3 instead counts category positions, regardless of their data values. Scatter and bubble charts use value axes rather than a text category axis. For a date axis, use time-based major units and scales as described in Change a Category Axis.
Set the Date Format for Category Axis Values
The example replaces the default chart data with four annual values. Dates are stored as OLE Automation serial numbers in the first worksheet (index 0), calculated as the number of days since December 30, 1899, for these dates. The JavaScript calculation uses UTC timestamps and divides the difference by 86,400,000 milliseconds per day. Use setCategoryAxisType with CategoryAxisType.Date, call setNumberFormatLinkedToSource with false, and pass yyyy to setNumberFormat so the category labels display four-digit years independently of the cell formatting.
var aspose = aspose || {};
aspose.slides = require("aspose.slides.via.java");

var presentation = new aspose.slides.Presentation();
try {
    var slide = presentation.getSlides().get_Item(0);

    var chart = slide.getShapes().addChart(aspose.slides.ChartType.Line, 50, 50, 450, 300);

    chart.getChartData().getCategories().clear();
    chart.getChartData().getSeries().clear();

    var workbook = chart.getChartData().getChartDataWorkbook();
    workbook.clear(0);

    var baseDate = Date.UTC(1899, 11, 30);

    var series = chart.getChartData().getSeries().add(aspose.slides.ChartType.Line);
    for (var i = 0; i < 4; i++) {
        var date = Date.UTC(2015 + i, 0, 1);
        var categoryCell = workbook.getCell(0, i + 1, 0, (date - baseDate) / 86400000);
        chart.getChartData().getCategories().add(categoryCell);

        var valueCell = workbook.getCell(0, i + 1, 1, i + 1);
        series.getDataPoints().addDataPointForLineSeries(valueCell);
    }

    chart.getAxes().getHorizontalAxis().setCategoryAxisType(aspose.slides.CategoryAxisType.Date);
    chart.getAxes().getHorizontalAxis().setNumberFormatLinkedToSource(false);
    chart.getAxes().getHorizontalAxis().setNumberFormat("yyyy");

    presentation.save("DateAxisFormat.pptx", aspose.slides.SaveFormat.Pptx);
} finally {
    presentation.dispose();
}
Set a Rotation Angle for a Chart Axis Title
Call setTitle with true on the vertical axis, provide title text, and use setRotationAngle to rotate the title. The angle is measured in degrees; this example saves a column chart with its value-axis title rotated by 90 degrees.
var aspose = aspose || {};
aspose.slides = require("aspose.slides.via.java");

var presentation = new aspose.slides.Presentation();
try {
    var slide = presentation.getSlides().get_Item(0);

    var chart = slide.getShapes().addChart(aspose.slides.ChartType.ClusteredColumn, 50, 50, 450, 300);
    chart.getAxes().getVerticalAxis().setTitle(true);
    chart.getAxes().getVerticalAxis().getTitle().addTextFrameForOverriding("Value");
    chart.getAxes().getVerticalAxis().getTitle().getTextFormat().getTextBlockFormat().setRotationAngle(90);

    presentation.save("RotatedAxisTitle.pptx", aspose.slides.SaveFormat.Pptx);
} finally {
    presentation.dispose();
}
Set the Axis Position on a Category or Value Axis
Use setAxisBetweenCategories to control whether the value axis crosses the category axis between categories or at category tick marks. This setting applies to category axes. The example sets it to true on the horizontal category axis of a column chart and saves the result.
var aspose = aspose || {};
aspose.slides = require("aspose.slides.via.java");

var presentation = new aspose.slides.Presentation();
try {
    var slide = presentation.getSlides().get_Item(0);

    var chart = slide.getShapes().addChart(aspose.slides.ChartType.ClusteredColumn, 50, 50, 450, 300);
    chart.getAxes().getHorizontalAxis().setAxisBetweenCategories(true);

    presentation.save("AxisBetweenCategories.pptx", aspose.slides.SaveFormat.Pptx);
} finally {
    presentation.dispose();
}
Set the Display Unit on a Chart Value Axis
Use setDisplayUnit to scale the labels on a value axis without changing the underlying data. With DisplayUnitType set to Millions, a value of 60,000,000 is displayed as 60. The example creates a column chart and applies the millions display unit to its vertical axis.
var aspose = aspose || {};
aspose.slides = require("aspose.slides.via.java");

var presentation = new aspose.slides.Presentation();
try {
    var slide = presentation.getSlides().get_Item(0);

    var chart = slide.getShapes().addChart(aspose.slides.ChartType.ClusteredColumn, 50, 50, 450, 300);
    chart.getAxes().getVerticalAxis().setDisplayUnit(aspose.slides.DisplayUnitType.Millions);

    presentation.save("Result.pptx", aspose.slides.SaveFormat.Pptx);
} finally {
    presentation.dispose();
}
Configure a Logarithmic Value Axis
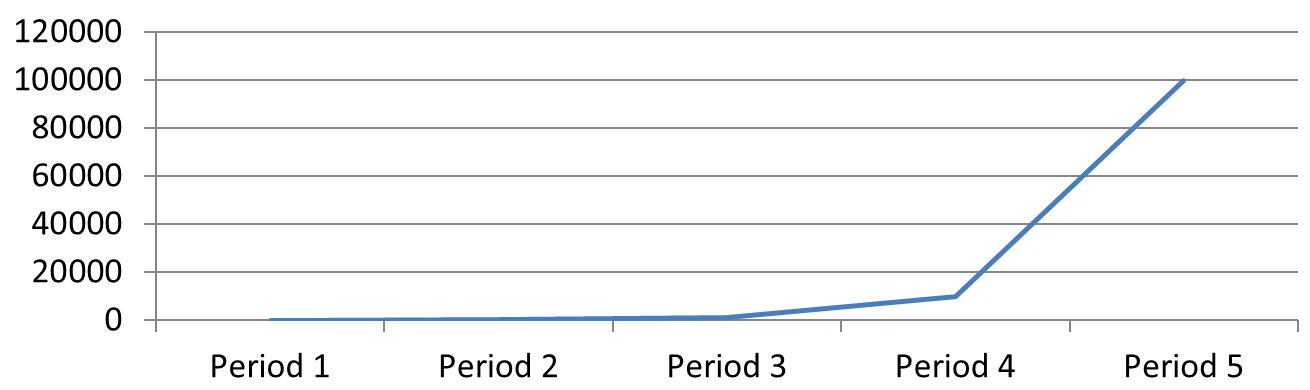
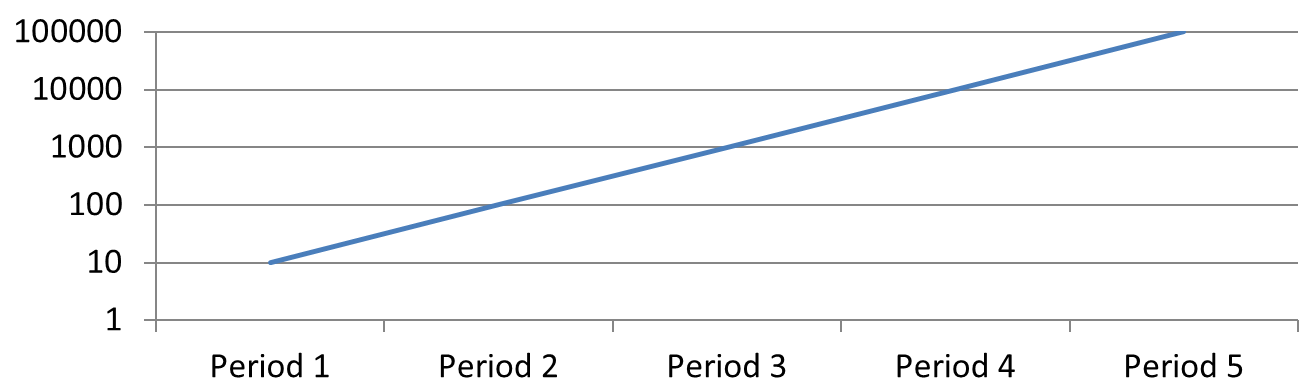
A logarithmic value axis is useful when positive values span several orders of magnitude. For example, a service might receive 10, 100, 1,000, 10,000, and 100,000 requests over five periods. On a linear scale, the smaller values appear close together near zero. A logarithmic scale makes their relative growth easier to compare: equal distances represent equal ratios rather than equal differences.
Call setLogarithmic with true on the value axis and use setLogBase to choose the base. This changes how the existing values are displayed; it does not change the data or add a logarithmic trend line. A trend line represents a fitted relationship in the data and is a separate feature.
Choose the Value Axis and Base
For a line or column chart, the value axis is returned by getVerticalAxis. For a horizontal bar chart, it is returned by getHorizontalAxis. Scatter and bubble charts have two value axes, so choose the horizontal axis for X values, the vertical axis for Y values, or both. Do not apply logarithmic scaling to a category axis.
The default logarithmic base is 10. For PPTX charts, use a base from 2 through 1000, inclusive; fractional bases such as 2.5 are also supported. With base 10, successive powers such as 10, 100, 1,000, and 10,000 are equally spaced.
Compare Linear and Logarithmic Scaling
The following self-contained example creates a line chart with the five request counts on the first slide, then clones that slide and enables a base-10 logarithmic value axis on the second. Both slides retain the same data.
var aspose = aspose || {};
aspose.slides = require("aspose.slides.via.java");

var presentation = new aspose.slides.Presentation();
try {
    var slide = presentation.getSlides().get_Item(0);

    var chart = slide.getShapes().addChart(aspose.slides.ChartType.Line, 30, 40, 660, 200);

    chart.setLegend(false);

    chart.getChartData().getCategories().clear();
    chart.getChartData().getSeries().clear();

    var workbook = chart.getChartData().getChartDataWorkbook();
    workbook.clear(0);

    var series = chart.getChartData().getSeries().add(aspose.slides.ChartType.Line);
    var values = [10, 100, 1000, 10000, 100000];

    for (var i = 0; i < values.length; i++) {
        var categoryCell = workbook.getCell(0, i + 1, 0, "Period " + (i + 1));
        chart.getChartData().getCategories().add(categoryCell);

        var valueCell = workbook.getCell(0, i + 1, 1, values[i]);
        series.getDataPoints().addDataPointForLineSeries(valueCell);
    }

    // Keep the first slide linear and change only the copy's value-axis scale.
    var logarithmicSlide = presentation.getSlides().addClone(slide);
    var logarithmicChart = logarithmicSlide.getShapes().get_Item(0);
    var valueAxis = logarithmicChart.getAxes().getVerticalAxis();
    valueAxis.setLogarithmic(true);
    valueAxis.setLogBase(10);

    presentation.save("LogarithmicAxis.pptx", aspose.slides.SaveFormat.Pptx);
} finally {
    presentation.dispose();
}
Linear scale (slide 1): Equal vertical distances represent equal differences in request counts. The largest value dominates the chart, making the smaller values difficult to distinguish.
Logarithmic scale (slide 2): Equal vertical distances represent equal ratios. Each period has ten times as many requests as the previous one, so the points form a straight rising line on the base-10 scale. The axis labels still show the original request counts.
Handle Zero and Negative Values
A logarithmic scale can display only strictly positive values. Check the data before enabling it. If zero or negative values are meaningful, keep a linear scale or show them separately. If excluding those values is appropriate for the analysis, explain the omission. Do not silently replace them with small positive numbers, as this changes the meaning of the data. Any manually configured minimum or maximum for a logarithmic axis must also be positive.
FAQ
How do I set the value at which one axis crosses the other (axis crossing)?
Use setCrossType to select the crossing behavior. To specify a numeric crossing value, use setCrossAt. These settings let you move the axis crossing to a suitable baseline.
How can I position tick labels relative to the axis?
Call setTickLabelPosition using TickLabelPositionType: Low, High, NextTo, or None. To control the tick marks themselves, use setMajorTickMark or setMinorTickMark; these are separate from label positioning.