
ปรับแต่งแกนแผนภูมิในงานนำเสนอโดยใช้ JavaScript
ภาพรวม
บทความนี้อธิบายวิธีการปรับแต่งแกนของแผนภูมิด้วย Aspose.Slides สำหรับ Node.js ผ่าน Java. เนื้อหาครอบคลุมค่าที่คำนวณของแกน, การสลับแถวและคอลัมน์ของแผนภูมิ, การแสดงหรือซ่อนแกน, ช่วงเวลาของป้ายชื่อหมวดและติ๊กมาร์ค, หมวดวันที่และการจัดรูปแบบ, การหมุนหัวเรื่อง, ตำแหน่งของแกน, และหน่วยการแสดงผล.
รับค่ามากสุดบนแกนแนวตั้งของแผนภูมิ
สร้าง Presentation และเพิ่มแผนภูมิแบบพื้นที่ด้วยข้อมูลเริ่มต้น. เรียก validateChartLayout ก่อนอ่านค่าที่คำนวณของแกนเพื่อให้การจัดวางแผนภูมิเป็นปัจจุบัน.
อ่าน getActualMaxValue และ getActualMinValue เพื่อให้ได้ขีดจำกัดของแกน, และ getActualMajorUnit และ getActualMinorUnit เพื่อให้ได้ช่วงของติ๊ก. getActualMajorUnitScale และ getActualMinorUnitScale ให้สเกลหน่วยเวลา, ซึ่งเกี่ยวข้องกับแกนวันที่. ตัวอย่างจะเก็บค่าต่าง ๆ เหล่านี้ในตัวแปรท้องถิ่นและบันทึกแผนภูมิ.
var aspose = aspose || {};
aspose.slides = require("aspose.slides.via.java");

var presentation = new aspose.slides.Presentation();
try {
    var slide = presentation.getSlides().get_Item(0);

    var chart = slide.getShapes().addChart(aspose.slides.ChartType.Area, 100, 100, 500, 350);
    chart.validateChartLayout();

    var maxValue = chart.getAxes().getVerticalAxis().getActualMaxValue();
    var minValue = chart.getAxes().getVerticalAxis().getActualMinValue();

    var majorUnit = chart.getAxes().getVerticalAxis().getActualMajorUnit();
    var minorUnit = chart.getAxes().getVerticalAxis().getActualMinorUnit();

    var majorUnitScale = chart.getAxes().getVerticalAxis().getActualMajorUnitScale();
    var minorUnitScale = chart.getAxes().getVerticalAxis().getActualMinorUnitScale();

    presentation.save("AxisValues_out.pptx", aspose.slides.SaveFormat.Pptx);
} finally {
    presentation.dispose();
}
สลับข้อมูลระหว่างแกน
ใช้ switchRowColumn เพื่อสลับบทบาทของซีรีส์และหมวดในข้อมูลแผนภูมิ. หมวดเดิมแต่ละรายการจะกลายเป็นซีรีส์, และซีรีส์เดิมแต่ละรายการจะกลายเป็นหมวด. สิ่งนี้เปลี่ยนวิธีการจัดกลุ่มข้อมูล; ไม่ได้สลับแกนแนวนอนและแนวตั้ง. ตัวอย่างใช้ setRange เพื่อผูกข้อมูลเริ่มต้นกับ Sheet1!A1:D5, รวมถึงแถวหัวและคอลัมน์หมวด, ก่อนทำการสลับแถวและคอลัมน์. มันบันทึกแผนภูมิที่มีสี่ซีรีส์และสามหมวด.
var aspose = aspose || {};
aspose.slides = require("aspose.slides.via.java");

var presentation = new aspose.slides.Presentation();
try {
    var slide = presentation.getSlides().get_Item(0);

    var chart = slide.getShapes().addChart(aspose.slides.ChartType.ClusteredColumn, 100, 100, 400, 300);
    chart.getChartData().setRange("Sheet1!A1:D5");
    chart.getChartData().switchRowColumn();

    presentation.save("SwitchChartRowColumns_out.pptx", aspose.slides.SaveFormat.Pptx);
} finally {
    presentation.dispose();
}
ปิดการแสดงแกนแนวตั้งสำหรับแผนภูมิเส้น
เรียก setVisible ด้วยค่า false บนแกนแนวตั้งเพื่อซ่อนมัน. ตัวอย่างสร้างแผนภูมิเส้นด้วยข้อมูลเริ่มต้นและบันทึกโดยที่แกนแนวตั้งถูกซ่อน.
var aspose = aspose || {};
aspose.slides = require("aspose.slides.via.java");

var presentation = new aspose.slides.Presentation();
try {
    var slide = presentation.getSlides().get_Item(0);

    var chart = slide.getShapes().addChart(aspose.slides.ChartType.Line, 100, 100, 400, 300);
    chart.getAxes().getVerticalAxis().setVisible(false);

    presentation.save("HiddenVerticalAxis.pptx", aspose.slides.SaveFormat.Pptx);
} finally {
    presentation.dispose();
}
ปิดการแสดงแกนแนวนอนสำหรับแผนภูมิเส้น
เรียก setVisible ด้วยค่า false บนแกนแนวนอนเพื่อซ่อนมัน. ตัวอย่างสร้างแผนภูมิเส้นด้วยข้อมูลเริ่มต้นและบันทึกโดยที่แกนแนวนอนถูกซ่อน.
var aspose = aspose || {};
aspose.slides = require("aspose.slides.via.java");

var presentation = new aspose.slides.Presentation();
try {
    var slide = presentation.getSlides().get_Item(0);

    var chart = slide.getShapes().addChart(aspose.slides.ChartType.Line, 100, 100, 400, 300);
    chart.getAxes().getHorizontalAxis().setVisible(false);

    presentation.save("HiddenHorizontalAxis.pptx", aspose.slides.SaveFormat.Pptx);
} finally {
    presentation.dispose();
}
เปลี่ยนแกนหมวด
ใช้ setCategoryAxisType เพื่อเลือกแกนหมวดแบบวันที่หรือข้อความ. ตัวอย่างนี้ต้องการไฟล์ ExistingChart.pptx, โดยมีแผนภูมิเป็นรูปร่างแรกบนสไลด์แรกและเซลล์หมวดมีค่าที่เป็นเลขวันที่ของ Excel. มันเปลี่ยนแกนแนวนอนเป็นแกนวันที่. การเรียก setAutomaticMajorUnit ด้วย false, setMajorUnit ด้วย 1, และ setMajorUnitScale ด้วย TimeUnitType.Months จะกำหนดติ๊กหลักให้มีระยะห่างหนึ่งเดือน.
var aspose = aspose || {};
aspose.slides = require("aspose.slides.via.java");

var presentation = new aspose.slides.Presentation("ExistingChart.pptx");
try {
    var slide = presentation.getSlides().get_Item(0);

    var chart = slide.getShapes().get_Item(0);
    chart.getAxes().getHorizontalAxis().setCategoryAxisType(aspose.slides.CategoryAxisType.Date);
    chart.getAxes().getHorizontalAxis().setAutomaticMajorUnit(false);
    chart.getAxes().getHorizontalAxis().setMajorUnit(1);
    chart.getAxes().getHorizontalAxis().setMajorUnitScale(aspose.slides.TimeUnitType.Months);

    presentation.save("ChangeChartCategoryAxis_out.pptx", aspose.slides.SaveFormat.Pptx);
} finally {
    presentation.dispose();
}
ควบคุมช่วงเวลาป้ายชื่อแกนหมวด
เมื่อแผนภูมิมีหมวดจำนวนมาก, ลดจำนวนป้ายชื่อแกนที่มองเห็นได้โดยไม่ต้องลบหมวดหรือจุดข้อมูล. เรียก setAutomaticTickLabelSpacing ด้วย false, จากนั้นส่งช่วงหมวดที่ต้องการไปที่ setTickLabelSpacing. สำหรับหมวดข้อความในลำดับปกติ, การนับเริ่มจากหมวดแรก:
| ช่วง | ป้ายชื่อที่แสดงในตัวอย่าง |
|---|---|
1 |
หมวด 1, หมวด 2, หมวด 3, … หมวด 24 |
2 |
หมวด 1, หมวด 3, หมวด 5, … หมวด 23 |
3 |
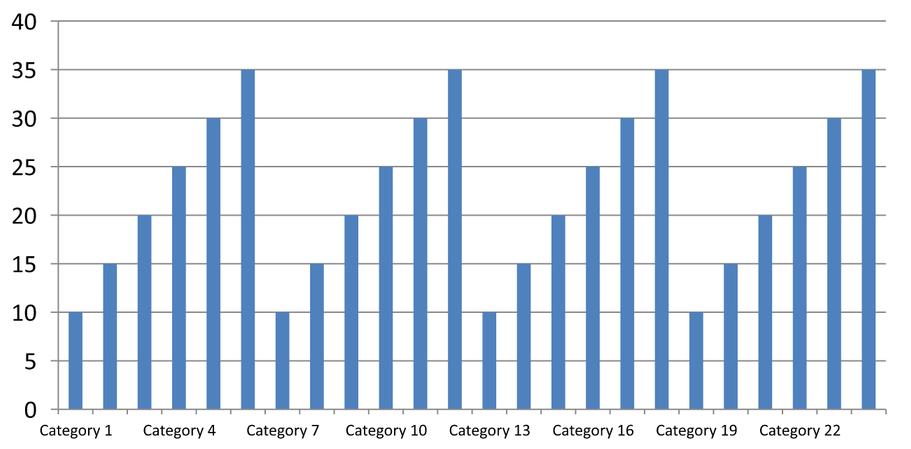
หมวด 1, หมวด 4, หมวด 7, … หมวด 22 |
ช่วง 3 จะแสดงป้ายชื่อทุกสามรายการ, ทำให้มีสองป้ายชื่อที่ซ่อนอยู่ระหว่างป้ายที่แสดง. มันไม่ได้ลบคอลัมน์ที่สอดคล้องกัน. การจัดช่องแบบอัตโนมัติจะเลือกช่วงตามพื้นที่ว่างที่มี; ไม่จำเป็นต้องแสดงทุกป้ายชื่อ.
ติ๊กมาร์คมีการควบคุมแยกต่างหาก. เรียก setAutomaticTickMarksSpacing ด้วย false และใช้ setTickMarksSpacing เพื่อกำหนดช่วงของมัน. ตัวอย่างเช่น, 1 จะทำให้มีติ๊กมาร์คที่ทุกช่วงหมวดในขณะที่ป้ายชื่อปรากฏเพียงทุกสามหมวด. ใช้ setMajorTickMark พร้อมสไตล์ที่มองเห็นได้เพื่อดูผล. การเรียกตั้งค่าอัตโนมัติใด ๆ ด้วย true อีกครั้งจะทำให้แผนภูมิตัดสินใจเลือกช่วงนั้นอีกครั้ง.
ตัวอย่างอิสระต่อไปนี้สร้างหมวด 24 รายการและหนึ่งซีรีส์, จากนั้นบันทึกสามสไลด์ใน CategoryAxisIntervals.pptx: การจัดช่องอัตโนมัติ, การจัดช่องป้ายชื่อด้วยมือพร้อมติ๊กมาร์คอิสระ, และการคืนสู่การจัดช่องอัตโนมัติ. สำเนาสองชุดนี้เก็บข้อมูลแผนภูดิดั้งเดิมไว้. ไม่จำเป็นต้องมีการนำเสนอเข้ามา. ข้อความป้ายชื่อแนวนอนทำให้ความแตกต่างของความหนาแน่นเห็นได้ง่าย.
var aspose = aspose || {};
aspose.slides = require("aspose.slides.via.java");

var presentation = new aspose.slides.Presentation();
try {
    var slide = presentation.getSlides().get_Item(0);

    var chart = slide.getShapes().addChart(aspose.slides.ChartType.ClusteredColumn, 30, 40, 660, 320);

    chart.setLegend(false);
    chart.getChartData().getCategories().clear();
    chart.getChartData().getSeries().clear();

    var workbook = chart.getChartData().getChartDataWorkbook();
    workbook.clear(0);

    var series = chart.getChartData().getSeries().add(aspose.slides.ChartType.ClusteredColumn);
    for (var i = 0; i < 24; i++) {
        var categoryCell = workbook.getCell(0, i + 1, 0, "Category " + (i + 1));
        chart.getChartData().getCategories().add(categoryCell);
        var valueCell = workbook.getCell(0, i + 1, 1, 10 + i % 6 * 5);
        series.getDataPoints().addDataPointForBarSeries(valueCell);
    }

    var axis = chart.getAxes().getHorizontalAxis();
    axis.setCategoryAxisType(aspose.slides.CategoryAxisType.Text);
    axis.getTextFormat().getTextBlockFormat().setRotationAngle(0);
    axis.getTextFormat().getPortionFormat().setFontHeight(12);
    axis.setMajorTickMark(aspose.slides.TickMarkType.Outside);
    axis.setAutomaticTickLabelSpacing(true);
    axis.setAutomaticTickMarksSpacing(true);

    // สไลด์ 2: แสดงป้ายชื่อทุกสามรายการ แต่คงติ๊กมาร์คสำหรับทุกหมวด.
    var manualSlide = presentation.getSlides().addClone(slide);
    var manualChart = manualSlide.getShapes().get_Item(0);
    var manualAxis = manualChart.getAxes().getHorizontalAxis();
    manualAxis.setAutomaticTickLabelSpacing(false);
    manualAxis.setTickLabelSpacing(3);
    manualAxis.setAutomaticTickMarksSpacing(false);
    manualAxis.setTickMarksSpacing(1);

    // สไลด์ 3: ให้แผนภูมิเฝือกช่วงทั้งสองใหม่อีกครั้ง.
    var restoredSlide = presentation.getSlides().addClone(manualSlide);
    var restoredChart = restoredSlide.getShapes().get_Item(0);
    restoredChart.getAxes().getHorizontalAxis().setAutomaticTickLabelSpacing(true);
    restoredChart.getAxes().getHorizontalAxis().setAutomaticTickMarksSpacing(true);

    presentation.save("CategoryAxisIntervals.pptx", aspose.slides.SaveFormat.Pptx);
} finally {
    presentation.dispose();
}
การจัดช่องอัตโนมัติ (สไลด์ 1): ในการแสดงผลนี้, ป้ายชื่อของทุกหมวดที่สองจะแสดงและหักบรรทัดเป็นสองบรรทัด. ผลลัพธ์อัตโนมัติอาจแตกต่างกันตามขนาดแผนภูมิ, ฟอนต์, และตัวเรนเดอร์.
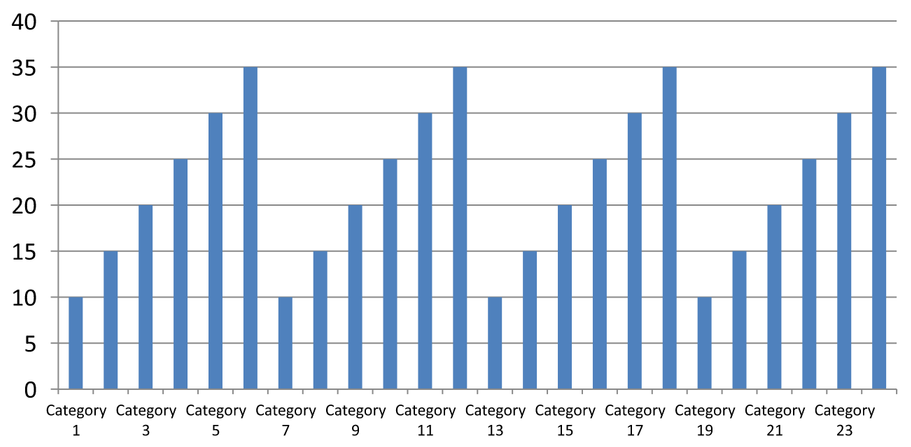
การจัดช่องด้วยมือ (สไลด์ 2): ป้ายชื่อทุกสามรายการจะถูกแสดงในบรรทัดเดียว, ในขณะที่ติ๊กมาร์คยังคงอยู่ที่ทุกช่วงหมวด. คอลัมน์ทั้งหมด 24 คอลัมน์, รวมถึงที่ไม่มีป้ายชื่อ, ยังคงมองเห็นด้วยค่าที่เหมือนกัน. สไลด์ 3 คืนสภาพการแสดงอัตโนมัติที่แสดงข้างบน.
เลือกแกนและช่วงที่ถูกต้อง
ใช้ช่วงจำนวนหมวดนี้สำหรับแกนหมวดแบบข้อความ, เช่น แกนหมวดของแผนภูมิคอลัมน์, เส้น, พื้นที่, หรือแท่ง. ในแผนภูมิคอลัมน์, มันคือแกนแนวนอน. ในแผนภูมิแท่งแนวนอน, แกนหมวดอยู่แนวตั้ง, ดังนั้นให้ใช้การตั้งค่าเหล่านี้กับแกนที่ได้จาก getVerticalAxis. การจัดช่องติ๊กมาร์คยังใช้กับแกนซีรีส์ในแผนภูมิที่มีแกนซีรีส์.
หากต้องการกำหนดช่วงป้ายชื่อหมวดเพื่อกำหนดสเกลเชิงตัวเลขของแกนค่า จะไม่ถูกต้อง. บนแกนค่า, setMajorUnit ระบุความแตกต่างของค่า: ตัวอย่างเช่น, หน่วยหลัก 10 จะสร้างติ๊กที่ 0, 10, 20, ฯลฯ เมื่อแกนเริ่มที่ศูนย์. ช่วงป้ายชื่อหมวด 3 จะนับตำแหน่งหมวด, ไม่คำนึงถึงค่าข้อมูลของมัน. แผนภูมิกระจายและฟองใช้แกนค่าแทนแกนหมวดข้อความ. สำหรับแกนวันที่, ให้ใช้หน่วยหลักและสเกลแบบเวลาตามที่อธิบายใน Change a Category Axis.
กำหนดรูปแบบวันที่สำหรับค่าของแกนหมวด
ตัวอย่างนี้แทนที่ข้อมูลแผนภูดิดั้งเดิมด้วยค่าปีสี่ค่า. วันที่ถูกเก็บเป็นเลขซีเรียล OLE Automation ในเวิร์กชีตแรก (ดัชนี 0), คำนวณจากจำนวนวันที่ผ่านจาก 30 ธันวาคม 1899 สำหรับวันที่เหล่านี้. การคำนวณ JavaScript ใช้ตราประทับเวลา UTC และหารความแตกต่างด้วย 86,400,000 มิลลิวินาทีต่อวัน. ใช้ setCategoryAxisType ด้วย CategoryAxisType.Date, เรียก setNumberFormatLinkedToSource ด้วย false, และส่ง yyyy ไปที่ setNumberFormat เพื่อให้ป้ายชื่อหมวดแสดงปีสี่หลักโดยอิสระจากการฟอร์แมตของเซลล์.
var aspose = aspose || {};
aspose.slides = require("aspose.slides.via.java");

var presentation = new aspose.slides.Presentation();
try {
    var slide = presentation.getSlides().get_Item(0);

    var chart = slide.getShapes().addChart(aspose.slides.ChartType.Line, 50, 50, 450, 300);

    chart.getChartData().getCategories().clear();
    chart.getChartData().getSeries().clear();

    var workbook = chart.getChartData().getChartDataWorkbook();
    workbook.clear(0);

    var baseDate = Date.UTC(1899, 11, 30);

    var series = chart.getChartData().getSeries().add(aspose.slides.ChartType.Line);
    for (var i = 0; i < 4; i++) {
        var date = Date.UTC(2015 + i, 0, 1);
        var categoryCell = workbook.getCell(0, i + 1, 0, (date - baseDate) / 86400000);
        chart.getChartData().getCategories().add(categoryCell);

        var valueCell = workbook.getCell(0, i + 1, 1, i + 1);
        series.getDataPoints().addDataPointForLineSeries(valueCell);
    }

    chart.getAxes().getHorizontalAxis().setCategoryAxisType(aspose.slides.CategoryAxisType.Date);
    chart.getAxes().getHorizontalAxis().setNumberFormatLinkedToSource(false);
    chart.getAxes().getHorizontalAxis().setNumberFormat("yyyy");

    presentation.save("DateAxisFormat.pptx", aspose.slides.SaveFormat.Pptx);
} finally {
    presentation.dispose();
}
กำหนดมุมการหมุนสำหรับหัวเรื่องของแกนแผนภูมิ
เรียก setTitle ด้วยค่า true บนแกนแนวตั้ง, ระบุข้อความหัวเรื่อง, และใช้ setRotationAngle เพื่อหมุนหัวเรื่อง. มุมวัดเป็นหน่วยองศา; ตัวอย่างนี้บันทึกแผนภูมิคอลัมน์ที่หัวเรื่องแกนค่าถูกหมุน 90 องศา.
var aspose = aspose || {};
aspose.slides = require("aspose.slides.via.java");

var presentation = new aspose.slides.Presentation();
try {
    var slide = presentation.getSlides().get_Item(0);

    var chart = slide.getShapes().addChart(aspose.slides.ChartType.ClusteredColumn, 50, 50, 450, 300);
    chart.getAxes().getVerticalAxis().setTitle(true);
    chart.getAxes().getVerticalAxis().getTitle().addTextFrameForOverriding("Value");
    chart.getAxes().getVerticalAxis().getTitle().getTextFormat().getTextBlockFormat().setRotationAngle(90);

    presentation.save("RotatedAxisTitle.pptx", aspose.slides.SaveFormat.Pptx);
} finally {
    presentation.dispose();
}
กำหนดตำแหน่งของแกนบนแกนหมวดหรือแกนค่า
ใช้ setAxisBetweenCategories เพื่อควบคุมว่าตำแหน่งแกนค่าจะข้ามแกนหมวดระหว่างหมวดหรือที่ติ๊กมาร์คของหมวด. การตั้งค่านี้ใช้กับแกนหมวด. ตัวอย่างตั้งค่าเป็น true บนแกนหมวดแนวนอนของแผนภูมิคอลัมน์และบันทึกผลลัพธ์.
var aspose = aspose || {};
aspose.slides = require("aspose.slides.via.java");

var presentation = new aspose.slides.Presentation();
try {
    var slide = presentation.getSlides().get_Item(0);

    var chart = slide.getShapes().addChart(aspose.slides.ChartType.ClusteredColumn, 50, 50, 450, 300);
    chart.getAxes().getHorizontalAxis().setAxisBetweenCategories(true);

    presentation.save("AxisBetweenCategories.pptx", aspose.slides.SaveFormat.Pptx);
} finally {
    presentation.dispose();
}
กำหนดหน่วยการแสดงผลบนแกนค่าของแผนภูมิ
ใช้ setDisplayUnit เพื่อสเกลป้ายชื่อบนแกนค่าโดยไม่เปลี่ยนข้อมูลฐาน. เมื่อ DisplayUnitType ตั้งค่าเป็น Millions, ค่าที่เป็น 60,000,000 จะถูกแสดงเป็น 60. ตัวอย่างสร้างแผนภูมิคอลัมน์และนำหน่วยการแสดงผลเป็นล้านไปใช้กับแกนแนวตั้งของมัน.
var aspose = aspose || {};
aspose.slides = require("aspose.slides.via.java");

var presentation = new aspose.slides.Presentation();
try {
    var slide = presentation.getSlides().get_Item(0);

    var chart = slide.getShapes().addChart(aspose.slides.ChartType.ClusteredColumn, 50, 50, 450, 300);
    chart.getAxes().getVerticalAxis().setDisplayUnit(aspose.slides.DisplayUnitType.Millions);

    presentation.save("Result.pptx", aspose.slides.SaveFormat.Pptx);
} finally {
    presentation.dispose();
}
FAQ
ฉันจะตั้งค่าจุดที่แกนหนึ่งข้ามแกนอีกแกน (การข้ามแกน) อย่างไร?
ใช้ setCrossType เพื่อเลือกรูปแบบการข้ามแกน. หากต้องการระบุค่าตัวเลขของจุดข้าม, ใช้ setCrossAt. การตั้งค่าเหล่านี้ทำให้คุณสามารถย้ายจุดข้ามแกนไปยังฐานที่เหมาะสม.
ฉันจะวางตำแหน่งป้ายติ๊กสัมพันธ์กับแกนได้อย่างไร?
เรียก setTickLabelPosition โดยใช้ TickLabelPositionType: Low, High, NextTo, หรือ None. เพื่อควบคุมติ๊กมาร์คเอง, ใช้ setMajorTickMark หรือ setMinorTickMark; สิ่งเหล่านี้แยกจากการวางตำแหน่งป้ายชื่อ.