
使用 PHP 客製化簡報中的圖表圖例
概覽
Aspose.Slides for PHP via Java 提供在 PowerPoint 簡報中自訂圖表圖例的選項。本文章說明如何定位與調整圖例大小、設定整個圖例的字型大小、格式化單一圖例項目,以及隱藏或復原特定項目。
常見問題解答涵蓋相關行為,包括為圖例保留空間、顯示多行標籤,以及繼承簡報主題的格式設定。
圖例定位
使用圖例的 setX、setY、setWidth、與 setHeight 方法,將其位置與大小指定為圖表尺寸的比例。
此範例建立簡報,於第一張投影片加入預設資料的群組矩形圖表。將所需的圖例偏移與尺寸除以圖表寬高,即可轉換為相對值:圖例從圖表左上角向右下偏移 50 點,大小為 100 × 100 點。範例使用 java_values 將 PHP/Java Bridge 回傳的圖表尺寸轉換為 PHP 數值後再進行除法。
use aspose\slides\ChartType;
use aspose\slides\Presentation;
use aspose\slides\SaveFormat;

$presentation = new Presentation();
try {
    $slide = $presentation->getSlides()->get_Item(0);

    $chart = $slide->getShapes()->addChart(ChartType::ClusteredColumn, 50, 50, 500, 500);

    $chartWidth = java_values($chart->getWidth());
    $chartHeight = java_values($chart->getHeight());

    // 以相對於圖表的方式表示圖例的位置與大小。
    $chart->getLegend()->setX(50 / $chartWidth);
    $chart->getLegend()->setY(50 / $chartHeight);
    $chart->getLegend()->setWidth(100 / $chartWidth);
    $chart->getLegend()->setHeight(100 / $chartHeight);

    $presentation->save("legend_position.pptx", SaveFormat::Pptx);
} finally {
    $presentation->dispose();
}
設定圖例的字型大小
使用圖例的 getTextFormat 取得文字格式,並使用 setFontHeight 以點數設定字型大小。
此範例建立預設資料的圖表,並將圖例文字設定為 20 點。同時停用垂直軸的自動界限,並將其範圍設定為 -5 至 10。
use aspose\slides\ChartType;
use aspose\slides\Presentation;
use aspose\slides\SaveFormat;

$presentation = new Presentation();
try {
    $slide = $presentation->getSlides()->get_Item(0);

    $chart = $slide->getShapes()->addChart(ChartType::ClusteredColumn, 50, 50, 600, 400);

    $chart->getLegend()->getTextFormat()->getPortionFormat()->setFontHeight(20);
    $chart->getAxes()->getVerticalAxis()->setAutomaticMinValue(false);
    $chart->getAxes()->getVerticalAxis()->setMinValue(-5);
    $chart->getAxes()->getVerticalAxis()->setAutomaticMaxValue(false);
    $chart->getAxes()->getVerticalAxis()->setMaxValue(10);

    $presentation->save("legend_font_size.pptx", SaveFormat::Pptx);
} finally {
    $presentation->dispose();
}
設定單一圖例項目的字型大小
使用圖例的 getEntries 方法回傳的集合,取得特定項目的格式設定。項目索引採零基制,索引 1 代表第二個項目。
此範例建立包含至少兩個序列的群組矩形圖表,將第二個圖例項目設定為粗體、斜體、20 點藍色文字。
use aspose\slides\ChartType;
use aspose\slides\FillType;
use aspose\slides\NullableBool;
use aspose\slides\Presentation;
use aspose\slides\SaveFormat;

$presentation = new Presentation();
try {
    $slide = $presentation->getSlides()->get_Item(0);

    $chart = $slide->getShapes()->addChart(ChartType::ClusteredColumn, 50, 50, 600, 400);
    $textFormat = $chart->getLegend()->getEntries()->get_Item(1)->getTextFormat();

    $textFormat->getPortionFormat()->setFontBold(NullableBool::True);
    $textFormat->getPortionFormat()->setFontHeight(20);
    $textFormat->getPortionFormat()->setFontItalic(NullableBool::True);
    $textFormat->getPortionFormat()->getFillFormat()->setFillType(FillType::Solid);
    $textFormat->getPortionFormat()->getFillFormat()->getSolidFillColor()->setColor(java("java.awt.Color")->BLUE);

    $presentation->save("legend_entry_format.pptx", SaveFormat::Pptx);
} finally {
    $presentation->dispose();
}
隱藏單一圖例項目
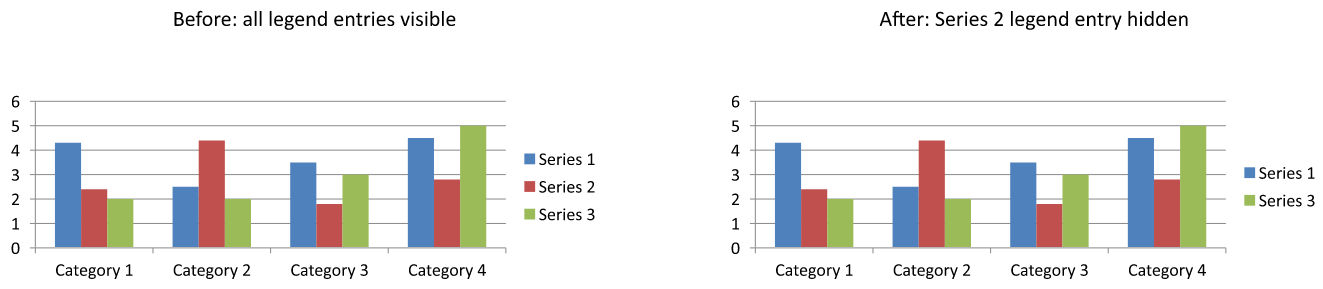
若要在保持資料可見的同時,將輔助序列從圖例中排除,請透過 ChartSeries::getRelatedLegendEntry 取得的項目呼叫 LegendEntryProperties::setHide 並傳入 true。這只會隱藏選取的圖例項目,不會移除序列或其資料點。相較之下,呼叫 Chart::setLegend 並傳入 false,會隱藏整個圖例。
以下範例建立包含多個序列的預設資料群組矩形圖表,隱藏第二個序列的圖例項目(索引 1),並儲存簡報。之後再以傳入 false 呼叫 setHide 復原該項目,並另存第二個副本。兩個檔案的柱狀仍皆可見。
use aspose\slides\ChartType;
use aspose\slides\Presentation;
use aspose\slides\SaveFormat;

$presentation = new Presentation();
try {
    $slide = $presentation->getSlides()->get_Item(0);

    $chart = $slide->getShapes()->addChart(ChartType::ClusteredColumn, 50, 50, 600, 400);
    $chart->setLegend(true);

    $legendEntry = $chart->getChartData()->getSeries()->get_Item(1)->getRelatedLegendEntry();

    $legendEntry->setHide(true);
    $presentation->save("hidden_legend_entry.pptx", SaveFormat::Pptx);

    // 在不更改圖表資料的情況下還原相同的項目。
    $legendEntry->setHide(false);
    $presentation->save("restored_legend_entry.pptx", SaveFormat::Pptx);
} finally {
    $presentation->dispose();
}
下面的比較顯示同一張圖表在全部圖例項目都可見與第二個系列的圖例項目被隱藏的情況;所有柱狀仍保持可見。
在柱狀圖、條形圖與折線圖中,圖例項目對應序列。對於圓餅圖,圖例項目對應個別資料點(切片),因此請對選取的切片使用 ChartDataPoint::getRelatedLegendEntry。API 為 Pie、Pie3D、ExplodedPie、ExplodedPie3D、PieOfPie 與 BarOfPie 圖表類型文件此資料點方法。不要假設此方法適用於環形圖,因為環形圖不在上述清單中。
常見問題
Can I make the chart allocate space for the legend instead of overlaying it?
可以。將 setOverlay 設為 false,即可為圖例保留空間,避免其覆蓋繪圖區。
Can I make multiline legend labels?
可以。當可用寬度不足時,長標籤會自動換行。也可以在系列名稱中加入換行字元,以自行要求換行。
How do I make the legend follow the presentation theme’s color scheme?
保持圖例的顏色、填色與字型未設定,讓它能繼承簡報主題的格式。若明確設定格式,會覆寫對應的主題設定。