
使用 Python 定制演示文稿中的图表图例
概述
Aspose.Slides for Python via Java 提供了在 PowerPoint 演示文稿中自定义图表图例的选项。本文展示了如何定位和设置图例的大小、为整个图例设置字体大小、格式化单个图例项,以及隐藏或恢复选定的图例项。
FAQ 包含了相关行为的说明,包括为图例预留空间、显示多行标签以及从演示文稿主题继承格式。
图例定位
使用图例的 setX、setY、setWidth 和 setHeight 方法,将其位置和大小指定为图表尺寸的比例。
此示例创建一个演示文稿并在第一张幻灯片上添加一个默认数据的簇状柱形图。通过将期望的图例偏移量和尺寸除以图表的宽度和高度,将其转换为相对值:图例相对于图表左上角偏移 50 点,大小为 100 × 100 点。
import jpype
import asposeslides

if not jpype.isJVMStarted():
    jpype.startJVM()

from asposeslides.api import ChartType, Presentation, SaveFormat

presentation = Presentation()
try:
    slide = presentation.getSlides().get_Item(0)

    chart = slide.getShapes().addChart(ChartType.ClusteredColumn, 50, 50, 500, 500)

    # 表示图例相对于图表的位置和大小。
    chart.getLegend().setX(50 / chart.getWidth())
    chart.getLegend().setY(50 / chart.getHeight())
    chart.getLegend().setWidth(100 / chart.getWidth())
    chart.getLegend().setHeight(100 / chart.getHeight())

    presentation.save("legend_position.pptx", SaveFormat.Pptx)
finally:
    presentation.dispose()
设置图例的字体大小
使用图例的 getTextFormat 访问其文本格式,并使用 setFontHeight 以点为单位设置字体大小。
此示例创建一个默认数据的图表,并将图例文本设置为 20 点。还禁用纵轴的自动边界并将其范围设为 -5 到 10。
import jpype
import asposeslides

if not jpype.isJVMStarted():
    jpype.startJVM()

from asposeslides.api import ChartType, Presentation, SaveFormat

presentation = Presentation()
try:
    slide = presentation.getSlides().get_Item(0)

    chart = slide.getShapes().addChart(ChartType.ClusteredColumn, 50, 50, 600, 400)

    chart.getLegend().getTextFormat().getPortionFormat().setFontHeight(20)
    chart.getAxes().getVerticalAxis().setAutomaticMinValue(False)
    chart.getAxes().getVerticalAxis().setMinValue(-5)
    chart.getAxes().getVerticalAxis().setAutomaticMaxValue(False)
    chart.getAxes().getVerticalAxis().setMaxValue(10)

    presentation.save("legend_font_size.pptx", SaveFormat.Pptx)
finally:
    presentation.dispose()
设置单个图例项的字体大小
使用图例的 getEntries 方法返回的集合来访问特定项的格式。条目索引从零开始,因此索引 1 指代第二个条目。
此示例创建一个默认数据包含至少两个系列的簇状柱形图。它将第二个图例项的文本设置为粗体、斜体、20 点蓝色。
import jpype
import asposeslides

if not jpype.isJVMStarted():
    jpype.startJVM()

from asposeslides.api import ChartType, FillType, NullableBool, Presentation, SaveFormat

Color = jpype.JClass("java.awt.Color")

presentation = Presentation()
try:
    slide = presentation.getSlides().get_Item(0)

    chart = slide.getShapes().addChart(ChartType.ClusteredColumn, 50, 50, 600, 400)
    text_format = chart.getLegend().getEntries().get_Item(1).getTextFormat()

    text_format.getPortionFormat().setFontBold(NullableBool.True_)
    text_format.getPortionFormat().setFontHeight(20)
    text_format.getPortionFormat().setFontItalic(NullableBool.True_)
    text_format.getPortionFormat().getFillFormat().setFillType(FillType.Solid)
    text_format.getPortionFormat().getFillFormat().getSolidFillColor().setColor(Color.BLUE)

    presentation.save("legend_entry_format.pptx", SaveFormat.Pptx)
finally:
    presentation.dispose()
隐藏单个图例项
要在保持数据可见的情况下将辅助系列从图例中排除,请通过 ChartSeries.getRelatedLegendEntry 调用 LegendEntryProperties.setHide 并传入 True。这只会隐藏选中的图例项,并不会移除系列或其数据点。相反,调用 Chart.setLegend 并传入 False 会隐藏整个图例。
下面的示例创建一个使用默认数据的多系列簇状柱形图。它隐藏第二个系列的图例项(索引 1),并保存演示文稿。随后通过调用 setHide 并传入 False 恢复该项,并保存第二份副本。两份文件中的柱形均保持可见。
import jpype
import asposeslides

if not jpype.isJVMStarted():
    jpage.startJVM()

from asposeslides.api import ChartType, Presentation, SaveFormat

presentation = Presentation()
try:
    slide = presentation.getSlides().get_Item(0)

    chart = slide.getShapes().addChart(ChartType.ClusteredColumn, 50, 50, 600, 400)
    chart.setLegend(True)

    legend_entry = chart.getChartData().getSeries().get_Item(1).getRelatedLegendEntry()

    legend_entry.setHide(True)
    presentation.save("hidden_legend_entry.pptx", SaveFormat.Pptx)

    # 恢复相同的条目而不更改图表数据。
    legend_entry.setHide(False)
    presentation.save("restored_legend_entry.pptx", SaveFormat.Pptx)
finally:
    presentation.dispose()
下面的比较展示了同一图表在所有条目可见和第二条目隐藏两种情况下的效果。第二系列的柱形保持不变。
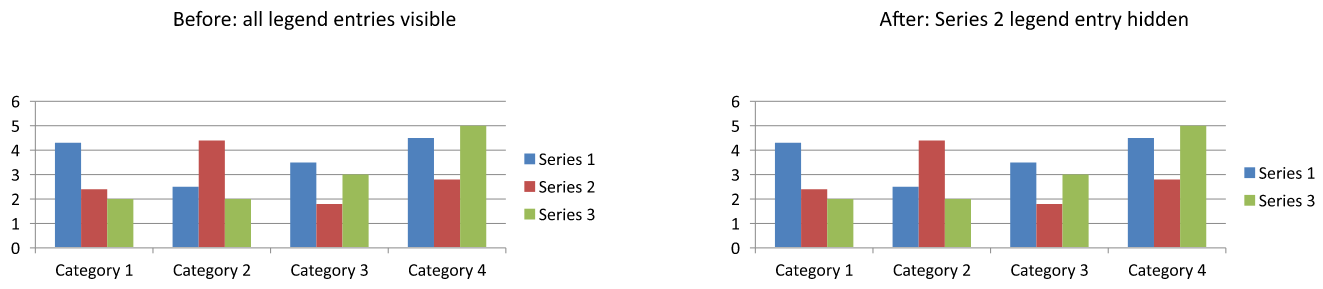
在柱形图、条形图和折线图中,图例项标识系列。对于饼图,它们标识单个数据点(切片),因此请对选中的切片使用 ChartDataPoint.getRelatedLegendEntry。API 为 Pie、Pie3D、ExplodedPie、ExplodedPie3D、PieOfPie 和 BarOfPie 图表类型记录了此数据点方法。请勿假设该方法适用于环形图,因为环形图不在此列表中。
常见问答
我可以让图表为图例预留空间,而不是覆盖它吗?
是。调用 setOverlay 并传入 False,即可为图例预留空间,而不是让其覆盖绘图区域。
我可以使用多行图例标签吗?
是。当可用宽度不足时,长标签会自动换行。也可以在系列名称中使用换行符来强制换行。
我如何让图例遵循演示文稿主题的配色方案?
保持图例的颜色、填充和字体未设置,使其能够继承主题格式。显式的格式设置会覆盖相应的主题设置。