
在 Python 中创建或更新 PowerPoint 演示文稿图表
概述
本文提供了使用 Aspose.Slides 创建和自定义图表的完整指南。您将学习如何以编程方式向幻灯片添加图表、填充数据,并应用各种格式设置以满足特定的设计需求。全文配有详细的代码示例,展示从初始化演示文稿和图表对象到配置系列、坐标轴和图例的每一步。通过本指南,您将深入了解如何在应用程序中集成动态图表生成,简化创建数据驱动演示文稿的过程。
创建图表
图表帮助人们快速直观地查看数据,并获得可能不易从表格或电子表格中直接看出的洞察。
为什么要创建图表?
使用图表,您可以:
- 在演示文稿的单个幻灯片上聚合、压缩或汇总大量数据
- 揭示数据中的模式和趋势
- 推断数据随时间或相对于特定计量单位的方向和动量
- 发现异常值、偏差、错误或不合理的数据
- 传达或展示复杂数据
在 PowerPoint 中,您可以通过 Insert 功能创建图表,该功能提供了用于设计多种图表类型的模板。使用 Aspose.Slides,您既可以创建基于常见图表类型的普通图表,也可以创建自定义图表。
Note
要创建图表,请使用ChartType类。该类中的字段对应不同的图表类型。创建聚簇柱形图
本节说明如何使用 Aspose.Slides 创建聚簇柱形图。您将学习初始化演示文稿、添加图表以及自定义标题、数据、系列、分类和样式等元素。按照下面的步骤查看如何生成标准的聚簇柱形图:
- 创建一个 Presentation 类的实例。
- 使用索引获取幻灯片的引用。
- 添加一个带有数据的图表,并指定
ChartType.ClusteredColumn类型。 - 为图表添加标题。
- 访问图表的数据工作表。
- 清除所有默认的系列和分类。
- 添加新的系列和分类。
- 为图表系列添加新的图表数据。
- 为图表系列应用填充颜色。
- 为图表系列添加标签。
- 将修改后的演示文稿保存为 PPTX 文件。
下面的 C# 代码演示了如何创建聚簇柱形图:
import jpype
import asposeslides

if not jpype.isJVMStarted():
    jpype.startJVM()

from asposeslides.api import ChartType, FillType, NullableBool, Presentation, SaveFormat

Color = jpype.JClass("java.awt.Color")

# 实例化一个表示 PPTX 文件的演示文稿类。
presentation = Presentation()
try:
    # 访问第一张幻灯片
    slide = presentation.getSlides().get_Item(0)

    # 添加一个带有默认数据的图表
    chart = slide.getShapes().addChart(ChartType.ClusteredColumn, 0, 0, 500, 500)

    # 设置图表标题
    chart.getChartTitle().addTextFrameForOverriding("Sample Title")
    chart.getChartTitle().getTextFrameForOverriding().getTextFrameFormat().setCenterText(NullableBool.True_)
    chart.getChartTitle().setHeight(20)
    chart.setTitle(True)

    # 设置图表数据工作表的索引
    default_worksheet_index = 0

    # 获取图表数据工作表
    workbook = chart.getChartData().getChartDataWorkbook()

    # 删除默认生成的系列和分类
    chart.getChartData().getSeries().clear()
    chart.getChartData().getCategories().clear()

    # 添加新系列
    cell = workbook.getCell(default_worksheet_index, 0, 1, "Series 1")
    chart.getChartData().getSeries().add(cell,chart.getType())
    cell = workbook.getCell(default_worksheet_index, 0, 2, "Series 2")
    chart.getChartData().getSeries().add(cell,chart.getType())

    # 添加新分类
    cell = workbook.getCell(default_worksheet_index, 1, 0, "Category 1")
    chart.getChartData().getCategories().add(cell)
    cell = workbook.getCell(default_worksheet_index, 2, 0, "Category 2")
    chart.getChartData().getCategories().add(cell)
    cell = workbook.getCell(default_worksheet_index, 3, 0, "Category 3")
    chart.getChartData().getCategories().add(cell)

    # 获取第一条图表系列
    series = chart.getChartData().getSeries().get_Item(0)

    # 现在填充系列数据
    cell = workbook.getCell(default_worksheet_index, 1, 1, 20)
    series.getDataPoints().addDataPointForBarSeries(cell)
    cell = workbook.getCell(default_worksheet_index, 2, 1, 50)
    series.getDataPoints().addDataPointForBarSeries(cell)
    cell = workbook.getCell(default_worksheet_index, 3, 1, 30)
    series.getDataPoints().addDataPointForBarSeries(cell)

    # 设置系列的填充颜色
    series.getFormat().getFill().setFillType(FillType.Solid)
    series.getFormat().getFill().getSolidFillColor().setColor(Color.RED)

    # 获取第二条图表系列
    series = chart.getChartData().getSeries().get_Item(1)

    # 填充系列数据
    cell = workbook.getCell(default_worksheet_index, 1, 2, 30)
    series.getDataPoints().addDataPointForBarSeries(cell)
    cell = workbook.getCell(default_worksheet_index, 2, 2, 10)
    series.getDataPoints().addDataPointForBarSeries(cell)
    cell = workbook.getCell(default_worksheet_index, 3, 2, 60)
    series.getDataPoints().addDataPointForBarSeries(cell)

    # 设置系列的填充颜色
    series.getFormat().getFill().setFillType(FillType.Solid)
    series.getFormat().getFill().getSolidFillColor().setColor(Color.GREEN)

    # 为新系列的每个分类创建自定义标签
    # 设置第一个标签显示分类名称
    label = series.getDataPoints().get_Item(0).getLabel()
    label.getDataLabelFormat().setShowCategoryName(True)

    label = series.getDataPoints().get_Item(1).getLabel()
    label.getDataLabelFormat().setShowSeriesName(True)

    # 为第三个标签显示数值
    label = series.getDataPoints().get_Item(2).getLabel()
    label.getDataLabelFormat().setShowValue(True)
    label.getDataLabelFormat().setShowSeriesName(True)
    label.getDataLabelFormat().setSeparator("/")

    # 保存包含图表的演示文稿
    presentation.save("output.pptx", SaveFormat.Pptx)
finally:
    presentation.dispose()
创建散点图
散点图(也称为散点图或 x‑y 图)常用于检查模式或展示两个变量之间的相关性。
在以下情形下使用散点图:
- 您拥有成对的数值数据
- 您有两个能够良好配对的变量
- 您想确定两个变量是否相关
- 您有一个独立变量对应多个因变量值
- 按照创建聚簇柱形图中的步骤操作。
- 在第三步,添加一个带有数据的图表,并将图表类型指定为下列之一:
- ChartType.ScatterWithMarkers - 表示散点图。
- ChartType.ScatterWithSmoothLinesAndMarkers - 表示通过曲线连接且带有数据标记的散点图。
- ChartType.ScatterWithSmoothLines - 表示通过曲线连接且不带数据标记的散点图。
- ChartType.ScatterWithStraightLinesAndMarkers - 表示通过直线连接且带有数据标记的散点图。
- ChartType.ScatterWithStraightLines - 表示通过直线连接且不带数据标记的散点图。
下面的 Python 代码展示了如何为每个系列创建具有不同标记的散点图:
import jpype
import asposeslides

if not jpype.isJVMStarted():
    jpype.startJVM()

from asposeslides.api import ChartType, MarkerStyleType, Presentation, SaveFormat

# 实例化一个表示 PPTX 文件的演示文稿类。
presentation = Presentation()
try:
    # 访问第一张幻灯片
    slide = presentation.getSlides().get_Item(0)

    # 创建默认图表
    chart = slide.getShapes().addChart(ChartType.ScatterWithSmoothLines, 0, 0, 400, 400)

    # 获取默认图表数据工作表索引
    default_worksheet_index = 0

    # 获取图表数据工作表
    workbook = chart.getChartData().getChartDataWorkbook()

    # 删除演示系列
    chart.getChartData().getSeries().clear()

    # 添加新系列
    cell = workbook.getCell(default_worksheet_index, 1, 1, "Series 1")
    chart.getChartData().getSeries().add(cell, chart.getType())
    cell = workbook.getCell(default_worksheet_index, 1, 3, "Series 2")
    chart.getChartData().getSeries().add(cell, chart.getType())

    # 获取第一条图表系列
    series = chart.getChartData().getSeries().get_Item(0)

    # 向系列添加新点 (1:3)
    x_cell = workbook.getCell(default_worksheet_index, 2, 1, 1)
    y_cell = workbook.getCell(default_worksheet_index, 2, 2, 3)
    series.getDataPoints().addDataPointForScatterSeries(x_cell, y_cell)

    # 添加新点 (2:10)
    x_cell = workbook.getCell(default_worksheet_index, 3, 1, 2)
    y_cell = workbook.getCell(default_worksheet_index, 3, 2, 10)
    series.getDataPoints().addDataPointForScatterSeries(x_cell, y_cell)

    # 更改系列类型
    series.setType(ChartType.ScatterWithStraightLinesAndMarkers)

    # 更改图表系列标记
    series.getMarker().setSize(10)
    series.getMarker().setSymbol(MarkerStyleType.Star)

    # 获取第二条图表系列
    series = chart.getChartData().getSeries().get_Item(1)

    # 在此处添加新点 (5:2)
    x_cell = workbook.getCell(default_worksheet_index, 2, 3, 5)
    y_cell = workbook.getCell(default_worksheet_index, 2, 4, 2)
    series.getDataPoints().addDataPointForScatterSeries(x_cell, y_cell)

    # 添加新点 (3:1)
    x_cell = workbook.getCell(default_worksheet_index, 3, 3, 3)
    y_cell = workbook.getCell(default_worksheet_index, 3, 4, 1)
    series.getDataPoints().addDataPointForScatterSeries(x_cell, y_cell)

    # 添加新点 (2:2)
    x_cell = workbook.getCell(default_worksheet_index, 4, 3, 2)
    y_cell = workbook.getCell(default_worksheet_index, 4, 4, 2)
    series.getDataPoints().addDataPointForScatterSeries(x_cell, y_cell)

    # 添加新点 (5:1)
    x_cell = workbook.getCell(default_worksheet_index, 5, 3, 5)
    y_cell = workbook.getCell(default_worksheet_index, 5, 4, 1)
    series.getDataPoints().addDataPointForScatterSeries(x_cell, y_cell)

    # 更改图表系列标记
    series.getMarker().setSize(10)
    series.getMarker().setSymbol(MarkerStyleType.Circle)

    presentation.save("AsposeChart_out.pptx", SaveFormat.Pptx)
finally:
    presentation.dispose()
创建饼图
饼图最适合用于显示数据中的部分与整体关系,尤其是当数据包含带数值的分类标签时。如果您的数据包含许多部分或标签,建议考虑使用条形图。
- 创建一个 Presentation 类的实例。
- 使用索引获取幻灯片的引用。
- 添加一个带有默认数据的图表,并指定 ChartType.Pie 类型。
- 访问图表数据工作簿 ChartDataWorkbook。
- 清除默认的系列和分类。
- 添加新的系列和分类。
- 为图表系列添加新的图表数据。
- 为饼图的各扇区添加新点并应用自定义颜色。
- 为系列设置标签。
- 为系列标签启用引线。
- 设置饼图扇区的旋转角度。
- 将修改后的演示文稿保存为 PPTX 文件。
下面的 Python 代码展示了如何创建饼图:
import jpype
import asposeslides

if not jpype.isJVMStarted():
    jpype.startJVM()

from asposeslides.api import ChartType, FillType, LineDashStyle, LineStyle, NullableBool, Presentation, SaveFormat

Color = jpype.JClass("java.awt.Color")

# 实例化一个表示 PPTX 文件的演示文稿类。
presentation = Presentation()
try:
    # 访问第一张幻灯片
    slide = presentation.getSlides().get_Item(0)

    # 添加一个带有默认数据的图表
    chart = slide.getShapes().addChart(ChartType.Pie, 100, 100, 400, 400)

    # 设置图表标题
    chart.getChartTitle().addTextFrameForOverriding("Sample Title")
    chart.getChartTitle().getTextFrameForOverriding().getTextFrameFormat().setCenterText(NullableBool.True_)
    chart.getChartTitle().setHeight(20)
    chart.setTitle(True)

    # 设置图表数据工作表的索引
    default_worksheet_index = 0

    # 获取图表数据工作表
    workbook = chart.getChartData().getChartDataWorkbook()

    # 删除默认生成的系列和分类
    chart.getChartData().getSeries().clear()
    chart.getChartData().getCategories().clear()

    # 添加新分类
    cell = workbook.getCell(0, 1, 0, "First Qtr")
    chart.getChartData().getCategories().add(cell)
    cell = workbook.getCell(0, 2, 0, "2nd Qtr")
    chart.getChartData().getCategories().add(cell)
    cell = workbook.getCell(0, 3, 0, "3rd Qtr")
    chart.getChartData().getCategories().add(cell)

    # 添加新系列
    cell = workbook.getCell(0, 0, 1, "Series 1")
    series = chart.getChartData().getSeries().add(cell, chart.getType())

    #填充系列数据
    cell = workbook.getCell(default_worksheet_index, 1, 1, 20)
    series.getDataPoints().addDataPointForPieSeries(cell)
    cell = workbook.getCell(default_worksheet_index, 2, 1, 50)
    series.getDataPoints().addDataPointForPieSeries(cell)
    cell = workbook.getCell(default_worksheet_index, 3, 1, 30)
    series.getDataPoints().addDataPointForPieSeries(cell)

    # 添加新点并设置扇区颜色
    chart.getChartData().getSeriesGroups().get_Item(0).setColorVaried(True)

    point = series.getDataPoints().get_Item(0)
    point.getFormat().getFill().setFillType(FillType.Solid)
    point.getFormat().getFill().getSolidFillColor().setColor(Color.CYAN)

    # 设置扇区边框
    point.getFormat().getLine().getFillFormat().setFillType(FillType.Solid)
    point.getFormat().getLine().getFillFormat().getSolidFillColor().setColor(Color.GRAY)
    point.getFormat().getLine().setWidth(3.0)
    point.getFormat().getLine().setStyle(LineStyle.ThinThick)
    point.getFormat().getLine().setDashStyle(LineDashStyle.DashDot)

    second_point = series.getDataPoints().get_Item(1)
    second_point.getFormat().getFill().setFillType(FillType.Solid)
    second_point.getFormat().getFill().getSolidFillColor().setColor(Color.ORANGE)

    # 设置扇区边框
    second_point.getFormat().getLine().getFillFormat().setFillType(FillType.Solid)
    second_point.getFormat().getLine().getFillFormat().getSolidFillColor().setColor(Color.BLUE)
    second_point.getFormat().getLine().setWidth(3.0)
    second_point.getFormat().getLine().setStyle(LineStyle.Single)
    second_point.getFormat().getLine().setDashStyle(LineDashStyle.LargeDashDot)

    third_point = series.getDataPoints().get_Item(2)
    third_point.getFormat().getFill().setFillType(FillType.Solid)
    third_point.getFormat().getFill().getSolidFillColor().setColor(Color.YELLOW)

    # 设置扇区边框
    third_point.getFormat().getLine().getFillFormat().setFillType(FillType.Solid)
    third_point.getFormat().getLine().getFillFormat().getSolidFillColor().setColor(Color.RED)
    third_point.getFormat().getLine().setWidth(2.0)
    third_point.getFormat().getLine().setStyle(LineStyle.ThinThin)
    third_point.getFormat().getLine().setDashStyle(LineDashStyle.LargeDashDotDot)

    # 为新系列的每个分类创建自定义标签
    first_label = series.getDataPoints().get_Item(0).getLabel()

    first_label.getDataLabelFormat().setShowValue(True)

    second_label = series.getDataPoints().get_Item(1).getLabel()
    second_label.getDataLabelFormat().setShowValue(True)
    second_label.getDataLabelFormat().setShowLegendKey(True)
    second_label.getDataLabelFormat().setShowPercentage(True)

    third_label = series.getDataPoints().get_Item(2).getLabel()
    third_label.getDataLabelFormat().setShowSeriesName(True)
    third_label.getDataLabelFormat().setShowPercentage(True)

    # 显示图表的引导线
    series.getLabels().getDefaultDataLabelFormat().setShowLeaderLines(True)

    # 设置饼图扇区的旋转角度
    chart.getChartData().getSeriesGroups().get_Item(0).setFirstSliceAngle(180)

    # 保存包含图表的演示文稿
    presentation.save("PieChart_out.pptx", SaveFormat.Pptx)
finally:
    presentation.dispose()
创建折线图
折线图(也称为折线图)最适合用于展示随时间变化的数值。在折线图中,您可以一次比较大量数据、跟踪随时间的变化和趋势、突出数据系列中的异常等。
- 创建一个 Presentation 类的实例。
- 使用索引获取幻灯片的引用。
- 添加一个带有默认数据的图表,并指定 ChartType.Line 类型。
- 将修改后的演示文稿保存为 PPTX 文件。
下面的 Python 代码展示了如何创建折线图:
import jpype
import asposeslides

if not jpype.isJVMStarted():
    jpype.startJVM()

from asposeslides.api import ChartType, Presentation, SaveFormat

presentation = Presentation()
try:
    line_chart = presentation.getSlides().get_Item(0).getShapes().addChart(ChartType.Line, 10, 50, 600, 350)

    presentation.save("line_chart.pptx", SaveFormat.Pptx)
finally:
    presentation.dispose()
默认情况下,折线图的点通过直线连续相连。如果您希望点之间使用虚线而非实线,可以按如下方式指定首选的虚线类型:
import jpype
import asposeslides

if not jpype.isJVMStarted():
    jpype.startJVM()

from asposeslides.api import ChartType, LineDashStyle, Presentation, SaveFormat

presentation = Presentation()
try:
    line_chart = presentation.getSlides().get_Item(0).getShapes().addChart(ChartType.Line, 10, 50, 600, 350)

    for series in line_chart.getChartData().getSeries():
        series.getFormat().getLine().setDashStyle(LineDashStyle.Dash)

    presentation.save("line_chart.pptx", SaveFormat.Pptx)
finally:
    presentation.dispose()
创建树形图
树形图在您需要展示数据类别的相对大小并快速突出每个类别中贡献大的项时最为合适,尤其适用于销售数据。
- 创建一个 Presentation 类的实例。
- 使用索引获取幻灯片的引用。
- 添加一个带有默认数据的图表,并指定 ChartType.Treemap 类型。
- 访问图表数据工作簿 ChartDataWorkbook。
- 清除默认的系列和分类。
- 添加新的系列和分类。
- 为图表系列添加新的图表数据。
- 将修改后的演示文稿保存为 PPTX 文件。
下面的 Python 代码展示了如何创建树形图:
import jpype
import asposeslides

if not jpype.isJVMStarted():
    jpype.startJVM()

from asposeslides.api import ChartType, ParentLabelLayoutType, Presentation, SaveFormat

presentation = Presentation()
try:
    chart = presentation.getSlides().get_Item(0).getShapes().addChart(ChartType.Treemap, 50, 50, 500, 400)
    chart.getChartData().getCategories().clear()
    chart.getChartData().getSeries().clear()

    workbook = chart.getChartData().getChartDataWorkbook()
    workbook.clear(0)

    #分支 1
    cell = workbook.getCell(0, "C1", "Leaf1")
    leaf = chart.getChartData().getCategories().add(cell)
    leaf.getGroupingLevels().setGroupingItem(1, "Stem1")
    leaf.getGroupingLevels().setGroupingItem(2, "Branch1")

    cell = workbook.getCell(0, "C2", "Leaf2")
    chart.getChartData().getCategories().add(cell)

    cell = workbook.getCell(0, "C3", "Leaf3")
    leaf = chart.getChartData().getCategories().add(cell)
    leaf.getGroupingLevels().setGroupingItem(1, "Stem2")

    cell = workbook.getCell(0, "C4", "Leaf4")
    chart.getChartData().getCategories().add(cell)

    #分支 2
    cell = workbook.getCell(0, "C5", "Leaf5")
    leaf = chart.getChartData().getCategories().add(cell)
    leaf.getGroupingLevels().setGroupingItem(1, "Stem3")
    leaf.getGroupingLevels().setGroupingItem(2, "Branch2")

    cell = workbook.getCell(0, "C6", "Leaf6")
    chart.getChartData().getCategories().add(cell)

    cell = workbook.getCell(0, "C7", "Leaf7")
    leaf = chart.getChartData().getCategories().add(cell)
    leaf.getGroupingLevels().setGroupingItem(1, "Stem4")

    cell = workbook.getCell(0, "C8", "Leaf8")
    chart.getChartData().getCategories().add(cell)

    series = chart.getChartData().getSeries().add(ChartType.Treemap)
    series.getLabels().getDefaultDataLabelFormat().setShowCategoryName(True)
    cell = workbook.getCell(0, "D1", 4)
    series.getDataPoints().addDataPointForTreemapSeries(cell)
    cell = workbook.getCell(0, "D2", 5)
    series.getDataPoints().addDataPointForTreemapSeries(cell)
    cell = workbook.getCell(0, "D3", 3)
    series.getDataPoints().addDataPointForTreemapSeries(cell)
    cell = workbook.getCell(0, "D4", 6)
    series.getDataPoints().addDataPointForTreemapSeries(cell)
    cell = workbook.getCell(0, "D5", 9)
    series.getDataPoints().addDataPointForTreemapSeries(cell)
    cell = workbook.getCell(0, "D6", 9)
    series.getDataPoints().addDataPointForTreemapSeries(cell)
    cell = workbook.getCell(0, "D7", 4)
    series.getDataPoints().addDataPointForTreemapSeries(cell)
    cell = workbook.getCell(0, "D8", 3)
    series.getDataPoints().addDataPointForTreemapSeries(cell)

    series.setParentLabelLayout(ParentLabelLayoutType.Overlapping)

    presentation.save("Treemap.pptx", SaveFormat.Pptx)
finally:
    presentation.dispose()
创建股票图
- 创建一个 Presentation 类的实例。
- 使用索引获取幻灯片的引用。
- 添加一个带有默认数据的图表,并指定 ChartType.OpenHighLowClose 类型。
- 访问图表数据工作簿 ChartDataWorkbook。
- 清除默认的系列和分类。
- 添加新的系列和分类。
- 为图表系列添加新的图表数据。
- 指定高低线的格式。
- 将修改后的演示文稿保存为 PPTX 文件。
下面的 Python 代码展示了如何创建股票图:
import jpype
import asposeslides

if not jpype.isJVMStarted():
    jpype.startJVM()

from asposeslides.api import ChartType, FillType, Presentation, SaveFormat

presentation = Presentation()
try:
    chart = presentation.getSlides().get_Item(0).getShapes().addChart(ChartType.OpenHighLowClose, 50, 50, 600, 400, False)

    chart.getChartData().getSeries().clear()
    chart.getChartData().getCategories().clear()

    workbook = chart.getChartData().getChartDataWorkbook()

    cell = workbook.getCell(0, 1, 0, "A")
    chart.getChartData().getCategories().add(cell)
    cell = workbook.getCell(0, 2, 0, "B")
    chart.getChartData().getCategories().add(cell)
    cell = workbook.getCell(0, 3, 0, "C")
    chart.getChartData().getCategories().add(cell)

    cell = workbook.getCell(0, 0, 1, "Open")
    chart.getChartData().getSeries().add(cell, chart.getType())
    cell = workbook.getCell(0, 0, 2, "High")
    chart.getChartData().getSeries().add(cell, chart.getType())
    cell = workbook.getCell(0, 0, 3, "Low")
    chart.getChartData().getSeries().add(cell, chart.getType())
    cell = workbook.getCell(0, 0, 4, "Close")
    chart.getChartData().getSeries().add(cell, chart.getType())

    series = chart.getChartData().getSeries().get_Item(0)

    cell = workbook.getCell(0, 1, 1, 72)
    series.getDataPoints().addDataPointForStockSeries(cell)
    cell = workbook.getCell(0, 2, 1, 25)
    series.getDataPoints().addDataPointForStockSeries(cell)
    cell = workbook.getCell(0, 3, 1, 38)
    series.getDataPoints().addDataPointForStockSeries(cell)

    series = chart.getChartData().getSeries().get_Item(1)
    cell = workbook.getCell(0, 1, 2, 172)
    series.getDataPoints().addDataPointForStockSeries(cell)
    cell = workbook.getCell(0, 2, 2, 57)
    series.getDataPoints().addDataPointForStockSeries(cell)
    cell = workbook.getCell(0, 3, 2, 57)
    series.getDataPoints().addDataPointForStockSeries(cell)

    series = chart.getChartData().getSeries().get_Item(2)
    cell = workbook.getCell(0, 1, 3, 12)
    series.getDataPoints().addDataPointForStockSeries(cell)
    cell = workbook.getCell(0, 2, 3, 12)
    series.getDataPoints().addDataPointForStockSeries(cell)
    cell = workbook.getCell(0, 3, 3, 13)
    series.getDataPoints().addDataPointForStockSeries(cell)

    series = chart.getChartData().getSeries().get_Item(3)
    cell = workbook.getCell(0, 1, 4, 25)
    series.getDataPoints().addDataPointForStockSeries(cell)
    cell = workbook.getCell(0, 2, 4, 38)
    series.getDataPoints().addDataPointForStockSeries(cell)
    cell = workbook.getCell(0, 3, 4, 50)
    series.getDataPoints().addDataPointForStockSeries(cell)

    chart.getChartData().getSeriesGroups().get_Item(0).getUpDownBars().setUpDownBars(True)
    chart.getChartData().getSeriesGroups().get_Item(0).getHiLowLinesFormat().getLine().getFillFormat().setFillType(FillType.Solid)

    for series in chart.getChartData().getSeries():
        series.getFormat().getLine().getFillFormat().setFillType(FillType.NoFill)

    presentation.save("output.pptx", SaveFormat.Pptx)
finally:
    presentation.dispose()
创建箱线图
- 创建一个 Presentation 类的实例。
- 使用索引获取幻灯片的引用。
- 添加一个带有默认数据的图表,并指定 ChartType.BoxAndWhisker 类型。
- 访问图表数据工作簿 ChartDataWorkbook。
- 清除默认的系列和分类。
- 添加新的系列和分类。
- 为图表系列添加新的图表数据。
- 将修改后的演示文稿保存为 PPTX 文件。
下面的 Python 代码展示了如何创建箱线图:
import jpype
import asposeslides

if not jpype.isJVMStarted():
    jpype.startJVM()

from asposeslides.api import ChartType, Presentation, QuartileMethodType, SaveFormat

presentation = Presentation()
try:
    chart = presentation.getSlides().get_Item(0).getShapes().addChart(ChartType.BoxAndWhisker, 50, 50, 500, 400)
    chart.getChartData().getCategories().clear()
    chart.getChartData().getSeries().clear()

    workbook = chart.getChartData().getChartDataWorkbook()
    workbook.clear(0)

    cell = workbook.getCell(0, "A1", "Category 1")
    chart.getChartData().getCategories().add(cell)
    cell = workbook.getCell(0, "A2", "Category 1")
    chart.getChartData().getCategories().add(cell)
    cell = workbook.getCell(0, "A3", "Category 1")
    chart.getChartData().getCategories().add(cell)
    cell = workbook.getCell(0, "A4", "Category 1")
    chart.getChartData().getCategories().add(cell)
    cell = workbook.getCell(0, "A5", "Category 1")
    chart.getChartData().getCategories().add(cell)
    cell = workbook.getCell(0, "A6", "Category 1")
    chart.getChartData().getCategories().add(cell)

    series = chart.getChartData().getSeries().add(ChartType.BoxAndWhisker)

    series.setQuartileMethod(QuartileMethodType.Exclusive)
    series.setShowMeanLine(True)
    series.setShowMeanMarkers(True)
    series.setShowInnerPoints(True)
    series.setShowOutlierPoints(True)

    cell = workbook.getCell(0, "B1", 15)
    series.getDataPoints().addDataPointForBoxAndWhiskerSeries(cell)
    cell = workbook.getCell(0, "B2", 41)
    series.getDataPoints().addDataPointForBoxAndWhiskerSeries(cell)
    cell = workbook.getCell(0, "B3", 16)
    series.getDataPoints().addDataPointForBoxAndWhiskerSeries(cell)
    cell = workbook.getCell(0, "B4", 10)
    series.getDataPoints().addDataPointForBoxAndWhiskerSeries(cell)
    cell = workbook.getCell(0, "B5", 23)
    series.getDataPoints().addDataPointForBoxAndWhiskerSeries(cell)
    cell = workbook.getCell(0, "B6", 16)
    series.getDataPoints().addDataPointForBoxAndWhiskerSeries(cell)

    presentation.save("BoxAndWhisker.pptx", SaveFormat.Pptx)
finally:
    presentation.dispose()
创建漏斗图
- 创建一个 Presentation 类的实例。
- 使用索引获取幻灯片的引用。
- 添加一个带有默认数据的图表,并指定 ChartType.Funnel 类型。
- 将修改后的演示文稿保存为 PPTX 文件。
下面的 Python 代码展示了如何创建漏斗图:
import jpype
import asposeslides

if not jpype.isJVMStarted():
    jpype.startJVM()

from asposeslides.api import ChartType, Presentation, SaveFormat

presentation = Presentation()
try:
    chart = presentation.getSlides().get_Item(0).getShapes().addChart(ChartType.Funnel, 50, 50, 500, 400)
    chart.getChartData().getCategories().clear()
    chart.getChartData().getSeries().clear()

    workbook = chart.getChartData().getChartDataWorkbook()

    workbook.clear(0)

    cell = workbook.getCell(0, "A1", "Category 1")
    chart.getChartData().getCategories().add(cell)
    cell = workbook.getCell(0, "A2", "Category 2")
    chart.getChartData().getCategories().add(cell)
    cell = workbook.getCell(0, "A3", "Category 3")
    chart.getChartData().getCategories().add(cell)
    cell = workbook.getCell(0, "A4", "Category 4")
    chart.getChartData().getCategories().add(cell)
    cell = workbook.getCell(0, "A5", "Category 5")
    chart.getChartData().getCategories().add(cell)
    cell = workbook.getCell(0, "A6", "Category 6")
    chart.getChartData().getCategories().add(cell)

    series = chart.getChartData().getSeries().add(ChartType.Funnel)

    cell = workbook.getCell(0, "B1", 50)
    series.getDataPoints().addDataPointForFunnelSeries(cell)
    cell = workbook.getCell(0, "B2", 100)
    series.getDataPoints().addDataPointForFunnelSeries(cell)
    cell = workbook.getCell(0, "B3", 200)
    series.getDataPoints().addDataPointForFunnelSeries(cell)
    cell = workbook.getCell(0, "B4", 300)
    series.getDataPoints().addDataPointForFunnelSeries(cell)
    cell = workbook.getCell(0, "B5", 400)
    series.getDataPoints().addDataPointForFunnelSeries(cell)
    cell = workbook.getCell(0, "B6", 500)
    series.getDataPoints().addDataPointForFunnelSeries(cell)

    presentation.save("Funnel.pptx", SaveFormat.Pptx)
finally:
    presentation.dispose()
创建旭辉图
- 创建一个 Presentation 类的实例。
- 使用索引获取幻灯片的引用。
- 添加一个带有默认数据的图表,并指定 ChartType.Sunburst 类型。
- 将修改后的演示文稿保存为 PPTX 文件。
下面的 Python 代码展示了如何创建旭辉图:
import jpype
import asposeslides

if not jpype.isJVMStarted():
    jpype.startJVM()

from asposeslides.api import ChartType, Presentation, SaveFormat

presentation = Presentation()
try:
    chart = presentation.getSlides().get_Item(0).getShapes().addChart(ChartType.Sunburst, 50, 50, 500, 400)
    chart.getChartData().getCategories().clear()
    chart.getChartData().getSeries().clear()

    workbook = chart.getChartData().getChartDataWorkbook()
    workbook.clear(0)

    #分支 1
    cell = workbook.getCell(0, "C1", "Leaf1")
    leaf = chart.getChartData().getCategories().add(cell)
    leaf.getGroupingLevels().setGroupingItem(1, "Stem1")
    leaf.getGroupingLevels().setGroupingItem(2, "Branch1")

    cell = workbook.getCell(0, "C2", "Leaf2")
    chart.getChartData().getCategories().add(cell)

    cell = workbook.getCell(0, "C3", "Leaf3")
    leaf = chart.getChartData().getCategories().add(cell)
    leaf.getGroupingLevels().setGroupingItem(1, "Stem2")

    cell = workbook.getCell(0, "C4", "Leaf4")
    chart.getChartData().getCategories().add(cell)

    #分支 2
    cell = workbook.getCell(0, "C5", "Leaf5")
    leaf = chart.getChartData().getCategories().add(cell)
    leaf.getGroupingLevels().setGroupingItem(1, "Stem3")
    leaf.getGroupingLevels().setGroupingItem(2, "Branch2")

    cell = workbook.getCell(0, "C6", "Leaf6")
    chart.getChartData().getCategories().add(cell)

    cell = workbook.getCell(0, "C7", "Leaf7")
    leaf = chart.getChartData().getCategories().add(cell)
    leaf.getGroupingLevels().setGroupingItem(1, "Stem4")

    cell = workbook.getCell(0, "C8", "Leaf8")
    chart.getChartData().getCategories().add(cell)

    series = chart.getChartData().getSeries().add(ChartType.Sunburst)
    series.getLabels().getDefaultDataLabelFormat().setShowCategoryName(True)
    cell = workbook.getCell(0, "D1", 4)
    series.getDataPoints().addDataPointForSunburstSeries(cell)
    cell = workbook.getCell(0, "D2", 5)
    series.getDataPoints().addDataPointForSunburstSeries(cell)
    cell = workbook.getCell(0, "D3", 3)
    series.getDataPoints().addDataPointForSunburstSeries(cell)
    cell = workbook.getCell(0, "D4", 6)
    series.getDataPoints().addDataPointForSunburstSeries(cell)
    cell = workbook.getCell(0, "D5", 9)
    series.getDataPoints().addDataPointForSunburstSeries(cell)
    cell = workbook.getCell(0, "D6", 9)
    series.getDataPoints().addDataPointForSunburstSeries(cell)
    cell = workbook.getCell(0, "D7", 4)
    series.getDataPoints().addDataPointForSunburstSeries(cell)
    cell = workbook.getCell(0, "D8", 3)
    series.getDataPoints().addDataPointForSunburstSeries(cell)

    presentation.save("Sunburst.pptx", SaveFormat.Pptx)
finally:
    presentation.dispose()
创建直方图
- 创建一个 Presentation 类的实例。
- 使用索引获取幻灯片的引用。
- 添加一个带有默认数据的图表,并指定 ChartType.Histogram 类型。
- 访问图表数据工作簿 ChartDataWorkbook。
- 清除默认的系列和分类。
- 添加新的系列和分类。
- 将修改后的演示文稿保存为 PPTX 文件。
下面的 Python 代码展示了如何创建直方图:
import jpype
import asposeslides

if not jpype.isJVMStarted():
    jpype.startJVM()

from asposeslides.api import AxisAggregationType, ChartType, Presentation, SaveFormat

presentation = Presentation()
try:
    chart = presentation.getSlides().get_Item(0).getShapes().addChart(ChartType.Histogram, 50, 50, 500, 400)
    chart.getChartData().getCategories().clear()
    chart.getChartData().getSeries().clear()

    workbook = chart.getChartData().getChartDataWorkbook()
    workbook.clear(0)

    series = chart.getChartData().getSeries().add(ChartType.Histogram)
    cell = workbook.getCell(0, "A1", 15)
    series.getDataPoints().addDataPointForHistogramSeries(cell)
    cell = workbook.getCell(0, "A2", -41)
    series.getDataPoints().addDataPointForHistogramSeries(cell)
    cell = workbook.getCell(0, "A3", 16)
    series.getDataPoints().addDataPointForHistogramSeries(cell)
    cell = workbook.getCell(0, "A4", 10)
    series.getDataPoints().addDataPointForHistogramSeries(cell)
    cell = workbook.getCell(0, "A5", -23)
    series.getDataPoints().addDataPointForHistogramSeries(cell)
    cell = workbook.getCell(0, "A6", 16)
    series.getDataPoints().addDataPointForHistogramSeries(cell)

    chart.getAxes().getHorizontalAxis().setAggregationType(AxisAggregationType.Automatic)

    presentation.save("Histogram.pptx", SaveFormat.Pptx)
finally:
    presentation.dispose()
创建雷达图
- 创建一个 Presentation 类的实例。
- 使用索引获取幻灯片的引用。
- 添加一个带有数据的图表,并将图表类型指定为您偏好的类型(此处为 ChartType.Radar)。
- 将修改后的演示文稿保存为 PPTX 文件。
下面的 Python 代码展示了如何创建雷达图:
import jpype
import asposeslides

if not jpype.isJVMStarted():
    jpype.startJVM()

from asposeslides.api import ChartType, Presentation, SaveFormat

presentation = Presentation()
try:
    presentation.getSlides().get_Item(0).getShapes().addChart(ChartType.Radar, 20, 20, 400, 300)
    presentation.save("Radar-chart.pptx", SaveFormat.Pptx)
finally:
    presentation.dispose()
创建多分类图表
- 创建一个 Presentation 类的实例。
- 使用索引获取幻灯片的引用。
- 添加一个带有默认数据的图表,并指定 ChartType.ClusteredColumn 类型。
- 访问图表数据工作簿 ChartDataWorkbook。
- 清除默认的系列和分类。
- 添加新的系列和分类。
- 为图表系列添加新的图表数据。
- 将修改后的演示文稿保存为 PPTX 文件。
下面的 Python 代码展示了如何创建多分类图表:
import jpype
import asposeslides

if not jpype.isJVMStarted():
    jpype.startJVM()

from asposeslides.api import ChartType, Presentation, SaveFormat

presentation = Presentation()
try:
    chart = presentation.getSlides().get_Item(0).getShapes().addChart(ChartType.ClusteredColumn, 100, 100, 600, 450)
    chart.getChartData().getSeries().clear()
    chart.getChartData().getCategories().clear()

    workbook = chart.getChartData().getChartDataWorkbook()
    workbook.clear(0)
    default_worksheet_index = 0

    cell = workbook.getCell(0, "c2", "A")
    category = chart.getChartData().getCategories().add(cell)
    category.getGroupingLevels().setGroupingItem(1, "Group1")
    cell = workbook.getCell(0, "c3", "B")
    category = chart.getChartData().getCategories().add(cell)

    cell = workbook.getCell(0, "c4", "C")
    category = chart.getChartData().getCategories().add(cell)
    category.getGroupingLevels().setGroupingItem(1, "Group2")
    cell = workbook.getCell(0, "c5", "D")
    category = chart.getChartData().getCategories().add(cell)

    cell = workbook.getCell(0, "c6", "E")
    category = chart.getChartData().getCategories().add(cell)
    category.getGroupingLevels().setGroupingItem(1, "Group3")
    cell = workbook.getCell(0, "c7", "F")
    category = chart.getChartData().getCategories().add(cell)

    cell = workbook.getCell(0, "c8", "G")
    category = chart.getChartData().getCategories().add(cell)
    category.getGroupingLevels().setGroupingItem(1, "Group4")
    cell = workbook.getCell(0, "c9", "H")
    category = chart.getChartData().getCategories().add(cell)

    # 添加系列
    cell = workbook.getCell(0, "D1", "Series 1")
    series = chart.getChartData().getSeries().add(cell, ChartType.ClusteredColumn)

    cell = workbook.getCell(default_worksheet_index, "D2", 10)
    series.getDataPoints().addDataPointForBarSeries(cell)
    cell = workbook.getCell(default_worksheet_index, "D3", 20)
    series.getDataPoints().addDataPointForBarSeries(cell)
    cell = workbook.getCell(default_worksheet_index, "D4", 30)
    series.getDataPoints().addDataPointForBarSeries(cell)
    cell = workbook.getCell(default_worksheet_index, "D5", 40)
    series.getDataPoints().addDataPointForBarSeries(cell)
    cell = workbook.getCell(default_worksheet_index, "D6", 50)
    series.getDataPoints().addDataPointForBarSeries(cell)
    cell = workbook.getCell(default_worksheet_index, "D7", 60)
    series.getDataPoints().addDataPointForBarSeries(cell)
    cell = workbook.getCell(default_worksheet_index, "D8", 70)
    series.getDataPoints().addDataPointForBarSeries(cell)
    cell = workbook.getCell(default_worksheet_index, "D9", 80)
    series.getDataPoints().addDataPointForBarSeries(cell)

    # 保存包含图表的演示文稿
    presentation.save("AsposeChart_out.pptx", SaveFormat.Pptx)
finally:
    presentation.dispose()
创建地图图表
地图图表可视化地理数据,并帮助比较各地区的数值。
下面的 Python 代码展示了如何创建地图图表:
import jpype
import asposeslides

if not jpype.isJVMStarted():
    jpype.startJVM()

from asposeslides.api import ChartType, Presentation, SaveFormat

presentation = Presentation()
try:
    chart = presentation.getSlides().get_Item(0).getShapes().addChart(ChartType.Map, 50, 50, 500, 400)
    presentation.save("mapChart.pptx", SaveFormat.Pptx)
finally:
    presentation.dispose()
创建组合图表
组合图(或称为复合图)在同一图形中结合两种或多种图表类型。该图表可帮助您突出、比较或检查两个或多个数据集之间的差异,从而识别它们之间的关系。
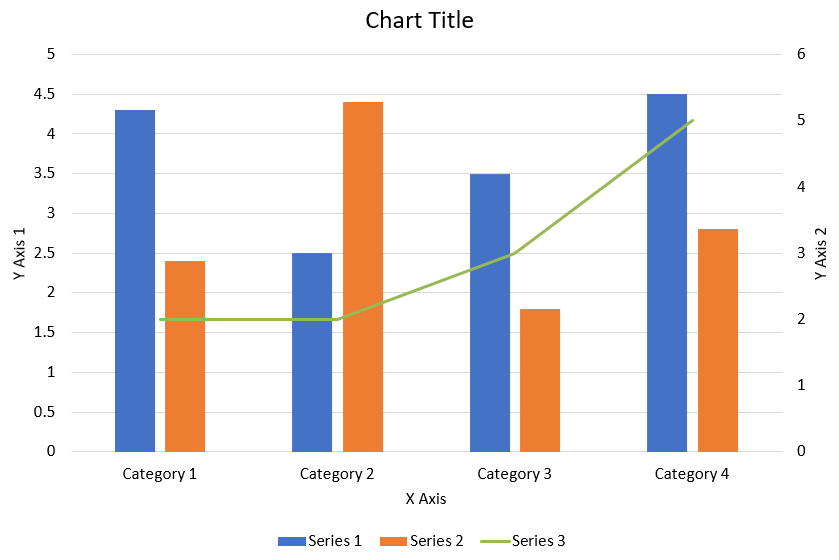
下面的 Python 代码展示了如何在 PowerPoint 演示文稿中创建如上所示的组合图表:
import jpype
import asposeslides

if not jpype.isJVMStarted():
    jpype.startJVM()

from asposeslides.api import AxisPositionType, ChartType, CrossesType, FillType, LegendPositionType, NullableBool, Presentation, SaveFormat

Color = jpype.JClass("java.awt.Color")

def create_combo_chart():
    presentation = Presentation()
    slide = presentation.getSlides().get_Item(0)
    try:
        chart = create_chart_with_first_series(slide)

        add_second_series_to_chart(chart)
        add_third_series_to_chart(chart)

        set_primary_axes_format(chart)
        set_secondary_axes_format(chart)

        presentation.save("combo-chart.pptx", SaveFormat.Pptx)
    finally:
        presentation.dispose()

def create_chart_with_first_series(slide):
    chart = slide.getShapes().addChart(ChartType.ClusteredColumn, 50, 50, 600, 400)

    # 设置图表标题。
    chart.setTitle(True)
    chart.getChartTitle().addTextFrameForOverriding("Chart Title")
    chart.getChartTitle().setOverlay(False)
    title_paragraph = chart.getChartTitle().getTextFrameForOverriding().getParagraphs().get_Item(0)
    title_format = title_paragraph.getParagraphFormat().getDefaultPortionFormat()
    title_format.setFontBold(NullableBool.False_)
    title_format.setFontHeight(18.0)

    # 设置图表图例。
    chart.getLegend().setPosition(LegendPositionType.Bottom)
    chart.getLegend().getTextFormat().getPortionFormat().setFontHeight(12.0)

    # 删除默认生成的系列和分类。
    chart.getChartData().getSeries().clear()
    chart.getChartData().getCategories().clear()

    worksheet_index = 0
    workbook = chart.getChartData().getChartDataWorkbook()

    # 添加新分类。
    cell = workbook.getCell(worksheet_index, 1, 0, "Category 1")
    chart.getChartData().getCategories().add(cell)
    cell = workbook.getCell(worksheet_index, 2, 0, "Category 2")
    chart.getChartData().getCategories().add(cell)
    cell = workbook.getCell(worksheet_index, 3, 0, "Category 3")
    chart.getChartData().getCategories().add(cell)
    cell = workbook.getCell(worksheet_index, 4, 0, "Category 4")
    chart.getChartData().getCategories().add(cell)

    # 添加第一条系列。
    series_name_cell = workbook.getCell(worksheet_index, 0, 1, "Series 1")
    series = chart.getChartData().getSeries().add(series_name_cell, chart.getType())

    series.getParentSeriesGroup().setOverlap(jpype.JByte(-25))
    series.getParentSeriesGroup().setGapWidth(220)

    cell = workbook.getCell(worksheet_index, 1, 1, 4.3)
    series.getDataPoints().addDataPointForBarSeries(cell)
    cell = workbook.getCell(worksheet_index, 2, 1, 2.5)
    series.getDataPoints().addDataPointForBarSeries(cell)
    cell = workbook.getCell(worksheet_index, 3, 1, 3.5)
    series.getDataPoints().addDataPointForBarSeries(cell)
    cell = workbook.getCell(worksheet_index, 4, 1, 4.5)
    series.getDataPoints().addDataPointForBarSeries(cell)

    return chart

def add_second_series_to_chart(chart):
    workbook = chart.getChartData().getChartDataWorkbook()
    worksheet_index = 0

    series_name_cell = workbook.getCell(worksheet_index, 0, 2, "Series 2")
    series = chart.getChartData().getSeries().add(series_name_cell, ChartType.ClusteredColumn)

    series.getParentSeriesGroup().setOverlap(jpype.JByte(-25))
    series.getParentSeriesGroup().setGapWidth(220)

    cell = workbook.getCell(worksheet_index, 1, 2, 2.4)
    series.getDataPoints().addDataPointForBarSeries(cell)
    cell = workbook.getCell(worksheet_index, 2, 2, 4.4)
    series.getDataPoints().addDataPointForBarSeries(cell)
    cell = workbook.getCell(worksheet_index, 3, 2, 1.8)
    series.getDataPoints().addDataPointForBarSeries(cell)
    cell = workbook.getCell(worksheet_index, 4, 2, 2.8)
    series.getDataPoints().addDataPointForBarSeries(cell)

def add_third_series_to_chart(chart):
    workbook = chart.getChartData().getChartDataWorkbook()
    worksheet_index = 0

    series_name_cell = workbook.getCell(worksheet_index, 0, 3, "Series 3")
    series = chart.getChartData().getSeries().add(series_name_cell, ChartType.Line)

    cell = workbook.getCell(worksheet_index, 1, 3, 2.0)
    series.getDataPoints().addDataPointForLineSeries(cell)
    cell = workbook.getCell(worksheet_index, 2, 3, 2.0)
    series.getDataPoints().addDataPointForLineSeries(cell)
    cell = workbook.getCell(worksheet_index, 3, 3, 3.0)
    series.getDataPoints().addDataPointForLineSeries(cell)
    cell = workbook.getCell(worksheet_index, 4, 3, 5.0)
    series.getDataPoints().addDataPointForLineSeries(cell)

    series.setPlotOnSecondAxis(True)

def set_primary_axes_format(chart):
    # 设置水平坐标轴。
    horizontal_axis = chart.getAxes().getHorizontalAxis()
    horizontal_axis.getTextFormat().getPortionFormat().setFontHeight(12.0)
    horizontal_axis.getFormat().getLine().getFillFormat().setFillType(FillType.NoFill)

    set_axis_title(horizontal_axis, "X Axis")

    # 设置垂直坐标轴。
    vertical_axis = chart.getAxes().getVerticalAxis()
    vertical_axis.getTextFormat().getPortionFormat().setFontHeight(12.0)
    vertical_axis.getFormat().getLine().getFillFormat().setFillType(FillType.NoFill)

    set_axis_title(vertical_axis, "Y Axis 1")

    # 设置垂直主网格线颜色。
    major_grid_lines_format = vertical_axis.getMajorGridLinesFormat().getLine().getFillFormat()
    major_grid_lines_format.setFillType(FillType.Solid)
    color = Color(217, 217, 217)
    major_grid_lines_format.getSolidFillColor().setColor(color)

def set_secondary_axes_format(chart):
    # 设置次要水平坐标轴。
    secondary_horizontal_axis = chart.getAxes().getSecondaryHorizontalAxis()
    secondary_horizontal_axis.setPosition(AxisPositionType.Bottom)
    secondary_horizontal_axis.setCrossType(CrossesType.Maximum)
    secondary_horizontal_axis.setVisible(False)
    secondary_horizontal_axis.getMajorGridLinesFormat().getLine().getFillFormat().setFillType(FillType.NoFill)
    secondary_horizontal_axis.getMinorGridLinesFormat().getLine().getFillFormat().setFillType(FillType.NoFill)

    # 设置次要垂直坐标轴。
    secondary_vertical_axis = chart.getAxes().getSecondaryVerticalAxis()
    secondary_vertical_axis.setPosition(AxisPositionType.Right)
    secondary_vertical_axis.getTextFormat().getPortionFormat().setFontHeight(12.0)
    secondary_vertical_axis.getFormat().getLine().getFillFormat().setFillType(FillType.NoFill)
    secondary_vertical_axis.getMajorGridLinesFormat().getLine().getFillFormat().setFillType(FillType.NoFill)
    secondary_vertical_axis.getMinorGridLinesFormat().getLine().getFillFormat().setFillType(FillType.NoFill)

    set_axis_title(secondary_vertical_axis, "Y Axis 2")

def set_axis_title(axis, axis_title):
    axis.setTitle(True)
    axis.getTitle().setOverlay(False)
    title_paragraph = axis.getTitle().addTextFrameForOverriding(axis_title).getParagraphs().get_Item(0)
    title_format = title_paragraph.getParagraphFormat().getDefaultPortionFormat()
    title_format.setFontBold(NullableBool.False_)
    title_format.setFontHeight(12.0)

create_combo_chart()
更新图表
- 创建一个表示包含要更新图表的演示文稿的 Presentation 类的实例。
- 使用索引获取幻灯片的引用。
- 遍历所有形状以找到目标图表。
- 访问图表的数据工作表。
- 通过更改系列值来修改图表数据系列。
- 添加新系列并填充其数据。
- 将修改后的演示文稿保存为 PPTX 文件。
下面的 Python 代码展示了如何更新图表:
import jpype
import asposeslides

if not jpype.isJVMStarted():
    jpype.startJVM()

from asposeslides.api import ChartType, Presentation, SaveFormat

# 打开包含要更新的图表的演示文稿
presentation = Presentation("ExistingChart.pptx")
try:
    # 访问第一张幻灯片
    slide = presentation.getSlides().get_Item(0)

    # 从幻灯片获取图表
    chart = slide.getShapes().get_Item(0)

    # 设置图表数据工作表的索引
    default_worksheet_index = 0

    # 获取图表数据工作表
    workbook = chart.getChartData().getChartDataWorkbook()

    # 更改图表分类名称
    workbook.getCell(default_worksheet_index, 1, 0, "Modified Category 1")
    workbook.getCell(default_worksheet_index, 2, 0, "Modified Category 2")

    # 获取第一条图表系列
    series = chart.getChartData().getSeries().get_Item(0)

    # 现在更新系列数据
    workbook.getCell(default_worksheet_index, 0, 1, "New_Series1")# 修改系列名称
    series.getDataPoints().get_Item(0).getValue().setData(90)
    series.getDataPoints().get_Item(1).getValue().setData(123)
    series.getDataPoints().get_Item(2).getValue().setData(44)

    # 获取第二条图表系列
    series = chart.getChartData().getSeries().get_Item(1)

    # 现在更新系列数据
    workbook.getCell(default_worksheet_index, 0, 2, "New_Series2")# 修改系列名称
    series.getDataPoints().get_Item(0).getValue().setData(23)
    series.getDataPoints().get_Item(1).getValue().setData(67)
    series.getDataPoints().get_Item(2).getValue().setData(99)

    # 现在,添加新系列
    cell = workbook.getCell(default_worksheet_index, 0, 3, "Series 3")
    chart.getChartData().getSeries().add(cell, chart.getType())

    # 获取第三条图表系列
    series = chart.getChartData().getSeries().get_Item(2)

    # 现在填充系列数据
    cell = workbook.getCell(default_worksheet_index, 1, 3, 20)
    series.getDataPoints().addDataPointForBarSeries(cell)
    cell = workbook.getCell(default_worksheet_index, 2, 3, 50)
    series.getDataPoints().addDataPointForBarSeries(cell)
    cell = workbook.getCell(default_worksheet_index, 3, 3, 30)
    series.getDataPoints().addDataPointForBarSeries(cell)

    chart.setType(ChartType.ClusteredCylinder)

    # 保存包含图表的演示文稿
    presentation.save("AsposeChartModified_out.pptx", SaveFormat.Pptx)
finally:
    presentation.dispose()
设置图表的数据范围
要为图表设置数据范围,请执行以下操作:
- 创建一个表示包含该图表的演示文稿的 Presentation 类的实例。
- 使用索引获取幻灯片的引用。
- 遍历所有形状以找到目标图表。
- 访问图表数据并设置范围。
- 将修改后的演示文稿保存为 PPTX 文件。
下面的 Python 代码展示了如何为图表设置数据范围:
import jpype
import asposeslides

if not jpype.isJVMStarted():
    jpype.startJVM()

from asposeslides.api import Presentation, SaveFormat

# 打开包含图表的演示文稿
presentation = Presentation("ExistingChart.pptx")
try:
    slide = presentation.getSlides().get_Item(0)
    chart = slide.getShapes().get_Item(0)

    chart.getChartData().setRange("Sheet1!A1:B4")

    presentation.save("SetDataRange_out.pptx", SaveFormat.Pptx)
finally:
    presentation.dispose()
在图表中使用默认标记
在图表中使用默认标记时,每个系列会自动获得不同的标记符号。
下面的 Python 代码展示了如何自动为图表系列设置标记:
import jpage
import asposeslides

if not jpype.isJVMStarted():
    jpype.startJVM()

from asposeslides.api import ChartType, Presentation, SaveFormat

presentation = Presentation()
try:
    slide = presentation.getSlides().get_Item(0)
    chart = slide.getShapes().addChart(ChartType.LineWithMarkers, 10, 10, 400, 400)

    chart.getChartData().getSeries().clear()
    chart.getChartData().getCategories().clear()

    workbook = chart.getChartData().getChartDataWorkbook()
    cell = workbook.getCell(0, 0, 1, "Series 1")
    chart.getChartData().getSeries().add(cell, chart.getType())
    series = chart.getChartData().getSeries().get_Item(0)

    cell = workbook.getCell(0, 1, 0, "C1")
    chart.getChartData().getCategories().add(cell)
    cell = workbook.getCell(0, 1, 1, 24)
    series.getDataPoints().addDataPointForLineSeries(cell)
    cell = workbook.getCell(0, 2, 0, "C2")
    chart.getChartData().getCategories().add(cell)
    cell = workbook.getCell(0, 2, 1, 23)
    series.getDataPoints().addDataPointForLineSeries(cell)
    cell = workbook.getCell(0, 3, 0, "C3")
    chart.getChartData().getCategories().add(cell)
    cell = workbook.getCell(0, 3, 1, -10)
    series.getDataPoints().addDataPointForLineSeries(cell)
    cell = workbook.getCell(0, 4, 0, "C4")
    chart.getChartData().getCategories().add(cell)
    cell = workbook.getCell(0, 4, 1, None)
    series.getDataPoints().addDataPointForLineSeries(cell)

    cell = workbook.getCell(0, 0, 2, "Series 2")
    chart.getChartData().getSeries().add(cell, chart.getType())
    #获取第二条图表系列
    second_series = chart.getChartData().getSeries().get_Item(1)

    #现在填充系列数据
    cell = workbook.getCell(0, 1, 2, 30)
    second_series.getDataPoints().addDataPointForLineSeries(cell)
    cell = workbook.getCell(0, 2, 2, 10)
    second_series.getDataPoints().addDataPointForLineSeries(cell)
    cell = workbook.getCell(0, 3, 2, 60)
    second_series.getDataPoints().addDataPointForLineSeries(cell)
    cell = workbook.getCell(0, 4, 2, 40)
    second_series.getDataPoints().addDataPointForLineSeries(cell)

    chart.setLegend(True)
    chart.getLegend().setOverlay(False)

    presentation.save("DefaultMarkersInChart.pptx", SaveFormat.Pptx)
finally:
    presentation.dispose()
常见问答
Aspose.Slides 支持哪些图表类型?
Aspose.Slides 支持广泛的图表类型,包括柱形图、折线图、饼图、面积图、散点图、直方图、雷达图等多种类型。此灵活性使您能够为数据可视化需求选择最合适的图表类型。
如何向幻灯片添加新图表?
要添加图表,首先创建一个 Presentation 类的实例,使用索引检索目标幻灯片,然后调用添加图表的方法,指定图表类型和初始数据。此过程可将图表直接集成到演示文稿中。
如何更新图表中显示的数据?
您可以通过访问图表的数据工作簿(ChartDataWorkbook),清除默认的系列和分类,然后添加自定义数据来更新图表。这使您能够刷新图表以反映最新的数据。
可以自定义图表的外观吗?
可以,Aspose.Slides 提供了丰富的自定义选项。您可以修改颜色、字体、标签、图例以及其他格式化元素,以满足特定的设计需求。