
使用 Python 在簡報中自訂圖表圖例
概述
Aspose.Slides for Python via Java 提供在 PowerPoint 簡報中自訂圖表圖例的選項。本篇說明如何設定圖例的位置與大小、設定整個圖例的字型大小、格式化單一圖例項目,以及隱藏或還原選取的項目。
常見問題解答涵蓋相關行為,包括為圖例保留空間、顯示多行標籤,以及從簡報主題繼承格式設定。
圖例定位
使用圖例的 setX、setY、setWidth 以及 setHeight 方法,以圖表尺寸的比例指定其位置與大小。
此範例建立簡報,並在第一張投影片加入預設資料的叢集柱狀圖。將所需的圖例偏移與尺寸除以圖表的寬度和高度,即可轉換為相對值:圖例相對於圖表左上角偏移 50 點,大小為 100 × 100 點。
import jpype
import asposeslides

if not jpype.isJVMStarted():
    jpype.startJVM()

from asposeslides.api import ChartType, Presentation, SaveFormat

presentation = Presentation()
try:
    slide = presentation.getSlides().get_Item(0)

    chart = slide.getShapes().addChart(ChartType.ClusteredColumn, 50, 50, 500, 500)

    # 表示相對於圖表的圖例位置和大小。
    chart.getLegend().setX(50 / chart.getWidth())
    chart.getLegend().setY(50 / chart.getHeight())
    chart.getLegend().setWidth(100 / chart.getWidth())
    chart.getLegend().setHeight(100 / chart.getHeight())

    presentation.save("legend_position.pptx", SaveFormat.Pptx)
finally:
    presentation.dispose()
設定圖例的字型大小
使用圖例的 getTextFormat 取得文字格式設定,並使用 setFontHeight 以點數設定字型大小。
此範例建立預設資料的圖表,並將圖例文字設定為 20 點。它同時停用垂直軸的自動界限,並將範圍設定為 -5 到 10。
import jpype
import asposeslides

if not jpype.isJVMStarted():
    jpype.startJVM()

from asposeslides.api import ChartType, Presentation, SaveFormat

presentation = Presentation()
try:
    slide = presentation.getSlides().get_Item(0)

    chart = slide.getShapes().addChart(ChartType.ClusteredColumn, 50, 50, 600, 400)

    chart.getLegend().getTextFormat().getPortionFormat().setFontHeight(20)
    chart.getAxes().getVerticalAxis().setAutomaticMinValue(False)
    chart.getAxes().getVerticalAxis().setMinValue(-5)
    chart.getAxes().getVerticalAxis().setAutomaticMaxValue(False)
    chart.getAxes().getVerticalAxis().setMaxValue(10)

    presentation.save("legend_font_size.pptx", SaveFormat.Pptx)
finally:
    presentation.dispose()
設定單一圖例項目的字型大小
使用圖例的 getEntries 方法返回的集合,以存取特定項目的格式設定。項目索引是從零開始,因此索引 1 代表第二個項目。
此範例建立預設資料中至少包含兩個系列的叢集柱狀圖。它將第二個圖例項目設定為粗體、斜體、20 點藍色文字。
import jpype
import asposeslides

if not jpype.isJVMStarted():
    jpype.startJVM()

from asposeslides.api import ChartType, FillType, NullableBool, Presentation, SaveFormat

Color = jpype.JClass("java.awt.Color")

presentation = Presentation()
try:
    slide = presentation.getSlides().get_Item(0)

    chart = slide.getShapes().addChart(ChartType.ClusteredColumn, 50, 50, 600, 400)
    text_format = chart.getLegend().getEntries().get_Item(1).getTextFormat()

    text_format.getPortionFormat().setFontBold(NullableBool.True_)
    text_format.getPortionFormat().setFontHeight(20)
    text_format.getPortionFormat().setFontItalic(NullableBool.True_)
    text_format.getPortionFormat().getFillFormat().setFillType(FillType.Solid)
    text_format.getPortionFormat().getFillFormat().getSolidFillColor().setColor(Color.BLUE)

    presentation.save("legend_entry_format.pptx", SaveFormat.Pptx)
finally:
    presentation.dispose()
隱藏單一圖例項目
若要在保留資料可見的情況下,將輔助系列從圖例中排除,請透過 ChartSeries.getRelatedLegendEntry 呼叫 LegendEntryProperties.setHide 並傳入 True。這僅會隱藏所選的圖例項目;不會移除系列或其資料點。相較之下,呼叫 Chart.setLegend 並傳入 False 會隱藏整個圖例。
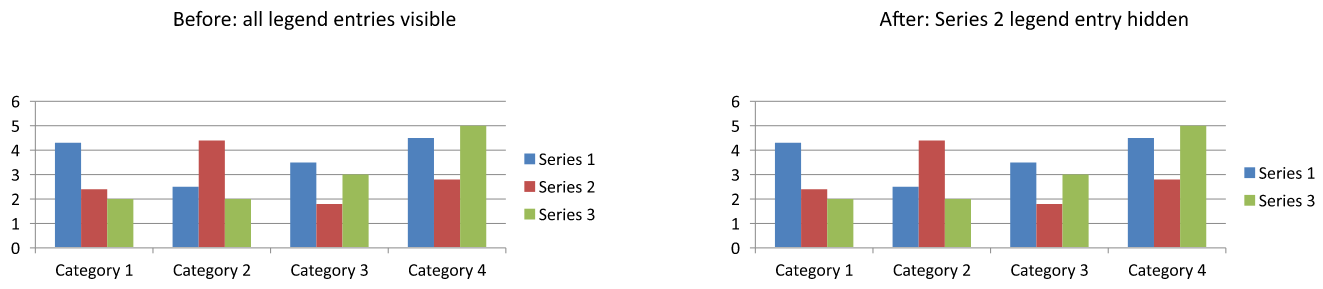
以下範例建立使用預設資料的多系列叢集柱狀圖。它隱藏第二個系列的圖例項目(索引 1),並儲存簡報。然後透過呼叫 setHide 並傳入 False 來還原該項目,並儲存第二個副本。兩個檔案的柱狀仍保持可見。
import jpype
import asposeslides

if not jpype.isJVMStarted():
    jpype.startJVM()

from asposeslides.api import ChartType, Presentation, SaveFormat

presentation = Presentation()
try:
    slide = presentation.getSlides().get_Item(0)

    chart = slide.getShapes().addChart(ChartType.ClusteredColumn, 50, 50, 600, 400)
    chart.setLegend(True)

    legend_entry = chart.getChartData().getSeries().get_Item(1).getRelatedLegendEntry()

    legend_entry.setHide(True)
    presentation.save("hidden_legend_entry.pptx", SaveFormat.Pptx)

    # 還原相同的項目而不更改圖表資料。
    legend_entry.setHide(False)
    presentation.save("restored_legend_entry.pptx", SaveFormat.Pptx)
finally:
    presentation.dispose()
下方比較顯示相同圖表在全部項目可見與第二項目被隱藏的情況。第二系列的柱狀保持不變。
在柱狀圖、條狀圖與折線圖中,圖例項目代表系列。對於圓餅圖,圖例項目代表個別資料點(切片),因此請在選取的切片上使用 ChartDataPoint.getRelatedLegendEntry。API 於 Pie、Pie3D、ExplodedPie、ExplodedPie3D、PieOfPie 與 BarOfPie 圖表類型中說明了此資料點方法。不要假設此方法適用於環形圖,因為環形圖未列入此清單。
常見問題
我可以讓圖表為圖例保留空間,而不是覆蓋它嗎?
可以。呼叫 setOverlay 並傳入 False,即可為圖例保留空間,而不是讓它覆蓋繪圖區域。
我可以建立多行圖例標籤嗎?
可以。當可用寬度不足時,長標籤會自動換行。也可以在系列名稱中使用換行字元以強制換行。
我要如何讓圖例遵循簡報主題的配色方案?
保持圖例的顏色、填色與字型未設置,讓它能夠繼承主題格式。明確的格式設定會覆寫相應的主題設定。