
PHP में प्रस्तुति चार्ट फ़ॉर्मेट करें
अवलोकन
यह लेख Aspose.Slides का उपयोग करके PowerPoint प्रस्तुतियों में चार्ट को फ़ॉर्मेट करने के तरीकों को समझाता है। यह अक्ष, ग्रिड लाइन्स, शीर्षक, लेजेंड, प्लॉट एरिया और दीवार फ़िल्स जैसे मुख्य चार्ट तत्वों को अनुकूलित करके चार्ट डेटा की उपस्थिति और पठनीयता को बेहतर बनाता है।
यह भी दर्शाता है कि चार्ट टेक्स्ट के लिए फ़ॉन्ट गुण कैसे सेट करें, चार्ट डेटा पर पूर्वनिर्धारित संख्यात्मक फ़ॉर्मेट कैसे लागू करें, और चार्ट एरिया के कोनों को गोल कैसे बनाया जाये। ये उदाहरण मिलकर यह दिखाते हैं कि प्रस्तुति में चार्ट की दृश्य शैली और डेटा प्रस्तुति दोनों को कैसे नियंत्रित किया जाए।
चार्ट इकाइयों को फ़ॉर्मेट करें
चार्ट का उपयोग करके चार्ट शीर्षक, अक्ष, ग्रिड लाइन्स, लेजेंड और प्लॉट एरिया को फ़ॉर्मेट करें। यह उदाहरण मार्कर्स वाले एक लाइन चार्ट को डिफ़ॉल्ट डेटा के साथ बनाता है, फिर उसके मान और श्रेणी अक्षों पर अलग‑अलग टेक्स्ट और लाइन शैली लागू करता है। फ़ॉन्ट आकार और लाइन चौड़ाई पॉइंट में निर्दिष्ट की गई हैं; श्रेणी लेबल 45 डिग्री घुमाए गये हैं।
मान अक्ष setNumberFormat को स्रोत कोशिकाओं से स्वतंत्र रूप से उपयोग करता है। इसका स्केल -2 से 15 तक है, मुख्य अंतराल 2 और गौण अंतराल 0.5 हैं। यह उदाहरण प्रतिशत फ़ॉर्मेट को setDisplayUnit के साथ हजारों में सेट करने को भी जोड़ता है, इसलिए इन सेटिंग्स को अपने डेटा के अर्थ और परिमाण के अनुसार समायोजित करें। लेजेंड प्लॉट एरिया के बाहर रहता है क्योंकि setOverlay को false के साथ कॉल किया गया है। पीछे की दीवार और फर्श भराव को getBackWall और getFloor के माध्यम से कॉन्फ़िगर किया जाता है, लेकिन ये सतहें केवल 3D चार्ट में ही दिखाई देती हैं।
use aspose\slides\ChartType;
use aspose\slides\DisplayUnitType;
use aspose\slides\FillType;
use aspose\slides\FontData;
use aspose\slides\LineDashStyle;
use aspose\slides\NullableBool;
use aspose\slides\Presentation;
use aspose\slides\PresetColor;
use aspose\slides\SaveFormat;
use aspose\slides\TickLabelPositionType;

$presentation = new Presentation();
try {
    $slide = $presentation->getSlides()->get_Item(0);

    $chart = $slide->getShapes()->addChart(ChartType::LineWithMarkers, 50, 50, 500, 400);

    $chart->setTitle(true);
    $chart->getChartTitle()->addTextFrameForOverriding("");
    $chartTitle = $chart->getChartTitle()->getTextFrameForOverriding()->getParagraphs()->get_Item(0)->getPortions()->get_Item(0);
    $chartTitle->setText("Sample Chart");
    $chartTitle->getPortionFormat()->getFillFormat()->setFillType(FillType::Solid);
    $chartTitle->getPortionFormat()->getFillFormat()->getSolidFillColor()->setColor(java("java.awt.Color")->GRAY);
    $chartTitle->getPortionFormat()->setFontHeight(20);
    $chartTitle->getPortionFormat()->setFontBold(NullableBool::True);
    $chartTitle->getPortionFormat()->setFontItalic(NullableBool::True);

    $chart->getAxes()->getVerticalAxis()->getMajorGridLinesFormat()->getLine()->getFillFormat()->setFillType(FillType::Solid);
    $chart->getAxes()->getVerticalAxis()->getMajorGridLinesFormat()->getLine()->getFillFormat()->getSolidFillColor()->setColor(java("java.awt.Color")->BLUE);
    $chart->getAxes()->getVerticalAxis()->getMajorGridLinesFormat()->getLine()->setWidth(5);
    $chart->getAxes()->getVerticalAxis()->getMajorGridLinesFormat()->getLine()->setDashStyle(LineDashStyle::DashDot);

    $chart->getAxes()->getVerticalAxis()->getMinorGridLinesFormat()->getLine()->getFillFormat()->setFillType(FillType::Solid);
    $chart->getAxes()->getVerticalAxis()->getMinorGridLinesFormat()->getLine()->getFillFormat()->getSolidFillColor()->setColor(java("java.awt.Color")->RED);
    $chart->getAxes()->getVerticalAxis()->getMinorGridLinesFormat()->getLine()->setWidth(3);

    $chart->getAxes()->getVerticalAxis()->setNumberFormatLinkedToSource(false);
    $chart->getAxes()->getVerticalAxis()->setDisplayUnit(DisplayUnitType::Thousands);
    $chart->getAxes()->getVerticalAxis()->setNumberFormat("0.0%");

    $chart->getAxes()->getVerticalAxis()->setAutomaticMajorUnit(false);
    $chart->getAxes()->getVerticalAxis()->setAutomaticMaxValue(false);
    $chart->getAxes()->getVerticalAxis()->setAutomaticMinorUnit(false);
    $chart->getAxes()->getVerticalAxis()->setAutomaticMinValue(false);

    $chart->getAxes()->getVerticalAxis()->setMaxValue(15);
    $chart->getAxes()->getVerticalAxis()->setMinValue(-2);
    $chart->getAxes()->getVerticalAxis()->setMinorUnit(0.5);
    $chart->getAxes()->getVerticalAxis()->setMajorUnit(2.0);

    $valueAxisText = $chart->getAxes()->getVerticalAxis()->getTextFormat()->getPortionFormat();
    $valueAxisText->setFontBold(NullableBool::True);
    $valueAxisText->setFontHeight(16);
    $valueAxisText->setFontItalic(NullableBool::True);
    $valueAxisText->getFillFormat()->setFillType(FillType::Solid);
    $valueAxisText->getFillFormat()->getSolidFillColor()->setPresetColor(PresetColor::DarkGreen);
    $valueAxisText->setLatinFont(new FontData("Times New Roman"));

    $chart->getAxes()->getVerticalAxis()->setTitle(true);
    $chart->getAxes()->getVerticalAxis()->getTitle()->addTextFrameForOverriding("");
    $valueAxisTitle = $chart->getAxes()->getVerticalAxis()->getTitle()->getTextFrameForOverriding()->getParagraphs()->get_Item(0)->getPortions()->get_Item(0);
    $valueAxisTitle->setText("Primary Axis");
    $valueAxisTitle->getPortionFormat()->getFillFormat()->setFillType(FillType::Solid);
    $valueAxisTitle->getPortionFormat()->getFillFormat()->getSolidFillColor()->setColor(java("java.awt.Color")->GRAY);
    $valueAxisTitle->getPortionFormat()->setFontHeight(20);
    $valueAxisTitle->getPortionFormat()->setFontBold(NullableBool::True);
    $valueAxisTitle->getPortionFormat()->setFontItalic(NullableBool::True);

    $chart->getAxes()->getHorizontalAxis()->getMajorGridLinesFormat()->getLine()->getFillFormat()->setFillType(FillType::Solid);
    $chart->getAxes()->getHorizontalAxis()->getMajorGridLinesFormat()->getLine()->getFillFormat()->getSolidFillColor()->setColor(new Java("java.awt.Color", 0, 128, 0));
    $chart->getAxes()->getHorizontalAxis()->getMajorGridLinesFormat()->getLine()->setWidth(5);

    $chart->getAxes()->getHorizontalAxis()->getMinorGridLinesFormat()->getLine()->getFillFormat()->setFillType(FillType::Solid);
    $chart->getAxes()->getHorizontalAxis()->getMinorGridLinesFormat()->getLine()->getFillFormat()->getSolidFillColor()->setColor(java("java.awt.Color")->YELLOW);
    $chart->getAxes()->getHorizontalAxis()->getMinorGridLinesFormat()->getLine()->setWidth(3);

    $categoryAxisText = $chart->getAxes()->getHorizontalAxis()->getTextFormat()->getPortionFormat();
    $categoryAxisText->setFontBold(NullableBool::True);
    $categoryAxisText->setFontHeight(16);
    $categoryAxisText->setFontItalic(NullableBool::True);
    $categoryAxisText->getFillFormat()->setFillType(FillType::Solid);
    $categoryAxisText->getFillFormat()->getSolidFillColor()->setColor(java("java.awt.Color")->BLUE);
    $categoryAxisText->setLatinFont(new FontData("Arial"));

    $chart->getAxes()->getHorizontalAxis()->setTitle(true);
    $chart->getAxes()->getHorizontalAxis()->getTitle()->addTextFrameForOverriding("");

    $categoryAxisTitle = $chart->getAxes()->getHorizontalAxis()->getTitle()->getTextFrameForOverriding()->getParagraphs()->get_Item(0)->getPortions()->get_Item(0);
    $categoryAxisTitle->setText("Sample Category");
    $categoryAxisTitle->getPortionFormat()->getFillFormat()->setFillType(FillType::Solid);
    $categoryAxisTitle->getPortionFormat()->getFillFormat()->getSolidFillColor()->setColor(java("java.awt.Color")->GRAY);
    $categoryAxisTitle->getPortionFormat()->setFontHeight(20);
    $categoryAxisTitle->getPortionFormat()->setFontBold(NullableBool::True);
    $categoryAxisTitle->getPortionFormat()->setFontItalic(NullableBool::True);

    $chart->getAxes()->getHorizontalAxis()->setTickLabelPosition(TickLabelPositionType::Low);
    $chart->getAxes()->getHorizontalAxis()->setTickLabelRotationAngle(45);

    $legendText = $chart->getLegend()->getTextFormat()->getPortionFormat();
    $legendText->setFontBold(NullableBool::True);
    $legendText->setFontHeight(16);
    $legendText->setFontItalic(NullableBool::True);
    $legendText->getFillFormat()->setFillType(FillType::Solid);
    $legendText->getFillFormat()->getSolidFillColor()->setPresetColor(PresetColor::DarkRed);

    $chart->getLegend()->setOverlay(false);

    $chart->getBackWall()->setThickness(1);
    $chart->getBackWall()->getFormat()->getFill()->setFillType(FillType::Solid);
    $chart->getBackWall()->getFormat()->getFill()->getSolidFillColor()->setColor(new Java("java.awt.Color", 255, 165, 0));

    $chart->getFloor()->getFormat()->getFill()->setFillType(FillType::Solid);
    $chart->getFloor()->getFormat()->getFill()->getSolidFillColor()->setColor(java("java.awt.Color")->RED);

    $chart->getPlotArea()->getFormat()->getFill()->setFillType(FillType::Solid);
    $chart->getPlotArea()->getFormat()->getFill()->getSolidFillColor()->setPresetColor(PresetColor::LightCyan);

    $presentation->save("FormattedChart_out.pptx", SaveFormat::Pptx);
} finally {
    $presentation->dispose();
}
चार्ट के लिए फ़ॉन्ट गुण सेट करें
Chart::getTextFormat के माध्यम से चार्ट टेक्स्ट के लिए डिफ़ॉल्ट फ़ॉन्ट आकार सेट करें। यह उदाहरण 20‑पॉइंट फ़ॉन्ट वाले एक क्लस्टर्ड कॉलम चार्ट को बनाता है और पहले क्रम के लिए setShowValue के माध्यम से वैल्यू लेबल सक्षम करता है। अपने स्पष्ट फ़ॉन्ट सेटिंग वाले टेक्स्ट तत्व चार्ट की डिफ़ॉल्ट को ओवरराइड कर सकते हैं।
use aspose\slides\ChartType;
use aspose\slides\Presentation;
use aspose\slides\SaveFormat;

$presentation = new Presentation();
try {
    $slide = $presentation->getSlides()->get_Item(0);

    $chart = $slide->getShapes()->addChart(ChartType::ClusteredColumn, 100, 100, 500, 400);
    $chart->getTextFormat()->getPortionFormat()->setFontHeight(20);
    $chart->getChartData()->getSeries()->get_Item(0)->getLabels()->getDefaultDataLabelFormat()->setShowValue(true);

    $presentation->save("FontPropertiesForChart.pptx", SaveFormat::Pptx);
} finally {
    $presentation->dispose();
}
संख्यात्मक फ़ॉर्मेट सेट करें
ChartDataCell::setPresetNumberFormat का उपयोग करके चार्ट वर्कबुक कोशिकाओं पर बिल्ट‑इन नंबर फ़ॉर्मेट लागू करें। यह उदाहरण डिफ़ॉल्ट, सेल‑बैक्ड डेटा वाले एक क्लस्टर्ड कॉलम चार्ट को बनाता है और प्रत्येक श्रृंखला मान सेल पर फ़ॉर्मेट इंडेक्स 10 (0.00%) लागू करता है। इससे वर्कबुक में संख्याएँ नहीं बदलतीं, केवल उनका दिखावा बदलता है; उदाहरण के लिये, 0.25 को 25.00 % के रूप में प्रदर्शित किया जाता है। अक्ष और डेटा‑लेबल फ़ॉर्मेट को अलग‑अलग कॉन्फ़िगर किया जा सकता है।
use aspose\slides\ChartType;
use aspose\slides\Presentation;
use aspose\slides\SaveFormat;

$presentation = new Presentation();
try {
    $slide = $presentation->getSlides()->get_Item(0);

    $chart = $slide->getShapes()->addChart(ChartType::ClusteredColumn, 50, 50, 500, 400);
    $series = $chart->getChartData()->getSeries();

    for ($i = 0; $i < java_values($series->size()); $i++) {
        $chartSeries = $series->get_Item($i);
        $dataPoints = $chartSeries->getDataPoints();
        for ($j = 0; $j < java_values($dataPoints->size()); $j++) {
            $dataPoint = $dataPoints->get_Item($j);
            $dataPoint->getValue()->getAsCell()->setPresetNumberFormat(10); // 0.00%
        }
    }

    $presentation->save("PresetNumberFormat_out.pptx", SaveFormat::Pptx);
} finally {
    $presentation->dispose();
}
निम्न तालिका में अंग्रेज़ी (संयुक्त राज्य) लोकल के प्रतिनिधि Excel फ़ॉर्मेट के साथ निर्मित संख्या फ़ॉर्मेट इंडेक्स दिखाए गये हैं। सटीक फ़ॉर्मेट स्ट्रिंग और उनका प्रदर्शन एप्लिकेशन और लोकल के अनुसार बदल सकता है, विशेषकर मुद्रा और तिथियों के लिये। कुछ Excel फ़ॉर्मेट OOXML मानक के डिफ़ॉल्ट से भी भिन्न होते हैं, जैसा कि Microsoft’s number format implementation notes में वर्णित है।
| सूचकांक | फ़ॉर्मेट |
|---|---|
| 0 | General |
| 1 | 0 |
| 2 | 0.00 |
| 3 | #,##0 |
| 4 | #,##0.00 |
| 5 | "$"#,##0_);("$"#,##0) |
| 6 | "$"#,##0_);[Red]("$"#,##0) |
| 7 | "$"#,##0.00_);("$"#,##0.00) |
| 8 | "$"#,##0.00_);[Red]("$"#,##0.00) |
| 9 | 0% |
| 10 | 0.00% |
| 11 | 0.00E+00 |
| 12 | # ?/? |
| 13 | # ??/?? |
| 14 | m/d/yyyy |
| 15 | d-mmm-yy |
| 16 | d-mmm |
| 17 | mmm-yy |
| 18 | h:mm AM/PM |
| 19 | h:mm:ss AM/PM |
| 20 | h:mm |
| 21 | h:mm:ss |
| 22 | m/d/yyyy h:mm |
| 37 | #,##0_);(#,##0) |
| 38 | #,##0_);[Red](#,##0) |
| 39 | #,##0.00_);(#,##0.00) |
| 40 | #,##0.00_);[Red](#,##0.00) |
| 41 | _(* #,##0_);_(* (#,##0);_(* "-"_);_(@_) |
| 42 | _("$"* #,##0_);_("$"* (#,##0);_("$"* "-"_);_(@_) |
| 43 | _(* #,##0.00_);_(* (#,##0.00);_(* "-"??_);_(@_) |
| 44 | _("$"* #,##0.00_);_("$"* (#,##0.00);_("$"* "-"??_);_(@_) |
| 45 | mm:ss |
| 46 | [h]:mm:ss |
| 47 | mm:ss.0 |
| 48 | ##0.0E+0 |
| 49 | @ |
चार्ट एरिया के गोल किनारे सेट करें
Chart::setRoundedCorners को true के साथ कॉल करके चार्ट एरिया के किनारों को गोल करें। यह उदाहरण एक क्लस्टर्ड कॉलम चार्ट बनाता है और getLineFormat का उपयोग करके उसकी रूपरेखा को ठोस ग्रे रंग और एकल‑लाइन शैली देता है, फिर प्रस्तुति को सहेजता है।
use aspose\slides\ChartType;
use aspose\slides\FillType;
use aspose\slides\LineStyle;
use aspose\slides\Presentation;
use aspose\slides\SaveFormat;

$presentation = new Presentation();
try {
    $slide = $presentation->getSlides()->get_Item(0);

    $chart = $slide->getShapes()->addChart(ChartType::ClusteredColumn, 20, 100, 600, 400);
    $chart->getLineFormat()->getFillFormat()->setFillType(FillType::Solid);
    $chart->getLineFormat()->getFillFormat()->getSolidFillColor()->setColor(java("java.awt.Color")->GRAY);
    $chart->getLineFormat()->setStyle(LineStyle::Single);
    $chart->setRoundedCorners(true);

    $presentation->save("out.pptx", SaveFormat::Pptx);
} finally {
    $presentation->dispose();
}
मौजूदा चार्ट एनोटेशन संपादित करें
एक चार्ट में कस्टम आकार हो सकते हैं, जैसे कि रिपोर्ट की स्थिति बताने वाला टेक्स्ट एनोटेशन। इन आकारों तक पहुंचने के लिये Chart::getUserShapes का प्रयोग करें। getShapes द्वारा लौटाए गये संग्रह में चार्ट‑स्वामित्व वाले आकार होते हैं।
एक सामान्य टेक्स्ट बॉक्स जो चार्ट के ऊपर रखा गया हो वह स्लाइड का हिस्सा होता है, चाहे वह चार्ट का हिस्सा जैसा दिखे। Slide::getShapes के माध्यम से इटरेट करने पर चार्ट तथा सामान्य स्लाइड आकार मिलते हैं, लेकिन चार्ट के भीतर व्यक्तिगत आकारों की सूची नहीं बनती। चार्ट शीर्षक और डेटा लेबल अलग‑अलग चार्ट तत्व होते हैं, न कि इस संग्रह में कस्टम एनोटेशन।
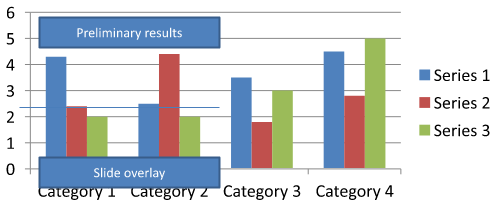
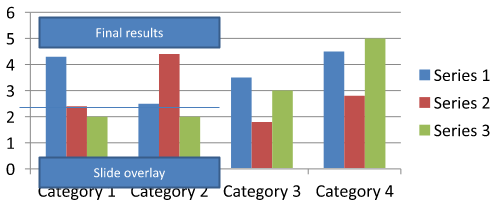
chart-annotations.pptx को डाउनलोड करके एप्लिकेशन की कार्य निर्देशिका में रखें। इसकी पहली स्लाइड में एक चार्ट है जिसमें “Preliminary results” लिखा एक अनग्रुपेड एनोटेशन, एक चार्ट‑स्वामित्व वाली लाइनी और “Slide overlay” लिखा सामान्य स्लाइड टेक्स्ट बॉक्स है। उदाहरण पहले चार्ट को ढूंढता है और रिपोर्ट प्रकाशित होने पर एनोटेशन को “Final results” में बदल देता है। यह खाली संग्रह की जाँच करता है और केवल उन AutoShape को संपादित करता है जिनके पास गैर‑नल टेक्स्ट फ्रेम है, जिसे getTextFrame द्वारा प्राप्त किया गया है और जिसकी सामग्री अपेक्षित टेक्स्ट से मेल खाती है।
use aspose\slides\Presentation;
use aspose\slides\SaveFormat;

$presentation = new Presentation("chart-annotations.pptx");
try {
    $slide = $presentation->getSlides()->get_Item(0);

    $chartType = new JavaClass("com.aspose.slides.IChart");
    $autoShapeType = new JavaClass("com.aspose.slides.IAutoShape");
    $chart = null;
    for ($i = 0; $i < java_values($slide->getShapes()->size()); $i++) {
        $shape = $slide->getShapes()->get_Item($i);
        if (java_instanceof($shape, $chartType)) {
            $chart = $shape;
            break;
        }
    }

    if ($chart === null || java_values($chart->getUserShapes()->getShapes()->size()) == 0) {
        echo "No chart or chart-owned shapes found." . PHP_EOL;
        return;
    }

    $updated = false;
    $userShapes = $chart->getUserShapes()->getShapes();
    for ($i = 0; $i < java_values($userShapes->size()); $i++) {
        $shape = $userShapes->get_Item($i);
        if (java_instanceof($shape, $autoShapeType)) {
            $annotation = $shape;
            if (!java_is_null($annotation->getTextFrame()) && java_values($annotation->getTextFrame()->getText()) === "Preliminary results") {
                $annotation->getTextFrame()->setText("Final results");
                $updated = true;
                break;
            }
        }
    }

    if ($updated) {
        $presentation->save("chart-annotations-updated.pptx", SaveFormat::Pptx);
    } else {
        echo "No matching text annotation found." . PHP_EOL;
    }
} finally {
    $presentation->dispose();
}
लाइन और स्लाइड टेक्स्ट बॉक्स अपरिवर्तित रहता है। नीचे दिए गये चित्र इनपुट और सहेजा गया, पुनः खोला गया परिणाम दिखाते हैं:
| संपादन से पहले | संपादन के बाद |
|---|---|
 |
 |
Note
उदाहरण केवल शीर्ष‑स्तर के चार्ट‑स्वामित्व वाले आकारों की जांच करता है। यदि कोई एनोटेशन एक GroupShape के अंदर है, तो उस समूह की getShapes संग्रह को भी जांचें। नेस्टेड ग्रुप्स के लिये इसे पुनरावर्ती रूप से दोहराएँ, और उनके चाइल्ड आकारों पर समान टेक्स्ट जांच लागू करें। एक समूह स्वयं एक कंटेनर है; इसे टेक्स्ट बॉक्स के रूप में न मानें।अक्सर पूछे जाने वाले प्रश्न
क्या मैं कॉलम/एरिया के लिए अर्ध‑पारदर्शी फ़िल लागू करके बॉर्डर को अपारदर्शी रख सकता हूँ?
हां। फ़िल पारदर्शिता और रूपरेखा को अलग‑अलग कॉन्फ़िगर किया जाता है। यह ग्रिड और डेटा की पठनीयता को बढ़ाने में सहायक है।
डेटा लेबल ओवरलैप होने पर मैं क्या करूँ?
फ़ॉन्ट आकार कम करें, गैर‑आवश्यक लेबल घटकों (जैसे श्रेणियाँ) को निष्क्रिय करें, लेबल की स्थिति समायोजित करें, आवश्यक होने पर केवल चयनित बिंदुओं के लेबल दिखाएँ, या फ़ॉर्मेट को “value + legend” में बदलें।
क्या मैं श्रृंखला पर ग्रेडिएंट या पैटर्न फ़िल लागू कर सकता हूँ?
हां। श्रृंखलाएँ ठोस, ग्रेडिएंट और पैटर्न फ़िल का समर्थन करती हैं। अभ्यास में ग्रेडिएंट का सीमित उपयोग करें और ऐसे संयोजन से बचें जो ग्रिड और टेक्स्ट के बीच कंट्रास्ट कम कर दें।