
C++를 사용하여 프레젠테이션에서 차트 범례 사용자 지정
개요
Aspose.Slides for C++는 PowerPoint 프레젠테이션에서 차트 범례를 사용자 지정할 수 있는 옵션을 제공합니다. 이 문서에서는 범례의 위치와 크기를 지정하고, 전체 범례의 글꼴 크기를 설정하며, 개별 범례 항목을 서식화하고, 선택된 항목을 숨기거나 복원하는 방법을 보여줍니다.
FAQ에서는 범례를 위한 공간 예약, 다중 행 레이블 표시, 프레젠테이션 테마에서 서식 상속 등 관련 동작을 다룹니다.
범례 위치 지정
범례의 set_X, set_Y, set_Width, 및 set_Height 메서드를 사용하여 차트 크기에 대한 비율로 위치와 크기를 지정합니다.
이 예제는 프레젠테이션을 만든 후 기본 데이터를 가진 군집형 세로 막대 차트를 첫 번째 슬라이드에 추가합니다. 원하는 범례 오프셋 및 크기를 차트의 너비와 높이로 나누면 상대값으로 변환됩니다. 범례는 차트 왼쪽 상단 모서리에서 50포인트 떨어져 있으며 크기는 100×100 포인트입니다.
#include <system/shared_ptr.h>
#include <DOM/Presentation.h>
#include <DOM/ISlide.h>
#include <DOM/IShapeCollection.h>
#include <DOM/Chart/ChartType.h>
#include <DOM/IChart.h>
#include <DOM/Chart/ILegend.h>
#include <Export/SaveFormat.h>

using namespace Aspose::Slides;
using namespace Aspose::Slides::Charts;
using namespace Aspose::Slides::Export;

auto presentation = System::MakeObject<Presentation>();
auto slide = presentation->get_Slide(0);

auto chart = slide->get_Shapes()->AddChart(ChartType::ClusteredColumn, 50, 50, 500, 500);

// Express the legend's position and size relative to the chart.
chart->get_Legend()->set_X(50 / chart->get_Width());
chart->get_Legend()->set_Y(50 / chart->get_Height());
chart->get_Legend()->set_Width(100 / chart->get_Width());
chart->get_Legend()->set_Height(100 / chart->get_Height());

presentation->Save(u"legend_position.pptx", SaveFormat::Pptx);
범례 글꼴 크기 설정
범례의 get_TextFormat을 사용하여 텍스트 서식을 가져오고, set_FontHeight을 사용하여 포인트 단위로 글꼴 크기를 설정합니다.
이 예제는 기본 데이터를 가진 차트를 생성하고 범례 텍스트를 20포인트로 설정합니다. 또한 수직 축에 대한 자동 경계를 비활성화하고 범위를 -5에서 10으로 지정합니다.
#include <system/shared_ptr.h>
#include <DOM/Presentation.h>
#include <DOM/ISlide.h>
#include <DOM/IShapeCollection.h>
#include <DOM/Chart/ChartType.h>
#include <DOM/IChart.h>
#include <DOM/Chart/ILegend.h>
#include <DOM/Chart/IChartTextFormat.h>
#include <DOM/Chart/IAxesManager.h>
#include <DOM/Chart/IAxis.h>
#include <DOM/Chart/IChartPortionFormat.h>
#include <Export/SaveFormat.h>

using namespace Aspose::Slides;
using namespace Aspose::Slides::Charts;
using namespace Aspose::Slides::Export;

auto presentation = System::MakeObject<Presentation>();
auto slide = presentation->get_Slide(0);

auto chart = slide->get_Shapes()->AddChart(ChartType::ClusteredColumn, 50, 50, 600, 400);

chart->get_Legend()->get_TextFormat()->get_PortionFormat()->set_FontHeight(20);
chart->get_Axes()->get_VerticalAxis()->set_IsAutomaticMinValue(false);
chart->get_Axes()->get_VerticalAxis()->set_MinValue(-5);
chart->get_Axes()->get_VerticalAxis()->set_IsAutomaticMaxValue(false);
chart->get_Axes()->get_VerticalAxis()->set_MaxValue(10);

presentation->Save(u"legend_font_size.pptx", SaveFormat::Pptx);
개별 범례 항목의 글꼴 크기 설정
범례의 get_Entries 메서드가 반환하는 컬렉션을 사용하여 특정 항목의 서식을 접근합니다. 항목 인덱스는 0부터 시작하므로 인덱스 1은 두 번째 항목을 의미합니다.
이 예제는 기본 데이터에 최소 두 개 이상의 시리즈가 포함된 군집형 세로 막대 차트를 생성합니다. 두 번째 범례 항목을 굵게, 이탤릭체 및 20포인트 파란색 텍스트로 서식 지정합니다.
#include <system/shared_ptr.h>
#include <drawing/color.h>
#include <DOM/Presentation.h>
#include <DOM/ISlide.h>
#include <DOM/IShapeCollection.h>
#include <DOM/Chart/ChartType.h>
#include <DOM/IChart.h>
#include <DOM/Chart/ILegend.h>
#include <DOM/Chart/IChartTextFormat.h>
#include <DOM/Chart/ILegendEntryCollection.h>
#include <DOM/Chart/ILegendEntryProperties.h>
#include <DOM/Chart/IChartPortionFormat.h>
#include <DOM/NullableBool.h>
#include <DOM/IFillFormat.h>
#include <DOM/FillType.h>
#include <DOM/IColorFormat.h>
#include <Export/SaveFormat.h>

using namespace Aspose::Slides;
using namespace Aspose::Slides::Charts;
using namespace Aspose::Slides::Export;

auto presentation = System::MakeObject<Presentation>();
auto slide = presentation->get_Slide(0);

auto chart = slide->get_Shapes()->AddChart(ChartType::ClusteredColumn, 50, 50, 600, 400);
auto textFormat = chart->get_Legend()->get_Entries()->idx_get(1)->get_TextFormat();

textFormat->get_PortionFormat()->set_FontBold(NullableBool::True);
textFormat->get_PortionFormat()->set_FontHeight(20);
textFormat->get_PortionFormat()->set_FontItalic(NullableBool::True);
textFormat->get_PortionFormat()->get_FillFormat()->set_FillType(FillType::Solid);
textFormat->get_PortionFormat()->get_FillFormat()->get_SolidFillColor()->set_Color(System::Drawing::Color::get_Blue());

presentation->Save(u"legend_entry_format.pptx", SaveFormat::Pptx);
개별 범례 항목 숨기기
보조 시리즈를 데이터는 표시된 상태로 유지하면서 범례에서 제외하려면 ILegendEntryProperties::set_Hide를 true 로 호출하고 IChartSeries::get_RelatedLegendEntry를 사용합니다. 이는 선택된 범례 항목만 숨기며 시리즈나 데이터 포인트는 제거되지 않습니다. 반대로 IChart::set_HasLegend를 false 로 호출하면 전체 범례가 숨겨집니다.
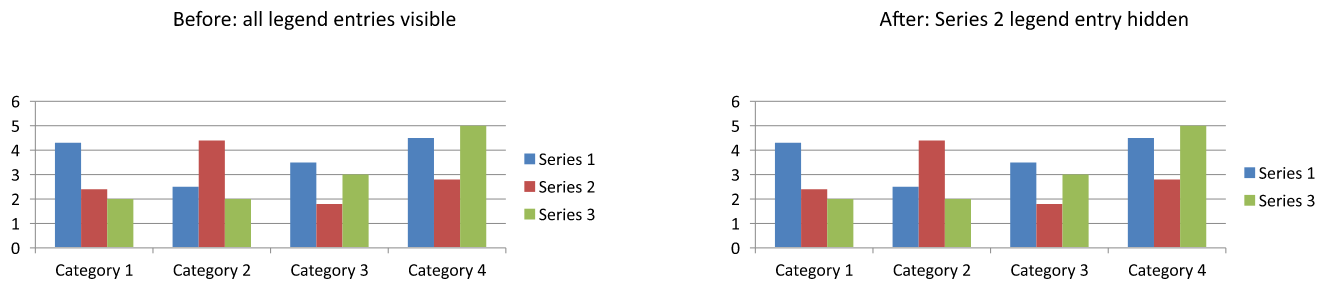
아래 예제는 기본 데이터를 사용하여 여러 시리즈가 있는 군집형 세로 막대 차트를 생성합니다. 두 번째 시리즈의 범례 항목(인덱스 1)을 숨기고 프레젠테이션을 저장합니다. 이후 set_Hide를 false 로 호출하여 항목을 복원하고 두 번째 사본을 저장합니다. 두 파일 모두에서 열은 계속 표시됩니다.
#include <system/shared_ptr.h>
#include <DOM/Presentation.h>
#include <DOM/ISlide.h>
#include <DOM/IShapeCollection.h>
#include <DOM/Chart/ChartType.h>
#include <DOM/IChart.h>
#include <DOM/Chart/ILegend.h>
#include <DOM/Chart/ILegendEntryProperties.h>
#include <DOM/Chart/IChartData.h>
#include <DOM/Chart/IChartSeriesCollection.h>
#include <DOM/Chart/IChartSeries.h>
#include <Export/SaveFormat.h>

using namespace Aspose::Slides;
using namespace Aspose::Slides::Charts;
using namespace Aspose::Slides::Export;

auto presentation = System::MakeObject<Presentation>();
auto slide = presentation->get_Slide(0);

auto chart = slide->get_Shapes()->AddChart(ChartType::ClusteredColumn, 50, 50, 600, 400);
chart->set_HasLegend(true);

auto legendEntry = chart->get_ChartData()->get_Series()->idx_get(1)->get_RelatedLegendEntry();

legendEntry->set_Hide(true);
presentation->Save(u"hidden_legend_entry.pptx", SaveFormat::Pptx);

// 차트 데이터를 변경하지 않고 동일한 항목을 복원합니다.
legendEntry->set_Hide(false);
presentation->Save(u"restored_legend_entry.pptx", SaveFormat::Pptx);
아래 비교는 모든 항목이 표시된 차트와 두 번째 항목이 숨겨진 차트를 보여줍니다. 두 번째 시리즈의 열은 변경되지 않은 상태로 유지됩니다.
컬럼, 막대 및 라인 차트에서는 범례 항목이 시리즈를 식별합니다. 파이 차트에서는 개별 데이터 포인트(슬라이스)를 식별하므로 선택한 슬라이스에 대해 IChartDataPoint::get_RelatedLegendEntry를 사용합니다. 이 데이터 포인트 메서드는 Pie, Pie3D, ExplodedPie, ExplodedPie3D, PieOfPie, BarOfPie 차트 유형에 대해 API에 문서화되어 있습니다. 도넛 차트에는 적용되지 않으므로 가정하지 마세요.
FAQ
차트가 범례를 겹치게 하는 대신 범례를 위한 공간을 할당하도록 할 수 있나요?
예. set_Overlay를 false 로 호출하면 범례가 플롯 영역과 겹치지 않도록 공간을 예약합니다.
다중 행 범례 레이블을 만들 수 있나요?
예. 가용 너비가 부족할 경우 긴 레이블이 자동으로 줄 바꿈됩니다. 또한 시리즈 이름에 새 줄 문자를 넣어 줄 바꿈을 요청할 수 있습니다.
범례가 프레젠테이션 테마의 색 구성표를 따르도록 하려면 어떻게 해야 하나요?
범례의 색상, 채우기 및 글꼴을 설정하지 않으면 테마 서식을 상속받습니다. 명시적인 서식은 해당 테마 설정을 덮어씁니다.