
ปรับแต่งคำอธิบายแผนภูมิในงานนำเสนอด้วย C++
ภาพรวม
Aspose.Slides for C++ มีตัวเลือกสำหรับปรับแต่งคำอธิบายภาพ (legend) ของแผนภูมิในงานนำเสนอ PowerPoint. บทความนี้แสดงวิธีกำหนดตำแหน่งและขนาดของ legend, ตั้งขนาดแบบอักษรสำหรับ legend ทั้งหมด, จัดรูปแบบรายการ legend รายบุคคล, และซ่อนหรือเรียกคืนรายการที่เลือก. ส่วน FAQ ครอบคลุมการทำงานที่เกี่ยวข้อง รวมถึงการสำรองพื้นที่สำหรับ legend, การแสดงป้ายหลายบรรทัด, และการสืบทอดการจัดรูปแบบจากธีมของงานนำเสนอ.
การกำหนดตำแหน่ง Legend
ใช้เมธอด set_X, set_Y, set_Width, และ set_Height ของ legend เพื่อระบุตำแหน่งและขนาดของมันเป็นสัดส่วนของมิติของแผนภูมิ.
ตัวอย่างนี้สร้างงานนำเสนอและเพิ่มแผนภูมิคอลัมน์แบบกลุ่มพร้อมข้อมูลเริ่มต้นในสไลด์แรก การหารค่า offset และขนาดที่ต้องการของ legend ด้วยความกว้างและความสูงของแผนภูมิจะทำให้ค่าเป็นสัมพัทธ์: legend มีการย้ายตำแหน่ง 50 จุดจากมุมบนซ้ายของแผนภูมิและมีขนาด 100x100 จุด.
#include <system/shared_ptr.h>
#include <DOM/Presentation.h>
#include <DOM/ISlide.h>
#include <DOM/IShapeCollection.h>
#include <DOM/Chart/ChartType.h>
#include <DOM/IChart.h>
#include <DOM/Chart/ILegend.h>
#include <Export/SaveFormat.h>

using namespace Aspose::Slides;
using namespace Aspose::Slides::Charts;
using namespace Aspose::Slides::Export;

auto presentation = System::MakeObject<Presentation>();
auto slide = presentation->get_Slide(0);

auto chart = slide->get_Shapes()->AddChart(ChartType::ClusteredColumn, 50, 50, 500, 500);

// กำหนดตำแหน่งและขนาดของ legend ให้สัมพันธ์กับแผนภูมิ
chart->get_Legend()->set_X(50 / chart->get_Width());
chart->get_Legend()->set_Y(50 / chart->get_Height());
chart->get_Legend()->set_Width(100 / chart->get_Width());
chart->get_Legend()->set_Height(100 / chart->get_Height());

presentation->Save(u"legend_position.pptx", SaveFormat::Pptx);
กำหนดขนาดแบบอักษรของ Legend
ใช้ get_TextFormat ของ legend เพื่อเข้าถึงการจัดรูปแบบข้อความและใช้ set_FontHeight เพื่อตั้งค่าขนาดแบบอักษรเป็นจุด.
ตัวอย่างนี้สร้างแผนภูมิโดยใช้ข้อมูลเริ่มต้นและตั้งค่าข้อความ legend เป็น 20 จุด นอกจากนี้ยังปิดการกำหนดขอบอัตโนมัติสำหรับแกนตั้งและตั้งค่าช่วงเป็น -5 ถึง 10.
#include <system/shared_ptr.h>
#include <DOM/Presentation.h>
#include <DOM/ISlide.h>
#include <DOM/IShapeCollection.h>
#include <DOM/Chart/ChartType.h>
#include <DOM/IChart.h>
#include <DOM/Chart/ILegend.h>
#include <DOM/Chart/IChartTextFormat.h>
#include <DOM/Chart/IAxesManager.h>
#include <DOM/Chart/IAxis.h>
#include <DOM/Chart/IChartPortionFormat.h>
#include <Export/SaveFormat.h>

using namespace Aspose::Slides;
using namespace Aspose::Slides::Charts;
using namespace Aspose::Slides::Export;

auto presentation = System::MakeObject<Presentation>();
auto slide = presentation->get_Slide(0);

auto chart = slide->get_Shapes()->AddChart(ChartType::ClusteredColumn, 50, 50, 600, 400);

chart->get_Legend()->get_TextFormat()->get_PortionFormat()->set_FontHeight(20);
chart->get_Axes()->get_VerticalAxis()->set_IsAutomaticMinValue(false);
chart->get_Axes()->get_VerticalAxis()->set_MinValue(-5);
chart->get_Axes()->get_VerticalAxis()->set_IsAutomaticMaxValue(false);
chart->get_Axes()->get_VerticalAxis()->set_MaxValue(10);

presentation->Save(u"legend_font_size.pptx", SaveFormat::Pptx);
กำหนดขนาดแบบอักษรของรายการ Legend รายบุคคล
ใช้คอลเลกชันที่คืนค่าจากเมธอด get_Entries ของ legend เพื่อเข้าถึงการจัดรูปแบบของรายการเฉพาะ ดัชนีของรายการเริ่มจาก 0 ดังนั้นดัชนี 1 หมายถึงรายการที่สอง.
ตัวอย่างนี้สร้างแผนภูมิคอลัมน์แบบกลุ่มที่มีข้อมูลเริ่มต้นอย่างน้อยสองซีรีส์ มันจัดรูปแบบรายการ legend ที่สองด้วยข้อความหนา, ตัวเอียง, สีฟ้าและขนาด 20 จุด.
#include <system/shared_ptr.h>
#include <drawing/color.h>
#include <DOM/Presentation.h>
#include <DOM/ISlide.h>
#include <DOM/IShapeCollection.h>
#include <DOM/Chart/ChartType.h>
#include <DOM/IChart.h>
#include <DOM/Chart/ILegend.h>
#include <DOM/Chart/IChartTextFormat.h>
#include <DOM/Chart/ILegendEntryCollection.h>
#include <DOM/Chart/ILegendEntryProperties.h>
#include <DOM/Chart/IChartPortionFormat.h>
#include <DOM/NullableBool.h>
#include <DOM/IFillFormat.h>
#include <DOM/FillType.h>
#include <DOM/IColorFormat.h>
#include <Export/SaveFormat.h>

using namespace Aspose::Slides;
using namespace Aspose::Slides::Charts;
using namespace Aspose::Slides::Export;

auto presentation = System::MakeObject<Presentation>();
auto slide = presentation->get_Slide(0);

auto chart = slide->get_Shapes()->AddChart(ChartType::ClusteredColumn, 50, 50, 600, 400);
auto textFormat = chart->get_Legend()->get_Entries()->idx_get(1)->get_TextFormat();

textFormat->get_PortionFormat()->set_FontBold(NullableBool::True);
textFormat->get_PortionFormat()->set_FontHeight(20);
textFormat->get_PortionFormat()->set_FontItalic(NullableBool::True);
textFormat->get_PortionFormat()->get_FillFormat()->set_FillType(FillType::Solid);
textFormat->get_PortionFormat()->get_FillFormat()->get_SolidFillColor()->set_Color(System::Drawing::Color::get_Blue());

presentation->Save(u"legend_entry_format.pptx", SaveFormat::Pptx);
ซ่อนรายการ Legend รายบุคคล
เพื่อไม่ให้ซีรีส์ช่วยเหลือปรากฏใน legend ในขณะที่ข้อมูลยังคงแสดง, เรียกใช้ ILegendEntryProperties::set_Hide ด้วยค่า true ผ่าน IChartSeries::get_RelatedLegendEntry. วิธีนี้จะซ่อนเฉพาะรายการ legend ที่เลือก; ไม่ได้ลบซีรีส์หรือจุดข้อมูลของมัน การเรียกใช้ IChart::set_HasLegend ด้วยค่า false จะซ่อน legend ทั้งหมด.
ตัวอย่างด้านล่างสร้างแผนภูมิคอลัมน์แบบกลุ่มที่มีหลายซีรีส์โดยใช้ข้อมูลเริ่มต้น มันซ่อนรายการ legend ของซีรีส์ที่สอง (ดัชนี 1) และบันทึกงานนำเสนอ จากนั้นเรียก set_Hide ด้วยค่า false เพื่อเรียกคืนรายการและบันทึกสำเนาที่สอง คอลัมน์ยังคงแสดงในทั้งสองไฟล์.
#include <system/shared_ptr.h>
#include <DOM/Presentation.h>
#include <DOM/ISlide.h>
#include <DOM/IShapeCollection.h>
#include <DOM/Chart/ChartType.h>
#include <DOM/IChart.h>
#include <DOM/Chart/ILegend.h>
#include <DOM/Chart/ILegendEntryProperties.h>
#include <DOM/Chart/IChartData.h>
#include <DOM/Chart/IChartSeriesCollection.h>
#include <DOM/Chart/IChartSeries.h>
#include <Export/SaveFormat.h>

using namespace Aspose::Slides;
using namespace Aspose::Slides::Charts;
using namespace Aspose::Slides::Export;

auto presentation = System::MakeObject<Presentation>();
auto slide = presentation->get_Slide(0);

auto chart = slide->get_Shapes()->AddChart(ChartType::ClusteredColumn, 50, 50, 600, 400);
chart->set_HasLegend(true);

auto legendEntry = chart->get_ChartData()->get_Series()->idx_get(1)->get_RelatedLegendEntry();

legendEntry->set_Hide(true);
presentation->Save(u"hidden_legend_entry.pptx", SaveFormat::Pptx);

// ฟื้นคืนรายการเดียวกันโดยไม่เปลี่ยนแปลงข้อมูลของแผนภูมิ.
legendEntry->set_Hide(false);
presentation->Save(u"restored_legend_entry.pptx", SaveFormat::Pptx);
การเปรียบเทียบด้านล่างแสดงแผนภูมิเดียวกันที่มีทุกรายการปรากฏและรายการที่สองซ่อนอยู่ คอลัมน์ของซีรีส์ที่สองยังคงไม่เปลี่ยนแปลง.
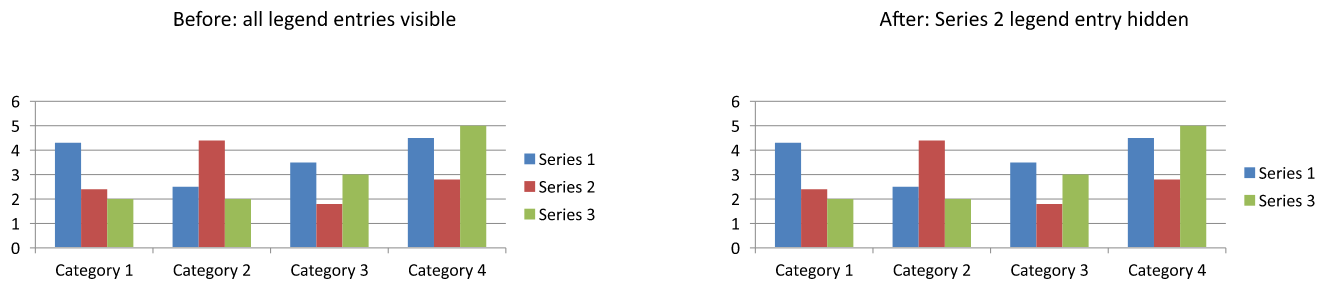
ในแผนภูมิคอลัมน์, แถบ, และเส้น, รายการ legend ระบุซีรีส์ สำหรับแผนภูมิพาย, รายการเหล่านี้ระบุจุดข้อมูลแต่ละจุด (ชิ้น) ดังนั้นใช้ IChartDataPoint::get_RelatedLegendEntry กับชิ้นที่เลือกแทน API ระบุเมธอดจุดข้อมูลนี้สำหรับประเภทแผนภูมิ Pie, Pie3D, ExplodedPie, ExplodedPie3D, PieOfPie, และ BarOfPie อย่าสันนิษฐานว่ามันใช้ได้กับแผนภูมิดอนัท ซึ่งไม่ได้อยู่ในรายการนั้น.
FAQ
ฉันสามารถทำให้แผนภูมิสำรองพื้นที่สำหรับ legend แทนการวางทับได้หรือไม่?
ใช่. เรียก set_Overlay ด้วยค่า false เพื่อสำรองพื้นที่สำหรับ legend แทนให้มันทับพื้นที่แผนภูมิ.
ฉันสามารถทำให้ป้าย legend เป็นหลายบรรทัดได้หรือไม่?
ใช่. ป้ายที่ยาวสามารถขึ้นบรรทัดใหม่เมื่อความกว้างที่มีไม่เพียงพอ คุณยังสามารถใช้ตัวอักขระขึ้นบรรทัดใหม่ในชื่อซีรีส์เพื่อขอการตัดบรรทัด.
ฉันจะทำให้ legend ปฏิบัติตามโทนสีของธีมงานนำเสนอได้อย่างไร?
ให้ปล่อยให้สี, การเติมสี, และแบบอักษรของ legend ไม่ถูกตั้งค่าเพื่อให้มันสืบทอดการจัดรูปแบบจากธีม การกำหนดรูปแบบโดยตรงจะละเมิดการตั้งค่าธีมที่สอดคล้องกัน.