
จัดการชุดข้อมูลแผนภูมิในการนำเสนอด้วย Java
ภาพรวม
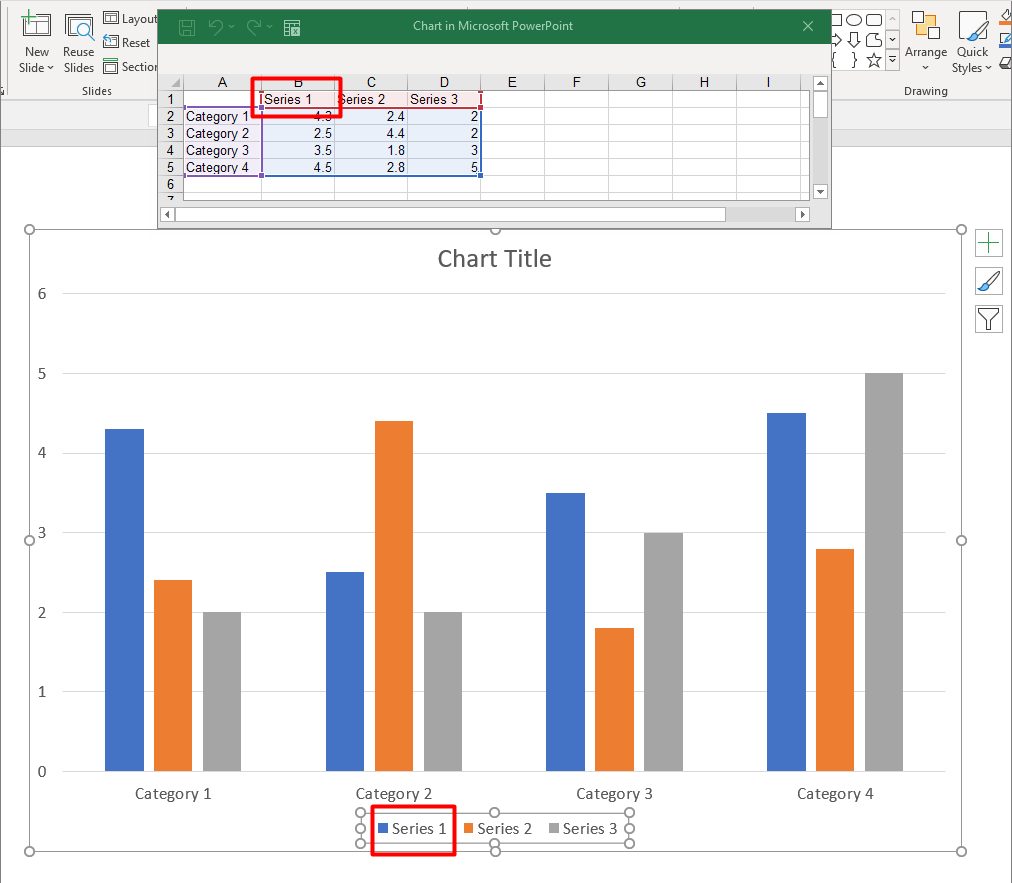
แผนภูมิจะเก็บข้อมูลที่วาดไว้ในสมุดงานข้อมูลแผนภูมิ. An IChartSeries represents one set of related values, and each IChartDataPoint in the series refers to one or more workbook cells. IChartCategory objects provide the labels or grouping values shared by the series. The series name, categories, and point values are therefore connected to IChartDataCell objects rather than stored only as display text.
สำหรับแผนภูมิประเภทหมวดหมู่ทั่วไป สมุดงานค่าเริ่มต้นจะใช้แถว 0 สำหรับชื่อชุด, คอลัมน์ 0 สำหรับชื่อหมวดหมู่, และเซลล์ที่เหลือสำหรับค่าชุด. ตัวชี้ตำแหน่ง Worksheet, row, และ column ที่ส่งไปยัง IChartDataWorkbook.getCell เป็นแบบศูนย์ต้น. การจัดวางนี้มีประโยชน์เมื่อคุณสร้างแผนภูมิด้วยข้อมูลค่าเริ่มต้น, แต่ไม่ควรสันนิษฐานว่าทุกแผนภูมิที่มีอยู่ใช้แบบนี้. สำหรับงานนำเสนอที่โหลดแล้ว, ตรวจสอบเซลล์ที่อ้างอิงโดยชุด, หมวดหมู่, และจุดข้อมูลก่อนทำการเปลี่ยนแปลงค่าในสมุดงาน.
การตั้งค่าแผนภูมิมีสามระดับแตกต่างกัน:
- การตั้งค่าระดับชุด, เช่น IChartSeries.getFormat ให้การแสดงผลพื้นฐานสำหรับทุกจุดในชุดหนึ่ง.
- การตั้งค่าระดับจุดข้อมูล, เช่น IChartDataPoint.getFormat จะลบล้างการแสดงผลของชุดสำหรับจุดเดียว.
- การตั้งค่ากลุ่มใช้กับชุดที่เข้ากันได้ซึ่งอยู่ใน IChartSeriesGroup. เข้าถึงกลุ่มผ่าน IChartSeries.getParentSeriesGroup เมื่อคุณต้องการตั้งค่าตัวเลือกเช่นการทับซ้อนหรือความกว้างช่องว่าง.
เมื่อไม่ได้ตั้งค่าสีเติมจุดหรือชุดอย่างชัดเจน, สไตล์และธีมของแผนภูมิจะกำหนดการแสดงผลอัตโนมัติ. เมื่อทั้งการจัดรูปแบบของชุดและจุดมีอยู่, การจัดรูปแบบของจุดจะมีสิทธิ์เหนือสำหรับจุดนั้น.
ตั้งค่าการทับซ้อนของชุดแผนภูมิ
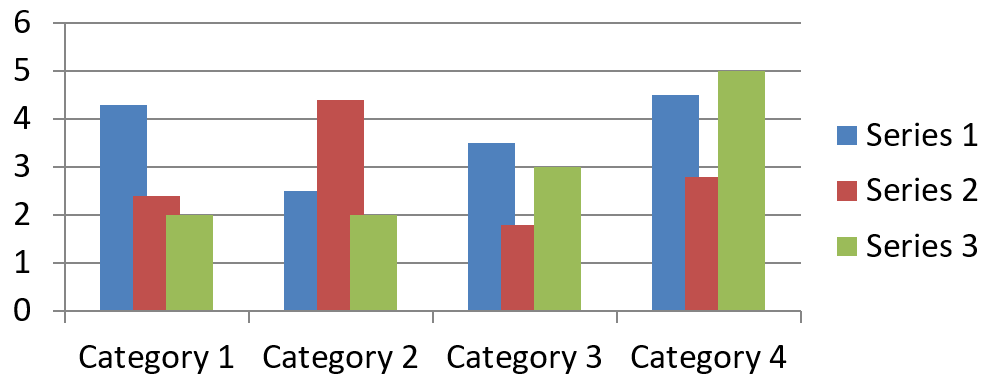
IChartSeries.getOverlap รายงานว่าบาร์หรือคอลัมน์ทับซ้อนกันเท่าไหร่ในแผนภูมิ 2D, ตั้งแต่ -100 ถึง 100 เปอร์เซ็นต์. มันเป็นการฉายภาพแบบอ่านอย่างเดียวของการตั้งค่าในกลุ่มชุดแม่. ใช้ IChartSeriesGroup.setOverlap เพื่ออัปเดตทุกชุดที่เข้ากันได้ในกลุ่มนั้น. ตัวเลือกนี้ใช้กับประเภทแผนภูมิที่แสดงบาร์หรือคอลัมน์กลุ่ม; จะไม่ส่งผลต่อกลุ่มชุดที่ไม่เกี่ยวข้องในแผนภูมิแบบผสม.
ตัวอย่างต่อไปนี้ตั้งค่าการทับซ้อนสำหรับกลุ่มที่มีชุดแรกอยู่ในนั้น:
import com.aspose.slides.*;

final int firstSlideIndex = 0;
final int firstSeriesIndex = 0;
final byte overlapPercent = 30;

Presentation presentation = new Presentation();
try {
    ISlide slide = presentation.getSlides().get_Item(firstSlideIndex);

    // แผนภูมิใหม่มีชุดตัวอย่าง, หมวดหมู่, และค่า.
    IChart chart = slide.getShapes().addChart(ChartType.ClusteredColumn, 20, 20, 500, 200);

    IChartSeries series = chart.getChartData().getSeries().get_Item(firstSeriesIndex);
    series.getParentSeriesGroup().setOverlap(overlapPercent);

    presentation.save("series_overlap.pptx", SaveFormat.Pptx);
} finally {
    presentation.dispose();
}
ผลลัพธ์:
เปลี่ยนสีเติมของชุด
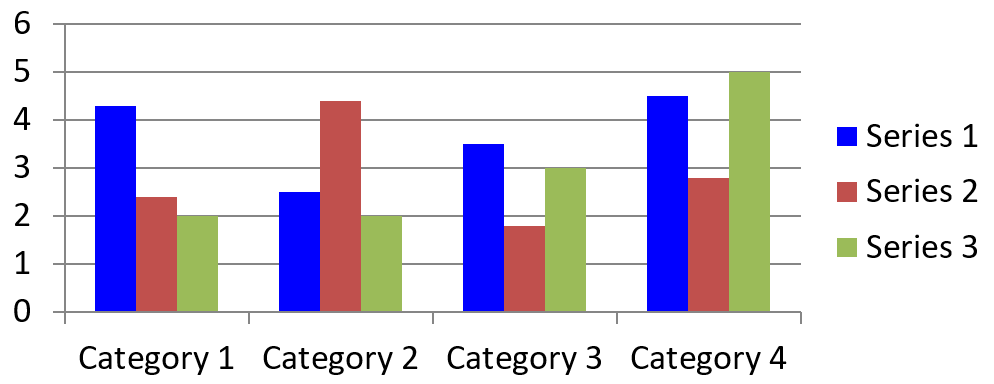
ใช้ IChartSeries.getFormat เพื่อกำหนดสีเติมค่าเริ่มต้นสำหรับชุดทั้งหมด. หากจุดมีสีเติมที่กำหนดไว้แล้ว, การตั้งค่า IChartDataPoint.getFormat จะลบล้างสีเติมของชุดสำหรับจุดนั้น.
ตัวอย่างต่อไปนี้ใช้สีเติมแบบทึบสีฟ้าสำหรับชุดแรก:
import com.aspose.slides.*;
import java.awt.Color;

final int firstSlideIndex = 0;
final int firstSeriesIndex = 0;

Presentation presentation = new Presentation();
try {
    ISlide slide = presentation.getSlides().get_Item(firstSlideIndex);

    IChart chart = slide.getShapes().addChart(ChartType.ClusteredColumn, 20, 20, 500, 200);

    IChartSeries series = chart.getChartData().getSeries().get_Item(firstSeriesIndex);
    series.getFormat().getFill().setFillType(FillType.Solid);
    series.getFormat().getFill().getSolidFillColor().setColor(Color.BLUE);

    presentation.save("series_color.pptx", SaveFormat.Pptx);
} finally {
    presentation.dispose();
}
ผลลัพธ์:
เปลี่ยนชื่อชุด
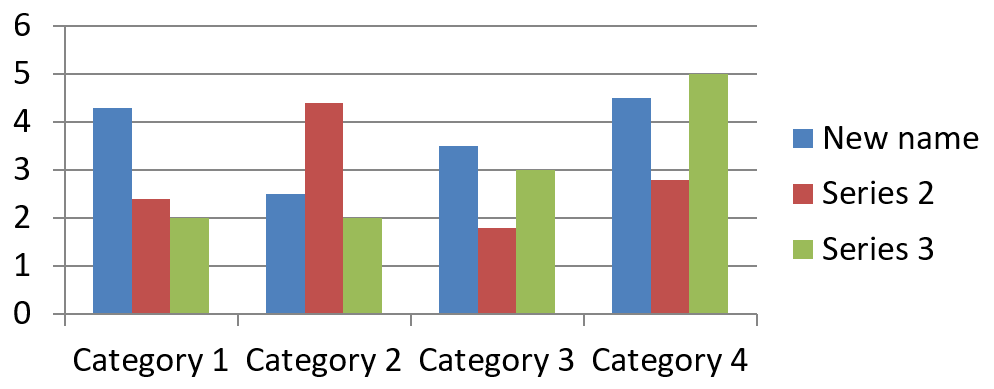
ชื่อชุดจะถูกเก็บในสมุดงานข้อมูลแผนภูมิและทั่วไปจะแสดงใน legend. ในสมุดงานค่าเริ่มต้นที่สร้างสำหรับแผนภูมิคอลัมน์แบบกลุ่ม, เซลล์ B1 อยู่ที่แถว 0, คอลัมน์ 1 และมีชื่อของชุดแรก. ค่าคงที่ที่ระบุชื่อในตัวอย่างต่อไปนี้ทำให้โครงสร้างดังกล่าวชัดเจน:
import com.aspose.slides.*;

final int firstSlideIndex = 0;
final int worksheetIndex = 0;
final int seriesNameRowIndex = 0;
final int firstSeriesColumnIndex = 1;

Presentation presentation = new Presentation();
try {
    ISlide slide = presentation.getSlides().get_Item(firstSlideIndex);

    IChart chart = slide.getShapes().addChart(ChartType.ClusteredColumn, 20, 20, 500, 200);

    IChartDataWorkbook workbook = chart.getChartData().getChartDataWorkbook();
    IChartDataCell seriesNameCell = workbook.getCell(worksheetIndex, seriesNameRowIndex, firstSeriesColumnIndex);
    seriesNameCell.setValue("Revenue");

    presentation.save("series_name.pptx", SaveFormat.Pptx);
} finally {
    presentation.dispose();
}
คุณยังสามารถอัปเดตเซลล์ที่อ้างอิงโดย IChartSeries.getName ได้. วิธีนี้หลีกเลี่ยงการสันนิษฐานแถวและคอลัมน์เฉพาะในแผนภูมิที่มีอยู่:
import com.aspose.slides.*;

final int firstSlideIndex = 0;
final int firstSeriesIndex = 0;
final int firstNameCellIndex = 0;

Presentation presentation = new Presentation();
try {
    ISlide slide = presentation.getSlides().get_Item(firstSlideIndex);

    IChart chart = slide.getShapes().addChart(ChartType.ClusteredColumn, 20, 20, 500, 200);

    IChartSeries series = chart.getChartData().getSeries().get_Item(firstSeriesIndex);
    IChartDataCell seriesNameCell = series.getName().getAsCells().get_Item(firstNameCellIndex);
    seriesNameCell.setValue("Revenue");

    presentation.save("series_name.pptx", SaveFormat.Pptx);
} finally {
    presentation.dispose();
}
ผลลัพธ์:
สร้างชุดด้วยชื่อจากหลายเซลล์
ชื่อชุดแบบประกอบมีประโยชน์เมื่อชื่อผลิตภัณฑ์และช่วงเวลารายงานถูกเก็บในเซลล์สมุดงานแยกกัน. ตัวอย่างเช่น, คุณสามารถรวม Product A ใน B1 และ 2026 ใน C1 ให้เป็นชื่อชุดเดียว while keeping both parts linked to their source cells.
ใช้ IChartDataWorkbook.getCellCollection เพื่อดึงช่วงชื่อ, แล้วส่งคอลเลกชันนั้นให้กับ IChartSeriesCollection.add. พารามิเตอร์ skipHiddenCells ควบคุมว่าจะรวมเซลล์ที่ซ่อนอยู่หรือไม่: true จะไม่รวม, false จะรวม. ตัวอย่างนี้ใช้ false เพื่อรวมทุกเซลล์ในช่วงชื่อ.
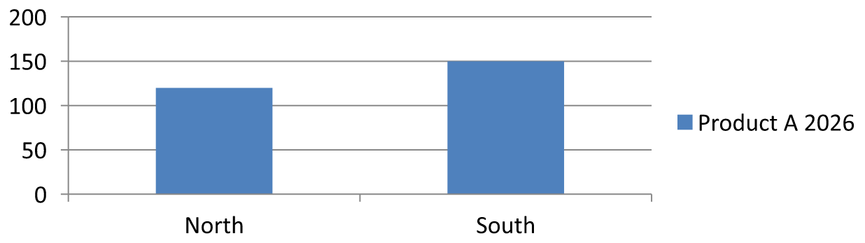
ตัวอย่างต่อไปนี้สร้างงานนำเสนอที่มีชุดหนึ่งและจุดข้อมูลสองจุด. เซลล์ B1:C1 ให้เฉพาะชื่อชุด; A2:A3 ให้ป้ายหมวดหมู่, และ B2:B3 ให้ค่าตัวเลข.
import com.aspose.slides.*;

Presentation presentation = new Presentation();
try {
    ISlide slide = presentation.getSlides().get_Item(0);

    IChart chart = slide.getShapes().addChart(ChartType.ClusteredColumn, 50, 50, 620, 180);

    chart.getChartData().getSeries().clear();
    chart.getChartData().getCategories().clear();
    chart.setLegend(true);

    IChartDataWorkbook workbook = chart.getChartData().getChartDataWorkbook();
    workbook.clear(0);

    // เซลล์สองเซลล์นี้ให้ชื่อชุด.
    workbook.getCell(0, 0, 1, "Product A");
    workbook.getCell(0, 0, 2, "2026");
    IChartCellCollection nameCells = workbook.getCellCollection("Sheet1!$B$1:$C$1", false);
    IChartSeries series = chart.getChartData().getSeries().add(nameCells, ChartType.ClusteredColumn);

    // เซลล์แยกกันให้ค่าหมวดหมู่และจุดข้อมูลเชิงตัวเลข.
    IChartDataCell northCategory = workbook.getCell(0, 1, 0, "North");
    IChartDataCell southCategory = workbook.getCell(0, 2, 0, "South");
    chart.getChartData().getCategories().add(northCategory);
    chart.getChartData().getCategories().add(southCategory);
    IChartDataCell northValue = workbook.getCell(0, 1, 1, 120);
    IChartDataCell southValue = workbook.getCell(0, 2, 1, 150);
    series.getDataPoints().addDataPointForBarSeries(northValue);
    series.getDataPoints().addDataPointForBarSeries(southValue);

    presentation.save("composite_series_name.pptx", SaveFormat.Pptx);
} finally {
    presentation.dispose();
}
ชื่อชุดที่ได้คือ Product A 2026, มีช่องว่างระหว่างสองค่าจากเซลล์. Legend แสดงเป็นรายการเดียวสำหรับทั้งสองคอลัมน์. ภาพด้านล่างอธิบายผลลัพธ์:
รับสีเติมอัตโนมัติของชุด
IChartSeries.getAutomaticSeriesColor คืนค่าสีที่คำนวณจากดัชนีชุดและสไตล์แผนภูมิ. นี้คือสีที่ใช้เมื่อสีเติมของชุดไม่ได้กำหนดอย่างชัดเจน. การเรียกเมธ็อดนี้อ่านสีที่คำนวณได้; แต่ไม่กำหนดสีเติมใหม่.
ตัวอย่างต่อไปนี้พิมพ์สีอัตโนมัติของแต่ละชุดค่าเริ่มต้น:
import com.aspose.slides.*;
import java.awt.Color;

final int firstSlideIndex = 0;

Presentation presentation = new Presentation();
try {
    ISlide slide = presentation.getSlides().get_Item(firstSlideIndex);

    IChart chart = slide.getShapes().addChart(ChartType.ClusteredColumn, 20, 20, 500, 200);

    int seriesCount = chart.getChartData().getSeries().size();
    for (int seriesIndex = 0; seriesIndex < seriesCount; seriesIndex++) {
        IChartSeries series = chart.getChartData().getSeries().get_Item(seriesIndex);
        Color automaticColor = series.getAutomaticSeriesColor();
        System.out.println("Series " + seriesIndex + ": " + automaticColor);
    }
} finally {
    presentation.dispose();
}
ผลลัพธ์ตัวอย่างสำหรับสไตล์แผนภูมิค่าเริ่มต้น:
Series 0: java.awt.Color[r=79,g=129,b=189]
Series 1: java.awt.Color[r=192,g=80,b=77]
Series 2: java.awt.Color[r=155,g=187,b=89]
สีที่แน่นอนขึ้นอยู่กับสไตล์และธีมของแผนภูมิ.
ตั้งค่าสีเติมกลับสำหรับชุดแผนภูมิ
สำหรับชุดประเภทบาร์, คอลัมน์, และบับเบิล, IChartSeries.setInvertIfNegative สามารถแสดงค่าติดลบด้วยสีเติมที่ต่างออกไป. ตั้งค่าสีเติมของชุดปกติเป็นแบบทึบ, เปิดใช้งานการกลับสี, และกำหนดสีค่าติดลบผ่าน IChartSeries.getInvertedSolidFillColor. ตัวเลขติดลบจะไม่เปลี่ยนในสมุดงาน; มีเพียงสีที่แสดงที่เปลี่ยน.
ตัวอย่างต่อไปนี้แทนที่ข้อมูลแผนภูมิค่าเริ่มต้นด้วยชุดหนึ่ง. แถว 0 ของ Worksheet มีชื่อชุด, คอลัมน์ 0 มีชื่อหมวดหมู่, คอลัมน์ 1 มีค่าต่างๆ:
import com.aspose.slides.*;
import java.awt.Color;

final int firstSlideIndex = 0;
final int worksheetIndex = 0;
final int headerRowIndex = 0;
final int categoryColumnIndex = 0;
final int firstSeriesColumnIndex = 1;
final int firstDataRowIndex = 1;

String[] categoryNames = { "Category 1", "Category 2", "Category 3" };
int[] seriesValues = { -20, 50, -30 };

Presentation presentation = new Presentation();
try {
    ISlide slide = presentation.getSlides().get_Item(firstSlideIndex);

    IChart chart = slide.getShapes().addChart(ChartType.ClusteredColumn, 20, 20, 500, 200);
    IChartData chartData = chart.getChartData();
    IChartDataWorkbook workbook = chartData.getChartDataWorkbook();

    chartData.getSeries().clear();
    chartData.getCategories().clear();

    IChartDataCell seriesNameCell = workbook.getCell(worksheetIndex, headerRowIndex, firstSeriesColumnIndex, "Series 1");
    int chartType = chart.getType();
    IChartSeries series = chartData.getSeries().add(seriesNameCell, chartType);

    for (int categoryIndex = 0; categoryIndex < categoryNames.length; categoryIndex++) {
        int dataRowIndex = firstDataRowIndex + categoryIndex;
        String categoryName = categoryNames[categoryIndex];
        int seriesValue = seriesValues[categoryIndex];

        IChartDataCell categoryCell = workbook.getCell(worksheetIndex, dataRowIndex, categoryColumnIndex, categoryName);
        chartData.getCategories().add(categoryCell);

        IChartDataCell valueCell = workbook.getCell(worksheetIndex, dataRowIndex, firstSeriesColumnIndex, seriesValue);
        series.getDataPoints().addDataPointForBarSeries(valueCell);
    }

    Color automaticSeriesColor = series.getAutomaticSeriesColor();
    series.getFormat().getFill().setFillType(FillType.Solid);
    series.getFormat().getFill().getSolidFillColor().setColor(automaticSeriesColor);
    series.setInvertIfNegative(true);
    series.getInvertedSolidFillColor().setColor(Color.RED);

    presentation.save("inverted_solid_fill_color.pptx", SaveFormat.Pptx);
} finally {
    presentation.dispose();
}
ผลลัพธ์:

คุณสามารถเปิดการกลับสีสำหรับจุดเดียวผ่าน IChartDataPoint.setInvertIfNegative. ในตัวอย่างต่อไปนี้, การกลับสีถูกปิดสำหรับชุดและเปิดเฉพาะสำหรับจุดที่เลือก. จุดนั้นยังถูกกำหนดค่าติดลบเพื่อให้เห็นผล:
import com.aspose.slides.*;
import java.awt.Color;

final int firstSlideIndex = 0;
final int firstSeriesIndex = 0;
final int targetDataPointIndex = 2;
final int negativeValue = -30;

Presentation presentation = new Presentation();
try {
    ISlide slide = presentation.getSlides().get_Item(firstSlideIndex);

    IChart chart = slide.getShapes().addChart(ChartType.ClusteredColumn, 20, 20, 500, 200);

    IChartSeries series = chart.getChartData().getSeries().get_Item(firstSeriesIndex);
    Color automaticSeriesColor = series.getAutomaticSeriesColor();
    series.getFormat().getFill().setFillType(FillType.Solid);
    series.getFormat().getFill().getSolidFillColor().setColor(automaticSeriesColor);
    series.getInvertedSolidFillColor().setColor(Color.RED);
    series.setInvertIfNegative(false);

    IChartDataPoint dataPoint = series.getDataPoints().get_Item(targetDataPointIndex);
    dataPoint.getValue().getAsCell().setValue(negativeValue);
    dataPoint.setInvertIfNegative(true);

    presentation.save("data_point_invert_color_if_negative.pptx", SaveFormat.Pptx);
} finally {
    presentation.dispose();
}
ล้างค่าจุดข้อมูลเฉพาะ
เพื่อทำให้จุดหนึ่งว่างโดยไม่ลบจุดอื่น, ตั้งค่าเซลล์ในสมุดงานที่เป็นพื้นหลังของจุดนั้นเป็น null. สำหรับแผนภูมิคอลัมน์, ค่าที่วาดได้สามารถเข้าถึงได้ผ่าน IChartDataPoint.getValue. จุดข้อมูลจะคงอยู่ที่ตำแหน่งหมวดหมู่เดิม, แต่แผนภูมิจัดการค่าของมันเป็นค่าว่างตามการตั้งค่าค่าว่างของแผนภูมิ.
ตัวอย่างต่อไปนี้ลบเฉพาะจุดที่สองในชุดแรก:
import com.aspose.slides.*;

final int firstSlideIndex = 0;
final int firstSeriesIndex = 0;
final int targetDataPointIndex = 1;

Presentation presentation = new Presentation();
try {
    ISlide slide = presentation.getSlides().get_Item(firstSlideIndex);

    IChart chart = slide.getShapes().addChart(ChartType.ClusteredColumn, 20, 20, 500, 200);

    IChartSeries series = chart.getChartData().getSeries().get_Item(firstSeriesIndex);
    IChartDataPoint dataPoint = series.getDataPoints().get_Item(targetDataPointIndex);
    dataPoint.getValue().getAsCell().setValue(null);

    presentation.save("clear_data_point_value.pptx", SaveFormat.Pptx);
} finally {
    presentation.dispose();
}
แผนภูมิสแคตเตอร์ใช้เซลล์ X และ Y แยกกัน, และแผนภูมิบับเบิลยังใช้เซลล์ขนาดด้วย. ให้ลบเฉพาะเซลล์ที่แทนค่าที่คุณต้องการลบ. อย่าเรียก IChartDataPointCollection.clear เมื่อคุณต้องการเก็บจุดอื่นไว้, เพราะเมธ็อดนั้นจะลบจุดข้อมูลทั้งหมดจากคอลเลกชัน.
ควบคุมการแสดงเซลล์ว่าง
เซลล์ที่ซ่อนอยู่และมีค่าเป็นกรณีแยกจากเซลล์ว่าง. เพื่อรวมหรือแยกข้อมูลจากแถวและคอลัมน์ที่ซ่อนอยู่, ดู รวมข้อมูลจากแถวและคอลัมน์ที่ซ่อนอยู่.
เซลล์สมุดงานว่างแสดงถึงข้อมูลที่หายไป; เซลล์ที่มี 0 แสดงถึงค่าตัวเลขที่ทราบ. เรียก IChartDataCell.setValue พร้อม null เพื่อทำให้เซลล์ว่าง. ศูนย์ตัวเลขจะคงเป็นศูนย์ไม่ว่าการตั้งค่าเซลล์ว่างเป็นอย่างไร.
ใช้ IChart.setDisplayBlanksAs เพื่อเลือกว่แผนภูมิจะแสดงเซลล์ว่างอย่างไร. การตั้งค่านี้ใช้กับแผนภูมิเจทั้งหมด. มันเปลี่ยนวิธีการวาดค่าที่ว่างโดยไม่เติมค่า 0 หรือค่าประมาณในเซลล์สมุดงานว่าง.
ตัวอย่างต่อไปนี้สร้างแผนภูมิเส้นที่มีชุดหนึ่ง, ลบค่าของ Day 3, และบันทึกแผนภูมิเดียวกันในแต่ละโหมด. ไม่ต้องใช้ไฟล์อินพุต. IChartDataWorkbook ใช้ Worksheet 0, คอลัมน์ 0 สำหรับป้ายหมวดหมู่, และคอลัมน์ 1 สำหรับค่า; แถว 0 เก็บชื่อชุด. ข้อมูลสุดท้ายคือ 10, 20, empty, 30, 40.
import com.aspose.slides.*;

Presentation presentation = new Presentation();
try {
    ISlide slide = presentation.getSlides().get_Item(0);

    IChart chart = slide.getShapes().addChart(ChartType.LineWithMarkers, 40, 40, 640, 400);
    IChartData chartData = chart.getChartData();
    IChartDataWorkbook workbook = chartData.getChartDataWorkbook();

    chartData.getSeries().clear();
    chartData.getCategories().clear();

    IChartDataCell seriesNameCell = workbook.getCell(0, 0, 1, "Measurements");
    IChartSeries series = chartData.getSeries().add(seriesNameCell, chart.getType());
    int[] values = { 10, 20, 25, 30, 40 };

    for (int i = 0; i < values.length; i++) {
        IChartDataCell categoryCell = workbook.getCell(0, i + 1, 0, "Day " + (i + 1));
        chartData.getCategories().add(categoryCell);
        IChartDataCell valueCell = workbook.getCell(0, i + 1, 1, values[i]);
        series.getDataPoints().addDataPointForLineSeries(valueCell);
    }

    // ปล่อยให้ Day 3 เป็นค่าว่างจริง ๆ ในขณะที่ยังคงรักษาหมวดหมู่และจุดข้อมูลไว้
    workbook.getCell(0, 3, 1).setValue(null);

    int[] modes = { DisplayBlanksAsType.Gap, DisplayBlanksAsType.Zero, DisplayBlanksAsType.Span };
    String[] modeNames = { "Gap", "Zero", "Span" };
    for (int i = 0; i < modes.length; i++) {
        chart.setDisplayBlanksAs(modes[i]);
        presentation.save("empty_cells_" + modeNames[i] + ".pptx", SaveFormat.Pptx);
    }
} finally {
    presentation.dispose();
}
แต่ละไฟล์ผลลัพธ์จะบันทึกโหมดที่กำหนดก่อนบันทึก: empty_cells_Gap.pptx, empty_cells_Zero.pptx, และ empty_cells_Span.pptx. หากต้องการบันทึกเวอร์ชันเดียว, กำหนดโหมดที่ต้องการและบันทึกงานนำเสนอครั้งเดียวแทนการวนลูปตามโหมด.
การเปรียบเทียบด้านล่างแสดงข้อมูลเดียวกันในไฟล์ทั้งสาม. Day 3 จะว่างในสมุดงานในทุกกรณี:
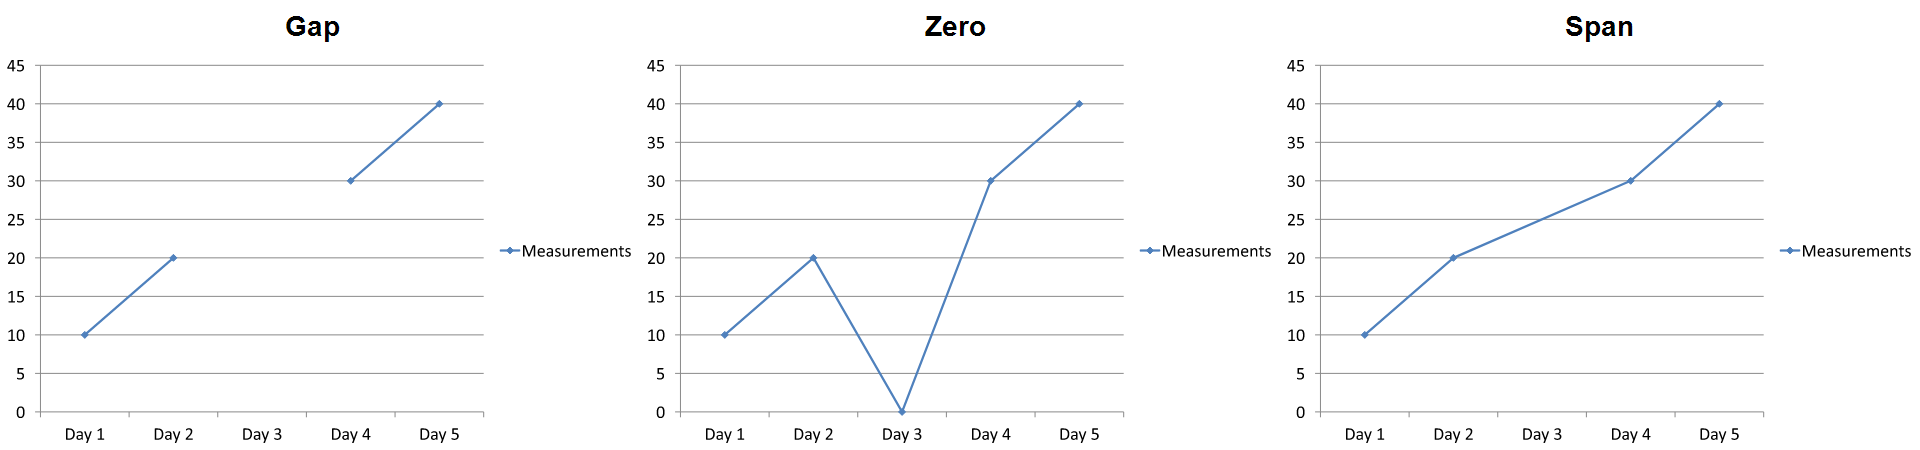
ผลลัพธ์ที่มองเห็นขึ้นอยู่กับประเภทแผนภูมิ. แผนภูมิเส้นทำให้สามโหมดเปรียบเทียบได้ง่าย. แผนภูมิแท่งและคอลัมน์ไม่มีเส้นเชื่อมข้ามหมวดหมู่ที่หายไป, ดังนั้น Span ไม่สามารถสร้างส่วนเชื่อมที่แสดงด้านบน; คอลัมน์ที่หายและคอลัมน์สูงศูนย์อาจดูคล้ายกัน. เช่นเดียวกับแผนภูมิสแคตเตอร์ที่มีเพียงมาร์คเกอร์ก็ไม่มีเส้นเชื่อม. อย่าคาดหวังผลลัพธ์ที่แตกต่างสามแบบสำหรับทุกประเภทแผนภูมิ; ตรวจสอบผลลัพธ์สำหรับประเภทที่คุณใช้.
ตั้งค่าความกว้างช่องว่างของชุด
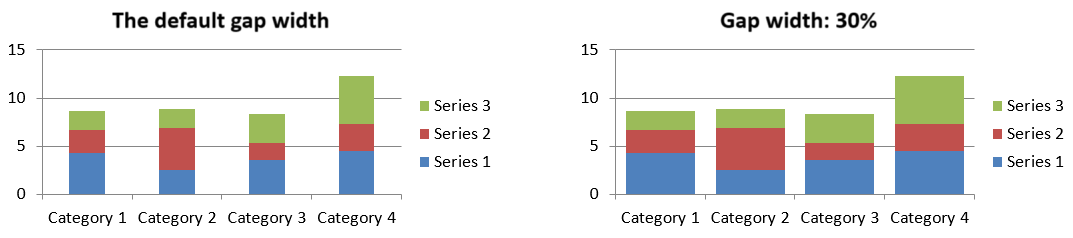
ความกว้างช่องว่างคือพื้นที่ระหว่างคลัสเตอร์บาร์หรือคอลัมน์ที่อยู่ติดกัน, แสดงเป็นเปอร์เซ็นต์ของความกว้างบาร์หรือคอลัมน์. เช่นเดียวกับการทับซ้อน, มันเป็นของกลุ่มชุดแม่ ไม่ได้เป็นของชุดเดียว. เรียก IChartSeriesGroup.setGapWidth ครั้งเดียวสำหรับกลุ่ม. ค่าใหญ่ทำให้มีพื้นที่ระหว่างคลัสเตอร์มากขึ้น; ค่าน้อยทำให้คลัสเตอร์หนาแน่นขึ้น.
ตัวอย่างต่อไปนี้เปลี่ยนความกว้างช่องว่างและบันทึกเฉพาะงานนำเสนอสุดท้าย:
import com.aspose.slides.*;

final int firstSlideIndex = 0;
final int firstSeriesIndex = 0;
final int gapWidthPercent = 30;

Presentation presentation = new Presentation();
try {
    ISlide slide = presentation.getSlides().get_Item(firstSlideIndex);

    IChart chart = slide.getShapes().addChart(ChartType.StackedColumn, 20, 20, 500, 200);

    IChartSeries series = chart.getChartData().getSeries().get_Item(firstSeriesIndex);
    series.getParentSeriesGroup().setGapWidth(gapWidthPercent);

    presentation.save("gap_width_30.pptx", SaveFormat.Pptx);
} finally {
    presentation.dispose();
}
ผลลัพธ์:
คำถามที่พบบ่อย
ประเภทแผนภูมิใดที่รองรับชุดข้อมูล?
All chart types represented by the ChartType enumeration use chart data, but their series do not all have the same value structure or settings. For example, category charts use categories and values, scatter charts use X and Y values, and bubble charts add bubble sizes. Use the data-point creation method that matches the series type. Options such as overlap and gap width apply only to compatible bar or column groups.
กลุ่มชุดแผนภูมิคืออะไร?
An IChartSeriesGroup contains compatible series that share group-level plotting settings. A combination chart can contain more than one group, so changing the group reached through one series does not necessarily change every series in the chart.
แผนภูมิที่สร้างใหม่มีข้อมูลค่าเริ่มต้นหรือไม่?
Yes. By default, IShapeCollection.addChart creates sample series, categories, and values. You can edit those cells or clear both the series and category collections before adding a completely custom data set. An overload can also create a chart without default data.
วัตถุแผนภูมิเชื่อมต่อกับเซลล์สมุดงานอย่างไร?
Series names, category labels, and data-point values reference cells in an IChartDataWorkbook. Changing a referenced cell updates the corresponding chart element. When you build custom data, keep category rows and series-value rows aligned so that each point is plotted under the intended category.
จะลบจุดเดียวแทนการลบชุดทั้งหมดอย่างไร?
Set the relevant value cell to null to retain the point’s category position as an empty point. Use IChartDataPointCollection.clear only when you intend to remove all points from that series. If you also remove categories, update every series so their values remain aligned with the category collection.
จุดว่างจะแสดงอย่างไร?
The result depends on the chart type and the value configured through IChart.setDisplayBlanksAs. Supported charts can display blanks as gaps, as zero values, or by connecting neighboring points. Choose the setting that matches the meaning of missing data in your presentation. See ควบคุมการแสดงเซลล์ว่าง for a complete example and visual comparison.
ค่าติดลบถูกจัดรูปแบบอย่างไร?
For supported bar, column, and bubble series, call IChartSeries.setInvertIfNegative and set the color returned by IChartSeries.getInvertedSolidFillColor. You can override the behavior for an individual point with IChartDataPoint.setInvertIfNegative. These methods affect formatting, not the stored numeric values.
การจัดรูปแบบใดชนะเมื่อทั้งชุดและจุดถูกจัดรูปแบบ?
Explicit data-point formatting takes precedence for that point. Other points continue to use the explicit series format or, when the series format is not defined, the automatic chart style and theme. Group settings such as overlap and gap width control layout and are not point-level formatting overrides.
มีขีดจำกัดจำนวนชุดที่แผนภูมิสามารถมีได้หรือไม่?
Aspose.Slides does not impose a separate fixed series-count limit. In practice, presentation file constraints, available memory, rendering time, and chart readability determine a useful limit.
ควรเปลี่ยนอะไรเมื่อคอลัมน์ใกล้กันเกินไปหรือห่างกันเกินไป?
Call IChartSeriesGroup.setGapWidth on the appropriate parent series group. Increase the value to widen the space between clusters, or decrease it to bring the clusters closer together.