
สร้างหรืออัปเดตแผนภูมิในงานนำเสนอ PowerPoint ด้วย Java
ภาพรวม
บทความนี้ให้คำแนะนำครอบคลุมเกี่ยวกับวิธีการสร้างและปรับแต่งแผนภูมิด้วย Aspose.Slides คุณจะได้เรียนรู้วิธีการเพิ่มแผนภูมิลงในสไลด์อย่างโปรแกรมเมติก เติมข้อมูลลงในแผนภูมิ และใช้ตัวเลือกการฟอร์แมตต่าง ๆ เพื่อให้ตรงกับความต้องการออกแบบของคุณ ตลอดบทความจะมีตัวอย่างโค้ดอย่างละเอียดอธิบายแต่ละขั้นตอน ตั้งแต่การเริ่มต้น Presentation และอ็อบเจ็กต์แผนภูมิ ไปจนถึงการตั้งค่า Series, Axes, และ Legends การทำตามคู่มือนี้จะช่วยให้คุณเข้าใจวิธีการผสานการสร้างแผนภูมิแบบไดนามิกเข้าสู่แอปพลิเคชันของคุณ ทำให้กระบวนการสร้างงานนำเสนอที่ขับเคลื่อนด้วยข้อมูลเป็นเรื่องง่ายและรวดเร็ว
สร้างแผนภูมิ
แผนภูมิช่วยให้คนมองเห็นข้อมูลและได้ข้อสรุปที่อาจไม่ชัดเจนจากตารางหรือสเปรดชีต
ทำไมต้องสร้างแผนภูมิ?
โดยใช้แผนภูมิคุณสามารถ:
- รวม, ย่อ, หรือสรุปข้อมูลจำนวนมากลงในสไลด์เดียวของงานนำเสนอ
- เปิดเผยรูปแบบและแนวโน้มของข้อมูล
- สรุปทิศทางและโมเมนตัมของข้อมูลตามช่วงเวลา หรือเทียบกับหน่วยวัดเฉพาะ
- พบค่าผิดปกติ, ความเบี่ยงเบน, ข้อผิดพลาด, ข้อมูลที่ไม่มีความหมาย ฯลฯ
- สื่อสารหรือแสดงข้อมูลซับซ้อน
ใน PowerPoint คุณสามารถสร้างแผนภูมิผ่านฟังก์ชัน Insert ซึ่งให้แม่แบบสำหรับออกแบบแผนภูมิมากมาย โดยใช้ Aspose.Slides คุณสามารถสร้างแผนภูมิปกติ (ตามประเภทแผนภูมิที่เป็นที่นิยม) และแผนภูมิที่กำหนดเองได้
หมายเหตุ
เพื่อสร้างแผนภูมิ ให้ใช้คลาส ChartType ฟิลด์ในคลาสนี้สอดคล้องกับประเภทแผนภูมิต่าง ๆสร้าง Clustered Column Charts
ส่วนนี้อธิบายวิธีสร้าง clustered column charts ด้วย Aspose.Slides คุณจะได้เรียนรู้การเริ่มต้น Presentation, เพิ่มแผนภูมิ, และปรับแต่งองค์ประกอบต่าง ๆ เช่น ชื่อเรื่อง, ข้อมูล, Series, Categories, และสไตล์ ทำตามขั้นตอนด้านล่างเพื่อดูว่าการสร้าง clustered column chart มาตรฐานทำอย่างไร:
- สร้างอ็อบเจ็กต์ของคลาส Presentation
- รับอ้างอิงสไลด์โดยใช้ดัชนีของมัน
- เพิ่มแผนภูมิพร้อมข้อมูลบางส่วนและกำหนดประเภท
ChartType.ClusteredColumn - เพิ่มชื่อเรื่องให้กับแผนภูมิ
- เข้าถึง worksheet ของข้อมูลแผนภูมิ
- ล้าง Series และ Categories เริ่มต้นทั้งหมด
- เพิ่ม Series และ Categories ใหม่
- เพิ่มข้อมูลแผนภูมิใหม่สำหรับ Series
- กำหนดสีเติมให้กับ Series
- เพิ่ม label ให้กับ Series
- บันทึก Presentation ที่แก้ไขเป็นไฟล์ PPTX
โค้ด C# นี้แสดงวิธีสร้าง clustered column chart:
import com.aspose.slides.*;
import java.awt.Color;

// สร้างอ็อบเจ็กต์ของคลาส Presentation ที่เป็นตัวแทนของไฟล์ PPTX
Presentation pres = new Presentation();
try {
    // เข้าถึงสไลด์แรก
    ISlide sld = pres.getSlides().get_Item(0);

    // เพิ่มแผนภูมิพร้อมข้อมูลค่าเริ่มต้น
    IChart chart = sld.getShapes().addChart(ChartType.ClusteredColumn, 0, 0, 500, 500);

    // ตั้งค่าชื่อเรื่องของแผนภูมิ
    chart.getChartTitle().addTextFrameForOverriding("Sample Title");
    chart.getChartTitle().getTextFrameForOverriding().getTextFrameFormat().setCenterText(NullableBool.True);
    chart.getChartTitle().setHeight(20);
    chart.setTitle(true);

    // ตั้งค่าดัชนีของแผ่นงานข้อมูลแผนภูมิ
    int defaultWorksheetIndex = 0;

    // ดึง WorkSheet ของข้อมูลแผนภูมิ
    IChartDataWorkbook fact = chart.getChartData().getChartDataWorkbook();

    // ลบ Series และ Category ที่สร้างอัตโนมัติเริ่มต้น
    chart.getChartData().getSeries().clear();
    chart.getChartData().getCategories().clear();
    int s = chart.getChartData().getSeries().size();
    s = chart.getChartData().getCategories().size();

    // เพิ่ม Series ใหม่
    chart.getChartData().getSeries().add(fact.getCell(defaultWorksheetIndex, 0, 1, "Series 1"),chart.getType());
    chart.getChartData().getSeries().add(fact.getCell(defaultWorksheetIndex, 0, 2, "Series 2"),chart.getType());

    // เพิ่ม Category ใหม่
    chart.getChartData().getCategories().add(fact.getCell(defaultWorksheetIndex, 1, 0, "Caetegoty 1"));
    chart.getChartData().getCategories().add(fact.getCell(defaultWorksheetIndex, 2, 0, "Caetegoty 2"));
    chart.getChartData().getCategories().add(fact.getCell(defaultWorksheetIndex, 3, 0, "Caetegoty 3"));

    // รับ Series แรกของแผนภูมิ
    IChartSeries series = chart.getChartData().getSeries().get_Item(0);

    // จากนี้เติมข้อมูลให้ Series
    series.getDataPoints().addDataPointForBarSeries(fact.getCell(defaultWorksheetIndex, 1, 1, 20));
    series.getDataPoints().addDataPointForBarSeries(fact.getCell(defaultWorksheetIndex, 2, 1, 50));
    series.getDataPoints().addDataPointForBarSeries(fact.getCell(defaultWorksheetIndex, 3, 1, 30));

    // ตั้งค่าสีเติมสำหรับ Series
    series.getFormat().getFill().setFillType(FillType.Solid);
    series.getFormat().getFill().getSolidFillColor().setColor(Color.RED);

    // รับ Series ที่สองของแผนภูมิ
    series = chart.getChartData().getSeries().get_Item(1);

    // เติมข้อมูลให้ Series
    series.getDataPoints().addDataPointForBarSeries(fact.getCell(defaultWorksheetIndex, 1, 2, 30));
    series.getDataPoints().addDataPointForBarSeries(fact.getCell(defaultWorksheetIndex, 2, 2, 10));
    series.getDataPoints().addDataPointForBarSeries(fact.getCell(defaultWorksheetIndex, 3, 2, 60));

    // ตั้งค่าสีเติมสำหรับ Series
    series.getFormat().getFill().setFillType(FillType.Solid);
    series.getFormat().getFill().getSolidFillColor().setColor(Color.GREEN);

    //Create custom labels for each categories for the new series
    // สร้างป้ายกำกับแบบกำหนดเองสำหรับแต่ละ Category ของ Series ใหม่
    // ตั้งค่าป้ายกำกับแรกให้แสดงชื่อ Category
    IDataLabel lbl = series.getDataPoints().get_Item(0).getLabel();
    lbl.getDataLabelFormat().setShowCategoryName(true);

    lbl = series.getDataPoints().get_Item(1).getLabel();
    lbl.getDataLabelFormat().setShowSeriesName(true);

    // แสดงค่าบนป้ายกำกับที่สาม
    lbl = series.getDataPoints().get_Item(2).getLabel();
    lbl.getDataLabelFormat().setShowValue(true);
    lbl.getDataLabelFormat().setShowSeriesName(true);
    lbl.getDataLabelFormat().setSeparator("/");

    // บันทึกงานนำเสนอพร้อมแผนภูมิ
    pres.save("output.pptx", SaveFormat.Pptx);
} finally {
    if (pres != null) pres.dispose();
}
สร้าง Scatter Charts
Scatter charts (หรือ scatter plots, x‑y graphs) มักใช้เพื่อตรวจสอบรูปแบบหรือแสดงความสัมพันธ์ระหว่างสองตัวแปร
ใช้ scatter chart เมื่อ:
- คุณมีข้อมูลตัวเลขเป็นคู่
- มีสองตัวแปรที่สัมพันธ์กันดี
- ต้องการตรวจสอบว่าตัวแปรสองตัวเกี่ยวข้องกันหรือไม่
- มีตัวแปรอิสระที่มีค่าหลายค่าสำหรับตัวแปรตาม
- ทำตามขั้นตอนใน Create Clustered Column Charts
- ในขั้นตอนที่สาม เพิ่มแผนภูมิพร้อมข้อมูลบางส่วนและกำหนดประเภทแผนภูมิเป็นหนึ่งในต่อไปนี้:
- ChartType.ScatterWithMarkers - Represents a scatter chart.
- ChartType.ScatterWithSmoothLinesAndMarkers - Represents a scatter chart connected by curves, with data markers.
- ChartType.ScatterWithSmoothLines - Represents a scatter chart connected by curves, without data markers.
- ChartType.ScatterWithStraightLinesAndMarkers - Represents a scatter chart connected by lines, with data markers.
- ChartType.ScatterWithStraightLines - Represents a scatter chart connected by lines, without data markers.
โค้ด Java นี้แสดงวิธีสร้าง scatter chart โดยมี marker แตกต่างกันสำหรับแต่ละ Series:
import com.aspose.slides.*;

// สร้างอ็อบเจ็กต์ของคลาส Presentation ที่เป็นตัวแทนของไฟล์ PPTX
Presentation pres = new Presentation();
try {
    // เข้าถึงสไลด์แรก
    ISlide slide = pres.getSlides().get_Item(0);

    // สร้างแผนภูมิเริ่มต้น
    IChart chart = slide.getShapes().addChart(ChartType.ScatterWithSmoothLines, 0, 0, 400, 400);

    // รับดัชนีของ Worksheet ข้อมูลแผนภูมิเริ่มต้น
    int defaultWorksheetIndex = 0;

    // ดึง Worksheet ของข้อมูลแผนภูมิ
    IChartDataWorkbook fact = chart.getChartData().getChartDataWorkbook();

    // ลบ Series ตัวอย่าง
    chart.getChartData().getSeries().clear();

    // เพิ่ม Series ใหม่
    chart.getChartData().getSeries().add(fact.getCell(defaultWorksheetIndex, 1, 1, "Series 1"), chart.getType());
    chart.getChartData().getSeries().add(fact.getCell(defaultWorksheetIndex, 1, 3, "Series 2"), chart.getType());

    // รับ Series แรกของแผนภูมิ
    IChartSeries series = chart.getChartData().getSeries().get_Item(0);

    // เพิ่มจุดใหม่ (1:3) ลงใน Series
    series.getDataPoints().addDataPointForScatterSeries(fact.getCell(defaultWorksheetIndex, 2, 1, 1), fact.getCell(defaultWorksheetIndex, 2, 2, 3));

    // เพิ่มจุดใหม่ (2:10)
    series.getDataPoints().addDataPointForScatterSeries(fact.getCell(defaultWorksheetIndex, 3, 1, 2), fact.getCell(defaultWorksheetIndex, 3, 2, 10));

    // เปลี่ยนประเภทของ Series
    series.setType(ChartType.ScatterWithStraightLinesAndMarkers);

    // เปลี่ยนเครื่องหมายของ Series ในแผนภูมิ
    series.getMarker().setSize(10);
    series.getMarker().setSymbol(MarkerStyleType.Star);

    // รับ Series ที่สองของแผนภูมิ
    series = chart.getChartData().getSeries().get_Item(1);

    // เพิ่มจุดใหม่ (5:2) ที่นั้น
    series.getDataPoints().addDataPointForScatterSeries(fact.getCell(defaultWorksheetIndex, 2, 3, 5), fact.getCell(defaultWorksheetIndex, 2, 4, 2));

    // เพิ่มจุดใหม่ (3:1)
    series.getDataPoints().addDataPointForScatterSeries(fact.getCell(defaultWorksheetIndex, 3, 3, 3), fact.getCell(defaultWorksheetIndex, 3, 4, 1));

    // เพิ่มจุดใหม่ (2:2)
    series.getDataPoints().addDataPointForScatterSeries(fact.getCell(defaultWorksheetIndex, 4, 3, 2), fact.getCell(defaultWorksheetIndex, 4, 4, 2));

    // เพิ่มจุดใหม่ (5:1)
    series.getDataPoints().addDataPointForScatterSeries(fact.getCell(defaultWorksheetIndex, 5, 3, 5), fact.getCell(defaultWorksheetIndex, 5, 4, 1));

    // เปลี่ยนเครื่องหมายของ Series ในแผนภูมิ
    series.getMarker().setSize(10);
    series.getMarker().setSymbol(MarkerStyleType.Circle);

    pres.save("AsposeChart_out.pptx", SaveFormat.Pptx);
} finally {
    if (pres != null) pres.dispose();
}
สร้าง Pie Charts
Pie charts เหมาะที่สุดสำหรับแสดงความสัมพันธ์ส่วนต่อส่วนของข้อมูล โดยเฉพาะเมื่อข้อมูลมีป้ายกำกับประเภทพร้อมค่าตัวเลข อย่างไรก็ตาม หากข้อมูลของคุณมีส่วนหรือป้ายกำกับจำนวนมาก คุณอาจพิจารณาใช้ bar chart แทน
- สร้างอ็อบเจ็กต์ของคลาส Presentation
- รับอ้างอิงสไลด์โดยใช้ดัชนีของมัน
- เพิ่มแผนภูมิด้วยข้อมูลเริ่มต้นและกำหนดประเภท ChartType.Pie
- เข้าถึง workbook ของข้อมูลแผนภูมิ IChartDataWorkbook
- ล้าง Series และ Categories เริ่มต้น
- เพิ่ม Series และ Categories ใหม่
- เพิ่มข้อมูลแผนภูมิใหม่สำหรับ Series
- เพิ่มจุดใหม่ให้แผนภูมิและกำหนดสีกำหนดเองให้กับเซกเมนต์ของ pie chart
- ตั้งค่า label สำหรับ Series
- เปิดใช้ leader lines สำหรับ label ของ Series
- ตั้งค่ามุมการหมุนของเซกเมนต์ pie chart
- บันทึก Presentation ที่แก้ไขเป็นไฟล์ PPTX
โค้ด Java นี้แสดงวิธีสร้าง pie chart:
import com.aspose.slides.*;
import java.awt.Color;

// สร้างอ็อบเจ็กต์ของคลาส Presentation ที่เป็นตัวแทนของไฟล์ PPTX
Presentation pres = new Presentation();
try {
    // เข้าถึงสไลด์แรก
    ISlide slides = pres.getSlides().get_Item(0);

    // เพิ่มแผนภูมิพร้อมข้อมูลค่าเริ่มต้น
    IChart chart = slides.getShapes().addChart(ChartType.Pie, 100, 100, 400, 400);

    // ตั้งค่าชื่อเรื่องของแผนภูมิ
    chart.getChartTitle().addTextFrameForOverriding("Sample Title");
    chart.getChartTitle().getTextFrameForOverriding().getTextFrameFormat().setCenterText(NullableBool.True);
    chart.getChartTitle().setHeight(20);
    chart.setTitle(true);

    // ตั้งค่าดัชนีของแผ่นงานข้อมูลแผนภูมิ
    int defaultWorksheetIndex = 0;

    // ดึง Worksheet ของข้อมูลแผนภูมิ
    IChartDataWorkbook fact = chart.getChartData().getChartDataWorkbook();

    // ลบ Series และ Category ที่สร้างอัตโนมัติเริ่มต้น
    chart.getChartData().getSeries().clear();
    chart.getChartData().getCategories().clear();

    // เพิ่ม Category ใหม่
    chart.getChartData().getCategories().add(fact.getCell(0, 1, 0, "First Qtr"));
    chart.getChartData().getCategories().add(fact.getCell(0, 2, 0, "2nd Qtr"));
    chart.getChartData().getCategories().add(fact.getCell(0, 3, 0, "3rd Qtr"));

    // เพิ่ม Series ใหม่
    IChartSeries series = chart.getChartData().getSeries().add(fact.getCell(0, 0, 1, "Series 1"), chart.getType());

    // เติมข้อมูลให้ Series
    series.getDataPoints().addDataPointForPieSeries(fact.getCell(defaultWorksheetIndex, 1, 1, 20));
    series.getDataPoints().addDataPointForPieSeries(fact.getCell(defaultWorksheetIndex, 2, 1, 50));
    series.getDataPoints().addDataPointForPieSeries(fact.getCell(defaultWorksheetIndex, 3, 1, 30));

    // ไม่ทำงานในเวอร์ชันใหม่
    // Adding new points and setting sector color
    // series.IsColorVaried = true;
    chart.getChartData().getSeriesGroups().get_Item(0).setColorVaried(true);

    IChartDataPoint point = series.getDataPoints().get_Item(0);
    point.getFormat().getFill().setFillType(FillType.Solid);
    point.getFormat().getFill().getSolidFillColor().setColor(Color.CYAN);

    // ตั้งค่าขอบของเซกเมนต์
    point.getFormat().getLine().getFillFormat().setFillType(FillType.Solid);
    point.getFormat().getLine().getFillFormat().getSolidFillColor().setColor(Color.GRAY);
    point.getFormat().getLine().setWidth(3.0);
    point.getFormat().getLine().setStyle(LineStyle.ThinThick);
    point.getFormat().getLine().setDashStyle(LineDashStyle.DashDot);

    IChartDataPoint point1 = series.getDataPoints().get_Item(1);
    point1.getFormat().getFill().setFillType(FillType.Solid);
    point1.getFormat().getFill().getSolidFillColor().setColor(Color.ORANGE);

    // ตั้งค่าขอบของเซกเมนต์
    point1.getFormat().getLine().getFillFormat().setFillType(FillType.Solid);
    point1.getFormat().getLine().getFillFormat().getSolidFillColor().setColor(Color.BLUE);
    point1.getFormat().getLine().setWidth(3.0);
    point1.getFormat().getLine().setStyle(LineStyle.Single);
    point1.getFormat().getLine().setDashStyle(LineDashStyle.LargeDashDot);

    IChartDataPoint point2 = series.getDataPoints().get_Item(2);
    point2.getFormat().getFill().setFillType(FillType.Solid);
    point2.getFormat().getFill().getSolidFillColor().setColor(Color.YELLOW);

    // ตั้งค่าขอบของเซกเมนต์
    point2.getFormat().getLine().getFillFormat().setFillType(FillType.Solid);
    point2.getFormat().getLine().getFillFormat().getSolidFillColor().setColor(Color.RED);
    point2.getFormat().getLine().setWidth(2.0);
    point2.getFormat().getLine().setStyle(LineStyle.ThinThin);
    point2.getFormat().getLine().setDashStyle(LineDashStyle.LargeDashDotDot);

    // สร้างป้ายกำกับแบบกำหนดเองสำหรับแต่ละ Category ของ Series ใหม่
    IDataLabel lbl1 = series.getDataPoints().get_Item(0).getLabel();

    // lbl.ShowCategoryName = true;
    lbl1.getDataLabelFormat().setShowValue(true);

    IDataLabel lbl2 = series.getDataPoints().get_Item(1).getLabel();
    lbl2.getDataLabelFormat().setShowValue(true);
    lbl2.getDataLabelFormat().setShowLegendKey(true);
    lbl2.getDataLabelFormat().setShowPercentage(true);

    IDataLabel lbl3 = series.getDataPoints().get_Item(2).getLabel();
    lbl3.getDataLabelFormat().setShowSeriesName(true);
    lbl3.getDataLabelFormat().setShowPercentage(true);

    // แสดง Leader Lines สำหรับแผนภูมิ
    series.getLabels().getDefaultDataLabelFormat().setShowLeaderLines(true);

    // ตั้งค่ามุมการหมุนสำหรับเซกเมนต์ของ Pie Chart
    chart.getChartData().getSeriesGroups().get_Item(0).setFirstSliceAngle(180);

    // บันทึกงานนำเสนอพร้อมแผนภูมิ
    pres.save("PieChart_out.pptx", SaveFormat.Pptx);
} finally {
    if (pres != null) pres.dispose();
}
สร้าง Line Charts
Line charts (หรือ line graphs) เหมาะสำหรับการแสดงการเปลี่ยนแปลงของค่าเมื่อเวลาเปลี่ยนไป ด้วย line chart คุณสามารถเปรียบเทียบข้อมูลจำนวนมากในคราวเดียว ติดตามการเปลี่ยนแปลงและแนวโน้มตามเวลา เน้นความผิดปกติใน Series ฯลฯ
- สร้างอ็อบเจ็กต์ของคลาส Presentation
- รับอ้างอิงสไลด์โดยใช้ดัชนีของมัน
- เพิ่มแผนภูมิด้วยข้อมูลเริ่มต้นและกำหนดประเภท ChartType.Line
- บันทึก Presentation ที่แก้ไขเป็นไฟล์ PPTX
โค้ด Java นี้แสดงวิธีสร้าง line chart:
import com.aspose.slides.*;

Presentation pres = new Presentation();
try {
    IChart lineChart = pres.getSlides().get_Item(0).getShapes().addChart(ChartType.Line, 10, 50, 600, 350);

    pres.save("lineChart.pptx", SaveFormat.Pptx);
} finally {
    if (pres != null) pres.dispose();
}
โดยปกติ จุดบน line chart จะเชื่อมต่อด้วยเส้นตรงต่อเนื่อง หากต้องการให้จุดเชื่อมต่อด้วยเส้นประ ให้กำหนดประเภท dash ที่ต้องการดังนี้:
import com.aspose.slides.*;

Presentation pres = new Presentation();
try {
    IChart lineChart = pres.getSlides().get_Item(0).getShapes().addChart(ChartType.Line, 10, 50, 600, 350);

    for (IChartSeries series : lineChart.getChartData().getSeries())
    {
        series.getFormat().getLine().setDashStyle(LineDashStyle.Dash);
    }

    pres.save("lineChart.pptx", SaveFormat.Pptx);
} finally {
    if (pres != null) pres.dispose();
}
สร้าง Tree Map Charts
Tree map charts เหมาะสำหรับข้อมูลการขายเมื่อคุณต้องการแสดงขนาดสัมพัทธ์ของหมวดหมู่ข้อมูลและดึงความสนใจไปยังรายการที่เป็นผู้มีส่วนร่วมมากที่สุดในแต่ละหมวด
- สร้างอ็อบเจ็กต์ของคลาส Presentation
- รับอ้างอิงสไลด์โดยใช้ดัชนีของมัน
- เพิ่มแผนภูมิด้วยข้อมูลเริ่มต้นและกำหนดประเภท ChartType.Treemap
- เข้าถึง workbook ของข้อมูลแผนภูมิ IChartDataWorkbook
- ล้าง Series และ Categories เริ่มต้น
- เพิ่ม Series และ Categories ใหม่
- เพิ่มข้อมูลแผนภูมิใหม่สำหรับ Series
- บันทึก Presentation ที่แก้ไขเป็นไฟล์ PPTX
โค้ด Java นี้แสดงวิธีสร้าง tree map chart:
import com.aspose.slides.*;

Presentation pres = new Presentation();
try {
    IChart chart = pres.getSlides().get_Item(0).getShapes().addChart(ChartType.Treemap, 50, 50, 500, 400);
    chart.getChartData().getCategories().clear();
    chart.getChartData().getSeries().clear();

    IChartDataWorkbook wb = chart.getChartData().getChartDataWorkbook();
    wb.clear(0);

    //สาขา 1
    IChartCategory leaf = chart.getChartData().getCategories().add(wb.getCell(0, "C1", "Leaf1"));
    leaf.getGroupingLevels().setGroupingItem(1, "Stem1");
    leaf.getGroupingLevels().setGroupingItem(2, "Branch1");

    chart.getChartData().getCategories().add(wb.getCell(0, "C2", "Leaf2"));

    leaf = chart.getChartData().getCategories().add(wb.getCell(0, "C3", "Leaf3"));
    leaf.getGroupingLevels().setGroupingItem(1, "Stem2");

    chart.getChartData().getCategories().add(wb.getCell(0, "C4", "Leaf4"));

    //สาขา 2
    leaf = chart.getChartData().getCategories().add(wb.getCell(0, "C5", "Leaf5"));
    leaf.getGroupingLevels().setGroupingItem(1, "Stem3");
    leaf.getGroupingLevels().setGroupingItem(2, "Branch2");

    chart.getChartData().getCategories().add(wb.getCell(0, "C6", "Leaf6"));

    leaf = chart.getChartData().getCategories().add(wb.getCell(0, "C7", "Leaf7"));
    leaf.getGroupingLevels().setGroupingItem(1, "Stem4");

    chart.getChartData().getCategories().add(wb.getCell(0, "C8", "Leaf8"));

    IChartSeries series = chart.getChartData().getSeries().add(ChartType.Treemap);
    series.getLabels().getDefaultDataLabelFormat().setShowCategoryName(true);
    series.getDataPoints().addDataPointForTreemapSeries(wb.getCell(0, "D1", 4));
    series.getDataPoints().addDataPointForTreemapSeries(wb.getCell(0, "D2", 5));
    series.getDataPoints().addDataPointForTreemapSeries(wb.getCell(0, "D3", 3));
    series.getDataPoints().addDataPointForTreemapSeries(wb.getCell(0, "D4", 6));
    series.getDataPoints().addDataPointForTreemapSeries(wb.getCell(0, "D5", 9));
    series.getDataPoints().addDataPointForTreemapSeries(wb.getCell(0, "D6", 9));
    series.getDataPoints().addDataPointForTreemapSeries(wb.getCell(0, "D7", 4));
    series.getDataPoints().addDataPointForTreemapSeries(wb.getCell(0, "D8", 3));

    series.setParentLabelLayout(ParentLabelLayoutType.Overlapping);

    pres.save("Treemap.pptx", SaveFormat.Pptx);
} finally {
    if (pres != null) pres.dispose();
}
สร้าง Stock Charts
- สร้างอ็อบเจ็กต์ของคลาส Presentation
- รับอ้างอิงสไลด์โดยใช้ดัชนีของมัน
- เพิ่มแผนภูมิด้วยข้อมูลเริ่มต้นและกำหนดประเภท ChartType.OpenHighLowClose
- เข้าถึง workbook ของข้อมูลแผนภูมิ IChartDataWorkbook
- ล้าง Series และ Categories เริ่มต้น
- เพิ่ม Series และ Categories ใหม่
- เพิ่มข้อมูลแผนภูมิใหม่สำหรับ Series
- กำหนดรูปแบบของเส้น high‑low
- บันทึก Presentation ที่แก้ไขเป็นไฟล์ PPTX
โค้ด Java นี้แสดงวิธีสร้าง stock chart:
import com.aspose.slides.*;

Presentation pres = new Presentation();
try {
    IChart chart = pres.getSlides().get_Item(0).getShapes().addChart(ChartType.OpenHighLowClose, 50, 50, 600, 400, false);

    chart.getChartData().getSeries().clear();
    chart.getChartData().getCategories().clear();

    IChartDataWorkbook wb = chart.getChartData().getChartDataWorkbook();

    chart.getChartData().getCategories().add(wb.getCell(0, 1, 0, "A"));
    chart.getChartData().getCategories().add(wb.getCell(0, 2, 0, "B"));
    chart.getChartData().getCategories().add(wb.getCell(0, 3, 0, "C"));

    chart.getChartData().getSeries().add(wb.getCell(0, 0, 1, "Open"), chart.getType());
    chart.getChartData().getSeries().add(wb.getCell(0, 0, 2, "High"), chart.getType());
    chart.getChartData().getSeries().add(wb.getCell(0, 0, 3, "Low"), chart.getType());
    chart.getChartData().getSeries().add(wb.getCell(0, 0, 4, "Close"), chart.getType());

    IChartSeries series = chart.getChartData().getSeries().get_Item(0);

    series.getDataPoints().addDataPointForStockSeries(wb.getCell(0, 1, 1, 72));
    series.getDataPoints().addDataPointForStockSeries(wb.getCell(0, 2, 1, 25));
    series.getDataPoints().addDataPointForStockSeries(wb.getCell(0, 3, 1, 38));

    series = chart.getChartData().getSeries().get_Item(1);
    series.getDataPoints().addDataPointForStockSeries(wb.getCell(0, 1, 2, 172));
    series.getDataPoints().addDataPointForStockSeries(wb.getCell(0, 2, 2, 57));
    series.getDataPoints().addDataPointForStockSeries(wb.getCell(0, 3, 2, 57));

    series = chart.getChartData().getSeries().get_Item(2);
    series.getDataPoints().addDataPointForStockSeries(wb.getCell(0, 1, 3, 12));
    series.getDataPoints().addDataPointForStockSeries(wb.getCell(0, 2, 3, 12));
    series.getDataPoints().addDataPointForStockSeries(wb.getCell(0, 3, 3, 13));

    series = chart.getChartData().getSeries().get_Item(3);
    series.getDataPoints().addDataPointForStockSeries(wb.getCell(0, 1, 4, 25));
    series.getDataPoints().addDataPointForStockSeries(wb.getCell(0, 2, 4, 38));
    series.getDataPoints().addDataPointForStockSeries(wb.getCell(0, 3, 4, 50));

    chart.getChartData().getSeriesGroups().get_Item(0).getUpDownBars().setUpDownBars(true);
    chart.getChartData().getSeriesGroups().get_Item(0).getHiLowLinesFormat().getLine().getFillFormat().setFillType(FillType.Solid);

    for (IChartSeries ser : chart.getChartData().getSeries())
    {
        ser.getFormat().getLine().getFillFormat().setFillType(FillType.NoFill);
    }

    pres.save("output.pptx", SaveFormat.Pptx);
} finally {
    if (pres != null) pres.dispose();
}
สร้าง Box and Whisker Charts
- สร้างอ็อบเจ็กต์ของคลาส Presentation
- รับอ้างอิงสไลด์โดยใช้ดัชนีของมัน
- เพิ่มแผนภูมิด้วยข้อมูลเริ่มต้นและกำหนดประเภท ChartType.BoxAndWhisker
- เข้าถึง workbook ของข้อมูลแผนภูมิ IChartDataWorkbook
- ล้าง Series และ Categories เริ่มต้น
- เพิ่ม Series และ Categories ใหม่
- เพิ่มข้อมูลแผนภูมิใหม่สำหรับ Series
- บันทึก Presentation ที่แก้ไขเป็นไฟล์ PPTX
โค้ด Java นี้แสดงวิธีสร้าง box and whisker chart:
import com.aspose.slides.*;

Presentation pres = new Presentation();
try {
    IChart chart = pres.getSlides().get_Item(0).getShapes().addChart(ChartType.BoxAndWhisker, 50, 50, 500, 400);
    chart.getChartData().getCategories().clear();
    chart.getChartData().getSeries().clear();

    IChartDataWorkbook wb = chart.getChartData().getChartDataWorkbook();
    wb.clear(0);

    chart.getChartData().getCategories().add(wb.getCell(0, "A1", "Category 1"));
    chart.getChartData().getCategories().add(wb.getCell(0, "A2", "Category 1"));
    chart.getChartData().getCategories().add(wb.getCell(0, "A3", "Category 1"));
    chart.getChartData().getCategories().add(wb.getCell(0, "A4", "Category 1"));
    chart.getChartData().getCategories().add(wb.getCell(0, "A5", "Category 1"));
    chart.getChartData().getCategories().add(wb.getCell(0, "A6", "Category 1"));

    IChartSeries series = chart.getChartData().getSeries().add(ChartType.BoxAndWhisker);

    series.setQuartileMethod(QuartileMethodType.Exclusive);
    series.setShowMeanLine(true);
    series.setShowMeanMarkers(true);
    series.setShowInnerPoints(true);
    series.setShowOutlierPoints(true);

    series.getDataPoints().addDataPointForBoxAndWhiskerSeries(wb.getCell(0, "B1", 15));
    series.getDataPoints().addDataPointForBoxAndWhiskerSeries(wb.getCell(0, "B2", 41));
    series.getDataPoints().addDataPointForBoxAndWhiskerSeries(wb.getCell(0, "B3", 16));
    series.getDataPoints().addDataPointForBoxAndWhiskerSeries(wb.getCell(0, "B4", 10));
    series.getDataPoints().addDataPointForBoxAndWhiskerSeries(wb.getCell(0, "B5", 23));
    series.getDataPoints().addDataPointForBoxAndWhiskerSeries(wb.getCell(0, "B6", 16));

    pres.save("BoxAndWhisker.pptx", SaveFormat.Pptx);
} finally {
    if (pres != null) pres.dispose();
}
สร้าง Funnel Charts
- สร้างอ็อบเจ็กต์ของคลาส Presentation
- รับอ้างอิงสไลด์โดยใช้ดัชนีของมัน
- เพิ่มแผนภูมิด้วยข้อมูลเริ่มต้นและกำหนดประเภท ChartType.Funnel
- บันทึก Presentation ที่แก้ไขเป็นไฟล์ PPTX
โค้ด Java นี้แสดงวิธีสร้าง funnel chart:
import com.aspose.slides.*;

Presentation pres = new Presentation();
try {
    IChart chart = pres.getSlides().get_Item(0).getShapes().addChart(ChartType.Funnel, 50, 50, 500, 400);
    chart.getChartData().getCategories().clear();
    chart.getChartData().getSeries().clear();

    IChartDataWorkbook wb = chart.getChartData().getChartDataWorkbook();

    wb.clear(0);

    chart.getChartData().getCategories().add(wb.getCell(0, "A1", "Category 1"));
    chart.getChartData().getCategories().add(wb.getCell(0, "A2", "Category 2"));
    chart.getChartData().getCategories().add(wb.getCell(0, "A3", "Category 3"));
    chart.getChartData().getCategories().add(wb.getCell(0, "A4", "Category 4"));
    chart.getChartData().getCategories().add(wb.getCell(0, "A5", "Category 5"));
    chart.getChartData().getCategories().add(wb.getCell(0, "A6", "Category 6"));

    IChartSeries series = chart.getChartData().getSeries().add(ChartType.Funnel);

    series.getDataPoints().addDataPointForFunnelSeries(wb.getCell(0, "B1", 50));
    series.getDataPoints().addDataPointForFunnelSeries(wb.getCell(0, "B2", 100));
    series.getDataPoints().addDataPointForFunnelSeries(wb.getCell(0, "B3", 200));
    series.getDataPoints().addDataPointForFunnelSeries(wb.getCell(0, "B4", 300));
    series.getDataPoints().addDataPointForFunnelSeries(wb.getCell(0, "B5", 400));
    series.getDataPoints().addDataPointForFunnelSeries(wb.getCell(0, "B6", 500));

    pres.save("Funnel.pptx", SaveFormat.Pptx);
} finally {
    if (pres != null) pres.dispose();
}
สร้าง Sunburst Charts
- สร้างอ็อบเจ็กต์ของคลาส Presentation
- รับอ้างอิงสไลด์โดยใช้ดัชนีของมัน
- เพิ่มแผนภูมิด้วยข้อมูลเริ่มต้นและกำหนดประเภท ChartType.Sunburst
- บันทึก Presentation ที่แก้ไขเป็นไฟล์ PPTX
โค้ด Java นี้แสดงวิธีสร้าง sunburst chart:
import com.aspose.slides.*;

Presentation pres = new Presentation();
try {
    IChart chart = pres.getSlides().get_Item(0).getShapes().addChart(ChartType.Sunburst, 50, 50, 500, 400);
    chart.getChartData().getCategories().clear();
    chart.getChartData().getSeries().clear();

    IChartDataWorkbook wb = chart.getChartData().getChartDataWorkbook();
    wb.clear(0);

    //สาขา 1
    IChartCategory leaf = chart.getChartData().getCategories().add(wb.getCell(0, "C1", "Leaf1"));
    leaf.getGroupingLevels().setGroupingItem(1, "Stem1");
    leaf.getGroupingLevels().setGroupingItem(2, "Branch1");

    chart.getChartData().getCategories().add(wb.getCell(0, "C2", "Leaf2"));

    leaf = chart.getChartData().getCategories().add(wb.getCell(0, "C3", "Leaf3"));
    leaf.getGroupingLevels().setGroupingItem(1, "Stem2");

    chart.getChartData().getCategories().add(wb.getCell(0, "C4", "Leaf4"));

    //สาขา 2
    leaf = chart.getChartData().getCategories().add(wb.getCell(0, "C5", "Leaf5"));
    leaf.getGroupingLevels().setGroupingItem(1, "Stem3");
    leaf.getGroupingLevels().setGroupingItem(2, "Branch2");

    chart.getChartData().getCategories().add(wb.getCell(0, "C6", "Leaf6"));

    leaf = chart.getChartData().getCategories().add(wb.getCell(0, "C7", "Leaf7"));
    leaf.getGroupingLevels().setGroupingItem(1, "Stem4");

    chart.getChartData().getCategories().add(wb.getCell(0, "C8", "Leaf8"));

    IChartSeries series = chart.getChartData().getSeries().add(ChartType.Sunburst);
    series.getLabels().getDefaultDataLabelFormat().setShowCategoryName(true);
    series.getDataPoints().addDataPointForSunburstSeries(wb.getCell(0, "D1", 4));
    series.getDataPoints().addDataPointForSunburstSeries(wb.getCell(0, "D2", 5));
    series.getDataPoints().addDataPointForSunburstSeries(wb.getCell(0, "D3", 3));
    series.getDataPoints().addDataPointForSunburstSeries(wb.getCell(0, "D4", 6));
    series.getDataPoints().addDataPointForSunburstSeries(wb.getCell(0, "D5", 9));
    series.getDataPoints().addDataPointForSunburstSeries(wb.getCell(0, "D6", 9));
    series.getDataPoints().addDataPointForSunburstSeries(wb.getCell(0, "D7", 4));
    series.getDataPoints().addDataPointForSunburstSeries(wb.getCell(0, "D8", 3));

    pres.save("Sunburst.pptx", SaveFormat.Pptx);
} finally {
    if (pres != null) pres.dispose();
}
สร้าง Histogram Charts
- สร้างอ็อบเจ็กต์ของคลาส Presentation
- รับอ้างอิงสไลด์โดยใช้ดัชนีของมัน
- เพิ่มแผนภูมิด้วยข้อมูลเริ่มต้นและกำหนดประเภท ChartType.Histogram
- เข้าถึง workbook ของข้อมูลแผนภูมิ IChartDataWorkbook
- ล้าง Series และ Categories เริ่มต้น
- เพิ่ม Series และ Categories ใหม่
- บันทึก Presentation ที่แก้ไขเป็นไฟล์ PPTX
โค้ด Java นี้แสดงวิธีสร้าง histogram chart:
import com.aspose.slides.*;

Presentation pres = new Presentation();
try {
    IChart chart = pres.getSlides().get_Item(0).getShapes().addChart(ChartType.Histogram, 50, 50, 500, 400);
    chart.getChartData().getCategories().clear();
    chart.getChartData().getSeries().clear();

    IChartDataWorkbook wb = chart.getChartData().getChartDataWorkbook();
    wb.clear(0);

    IChartSeries series = chart.getChartData().getSeries().add(ChartType.Histogram);
    series.getDataPoints().addDataPointForHistogramSeries(wb.getCell(0, "A1", 15));
    series.getDataPoints().addDataPointForHistogramSeries(wb.getCell(0, "A2", -41));
    series.getDataPoints().addDataPointForHistogramSeries(wb.getCell(0, "A3", 16));
    series.getDataPoints().addDataPointForHistogramSeries(wb.getCell(0, "A4", 10));
    series.getDataPoints().addDataPointForHistogramSeries(wb.getCell(0, "A5", -23));
    series.getDataPoints().addDataPointForHistogramSeries(wb.getCell(0, "A6", 16));

    chart.getAxes().getHorizontalAxis().setAggregationType(AxisAggregationType.Automatic);

    pres.save("Histogram.pptx", SaveFormat.Pptx);
} finally {
    if (pres != null) pres.dispose();
}
สร้าง Radar Charts
- สร้างอ็อบเจ็กต์ของคลาส Presentation
- รับอ้างอิงสไลด์โดยใช้ดัชนีของมัน
- เพิ่มแผนภูมิด้วยข้อมูลบางส่วนและกำหนดประเภทแผนภูมิที่ต้องการ (ChartType.Radar)
- บันทึก Presentation ที่แก้ไขเป็นไฟล์ PPTX
โค้ด Java นี้แสดงวิธีสร้าง radar chart:
import com.aspose.slides.*;

Presentation pres = new Presentation();
try {
    pres.getSlides().get_Item(0).getShapes().addChart(ChartType.Radar, 20, 20, 400, 300);
    pres.save("Radar-chart.pptx", SaveFormat.Pptx);
} finally {
    if (pres != null) pres.dispose();
}
สร้าง Multi-Category Charts
- สร้างอ็อบเจ็กต์ของคลาส Presentation
- รับอ้างอิงสไลด์โดยใช้ดัชนีของมัน
- เพิ่มแผนภูมิด้วยข้อมูลเริ่มต้นและกำหนดประเภท ChartType.ClusteredColumn
- เข้าถึง workbook ของข้อมูลแผนภูมิ IChartDataWorkbook
- ล้าง Series และ Categories เริ่มต้น
- เพิ่ม Series และ Categories ใหม่
- เพิ่มข้อมูลแผนภูมิใหม่สำหรับ Series
- บันทึก Presentation ที่แก้ไขเป็นไฟล์ PPTX
โค้ด Java นี้แสดงวิธีสร้าง multicategory chart:
import com.aspose.slides.*;

Presentation pres = new Presentation();
try {
    IChart ch = pres.getSlides().get_Item(0).getShapes().addChart(ChartType.ClusteredColumn, 100, 100, 600, 450);
    ch.getChartData().getSeries().clear();
    ch.getChartData().getCategories().clear();

    IChartDataWorkbook fact = ch.getChartData().getChartDataWorkbook();
    fact.clear(0);
    int defaultWorksheetIndex = 0;

    IChartCategory category = ch.getChartData().getCategories().add(fact.getCell(0, "c2", "A"));
    category.getGroupingLevels().setGroupingItem(1, "Group1");
    category = ch.getChartData().getCategories().add(fact.getCell(0, "c3", "B"));

    category = ch.getChartData().getCategories().add(fact.getCell(0, "c4", "C"));
    category.getGroupingLevels().setGroupingItem(1, "Group2");
    category = ch.getChartData().getCategories().add(fact.getCell(0, "c5", "D"));

    category = ch.getChartData().getCategories().add(fact.getCell(0, "c6", "E"));
    category.getGroupingLevels().setGroupingItem(1, "Group3");
    category = ch.getChartData().getCategories().add(fact.getCell(0, "c7", "F"));

    category = ch.getChartData().getCategories().add(fact.getCell(0, "c8", "G"));
    category.getGroupingLevels().setGroupingItem(1, "Group4");
    category = ch.getChartData().getCategories().add(fact.getCell(0, "c9", "H"));

    // เพิ่ม Series
    IChartSeries series = ch.getChartData().getSeries().add(fact.getCell(0, "D1", "Series 1"),
            ChartType.ClusteredColumn);

    series.getDataPoints().addDataPointForBarSeries(fact.getCell(defaultWorksheetIndex, "D2", 10));
    series.getDataPoints().addDataPointForBarSeries(fact.getCell(defaultWorksheetIndex, "D3", 20));
    series.getDataPoints().addDataPointForBarSeries(fact.getCell(defaultWorksheetIndex, "D4", 30));
    series.getDataPoints().addDataPointForBarSeries(fact.getCell(defaultWorksheetIndex, "D5", 40));
    series.getDataPoints().addDataPointForBarSeries(fact.getCell(defaultWorksheetIndex, "D6", 50));
    series.getDataPoints().addDataPointForBarSeries(fact.getCell(defaultWorksheetIndex, "D7", 60));
    series.getDataPoints().addDataPointForBarSeries(fact.getCell(defaultWorksheetIndex, "D8", 70));
    series.getDataPoints().addDataPointForBarSeries(fact.getCell(defaultWorksheetIndex, "D9", 80));

    // บันทึกงานนำเสนอพร้อมแผนภูมิ
    pres.save("AsposeChart_out.pptx", SaveFormat.Pptx);
} finally {
    if (pres != null) pres.dispose();
}
สร้าง Map Charts
Map charts แสดงข้อมูลเชิงภูมิศาสตร์และช่วยเปรียบเทียบค่าในแต่ละภูมิภาค
โค้ด Java นี้แสดงวิธีสร้าง map chart:
import com.aspose.slides.*;

Presentation pres = new Presentation();
try {
    IChart chart = pres.getSlides().get_Item(0).getShapes().addChart(ChartType.Map, 50, 50, 500, 400);
    pres.save("mapChart.pptx", SaveFormat.Pptx);
} finally {
    if (pres != null) pres.dispose();
}
สร้าง Combination Charts
Combination chart (หรือ combo chart) รวมสองประเภทแผนภูมิหรือมากกว่าลงในกราฟเดียว ช่วยให้คุณเน้น, เปรียบเทียบ หรือวิเคราะห์ความแตกต่างระหว่างชุดข้อมูลหลายชุด
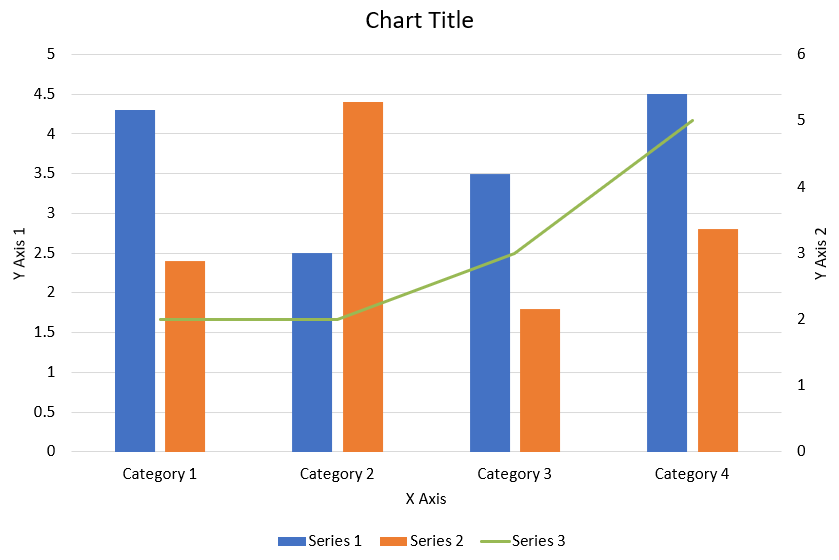
โค้ด Java ต่อไปนี้แสดงวิธีสร้าง combination chart ตามที่แสดงด้านบนใน PowerPoint:
import com.aspose.slides.*;
import java.awt.Color;

static void createComboChart() {
    Presentation presentation = new Presentation();
    ISlide slide = presentation.getSlides().get_Item(0);
    try {
        IChart chart = createChartWithFirstSeries(slide);

        addSecondSeriesToChart(chart);
        addThirdSeriesToChart(chart);

        setPrimaryAxesFormat(chart);
        setSecondaryAxesFormat(chart);

        presentation.save("combo-chart.pptx", SaveFormat.Pptx);
    } finally {
        presentation.dispose();
    }
}

static IChart createChartWithFirstSeries(ISlide slide) {
    IChart chart = slide.getShapes().addChart(ChartType.ClusteredColumn, 50, 50, 600, 400);

    // ตั้งค่าชื่อเรื่องของแผนภูมิ
    chart.setTitle(true);
    chart.getChartTitle().addTextFrameForOverriding("Chart Title");
    chart.getChartTitle().setOverlay(false);
    IParagraph titleParagraph = chart.getChartTitle().getTextFrameForOverriding().getParagraphs().get_Item(0);
    IPortionFormat titleFormat = titleParagraph.getParagraphFormat().getDefaultPortionFormat();
    titleFormat.setFontBold(NullableBool.False);
    titleFormat.setFontHeight(18f);

    // ตั้งค่าตัวบ่งชี้ของแผนภูมิ
    chart.getLegend().setPosition(LegendPositionType.Bottom);
    chart.getLegend().getTextFormat().getPortionFormat().setFontHeight(12f);

    // ลบ Series และ Category ที่สร้างโดยอัตโนมัติเริ่มต้น
    chart.getChartData().getSeries().clear();
    chart.getChartData().getCategories().clear();

    int worksheetIndex = 0;
    IChartDataWorkbook workbook = chart.getChartData().getChartDataWorkbook();

    // เพิ่ม Category ใหม่
    chart.getChartData().getCategories().add(workbook.getCell(worksheetIndex, 1, 0, "Category 1"));
    chart.getChartData().getCategories().add(workbook.getCell(worksheetIndex, 2, 0, "Category 2"));
    chart.getChartData().getCategories().add(workbook.getCell(worksheetIndex, 3, 0, "Category 3"));
    chart.getChartData().getCategories().add(workbook.getCell(worksheetIndex, 4, 0, "Category 4"));

    // เพิ่ม Series แรก
    IChartDataCell seriesNameCell = workbook.getCell(worksheetIndex, 0, 1, "Series 1");
    IChartSeries series = chart.getChartData().getSeries().add(seriesNameCell, chart.getType());

    series.getParentSeriesGroup().setOverlap((byte)-25);
    series.getParentSeriesGroup().setGapWidth(220);

    series.getDataPoints().addDataPointForBarSeries(workbook.getCell(worksheetIndex, 1, 1, 4.3));
    series.getDataPoints().addDataPointForBarSeries(workbook.getCell(worksheetIndex, 2, 1, 2.5));
    series.getDataPoints().addDataPointForBarSeries(workbook.getCell(worksheetIndex, 3, 1, 3.5));
    series.getDataPoints().addDataPointForBarSeries(workbook.getCell(worksheetIndex, 4, 1, 4.5));

    return chart;
}

static void addSecondSeriesToChart(IChart chart) {
    IChartDataWorkbook workbook = chart.getChartData().getChartDataWorkbook();
    final int worksheetIndex = 0;

    IChartDataCell seriesNameCell = workbook.getCell(worksheetIndex, 0, 2, "Series 2");
    IChartSeries series = chart.getChartData().getSeries().add(seriesNameCell, ChartType.ClusteredColumn);

    series.getParentSeriesGroup().setOverlap((byte)-25);
    series.getParentSeriesGroup().setGapWidth(220);

    series.getDataPoints().addDataPointForBarSeries(workbook.getCell(worksheetIndex, 1, 2, 2.4));
    series.getDataPoints().addDataPointForBarSeries(workbook.getCell(worksheetIndex, 2, 2, 4.4));
    series.getDataPoints().addDataPointForBarSeries(workbook.getCell(worksheetIndex, 3, 2, 1.8));
    series.getDataPoints().addDataPointForBarSeries(workbook.getCell(worksheetIndex, 4, 2, 2.8));
}

static void addThirdSeriesToChart(IChart chart) {
    IChartDataWorkbook workbook = chart.getChartData().getChartDataWorkbook();
    final int worksheetIndex = 0;

    IChartDataCell seriesNameCell = workbook.getCell(worksheetIndex, 0, 3, "Series 3");
    IChartSeries series = chart.getChartData().getSeries().add(seriesNameCell, ChartType.Line);

    series.getDataPoints().addDataPointForLineSeries(workbook.getCell(worksheetIndex, 1, 3, 2.0));
    series.getDataPoints().addDataPointForLineSeries(workbook.getCell(worksheetIndex, 2, 3, 2.0));
    series.getDataPoints().addDataPointForLineSeries(workbook.getCell(worksheetIndex, 3, 3, 3.0));
    series.getDataPoints().addDataPointForLineSeries(workbook.getCell(worksheetIndex, 4, 3, 5.0));

    series.setPlotOnSecondAxis(true);
}

static void setPrimaryAxesFormat(IChart chart) {
    // ตั้งค่าแกนแนวนอน
    IAxis horizontalAxis = chart.getAxes().getHorizontalAxis();
    horizontalAxis.getTextFormat().getPortionFormat().setFontHeight(12f);
    horizontalAxis.getFormat().getLine().getFillFormat().setFillType(FillType.NoFill);

    setAxisTitle(horizontalAxis, "X Axis");

    // ตั้งค่าแกนแนวตั้ง
    IAxis verticalAxis = chart.getAxes().getVerticalAxis();
    verticalAxis.getTextFormat().getPortionFormat().setFontHeight(12f);
    verticalAxis.getFormat().getLine().getFillFormat().setFillType(FillType.NoFill);

    setAxisTitle(verticalAxis, "Y Axis 1");

    // ตั้งค่าสีของเส้นกริดหลักแนวตั้ง
    ILineFillFormat majorGridLinesFormat = verticalAxis.getMajorGridLinesFormat().getLine().getFillFormat();
    majorGridLinesFormat.setFillType(FillType.Solid);
    majorGridLinesFormat.getSolidFillColor().setColor(new Color(217, 217, 217));
}

static void setSecondaryAxesFormat(IChart chart) {
    // ตั้งค่าแกนแนวนอนรอง
    IAxis secondaryHorizontalAxis = chart.getAxes().getSecondaryHorizontalAxis();
    secondaryHorizontalAxis.setPosition(AxisPositionType.Bottom);
    secondaryHorizontalAxis.setCrossType(CrossesType.Maximum);
    secondaryHorizontalAxis.setVisible(false);
    secondaryHorizontalAxis.getMajorGridLinesFormat().getLine().getFillFormat().setFillType(FillType.NoFill);
    secondaryHorizontalAxis.getMinorGridLinesFormat().getLine().getFillFormat().setFillType(FillType.NoFill);

    // ตั้งค่าแกนแนวตั้งรอง
    IAxis secondaryVerticalAxis = chart.getAxes().getSecondaryVerticalAxis();
    secondaryVerticalAxis.setPosition(AxisPositionType.Right);
    secondaryVerticalAxis.getTextFormat().getPortionFormat().setFontHeight(12f);
    secondaryVerticalAxis.getFormat().getLine().getFillFormat().setFillType(FillType.NoFill);
    secondaryVerticalAxis.getMajorGridLinesFormat().getLine().getFillFormat().setFillType(FillType.NoFill);
    secondaryVerticalAxis.getMinorGridLinesFormat().getLine().getFillFormat().setFillType(FillType.NoFill);

    setAxisTitle(secondaryVerticalAxis, "Y Axis 2");
}

static void setAxisTitle(IAxis axis, String axisTitle) {
    axis.setTitle(true);
    axis.getTitle().setOverlay(false);
    IParagraph titleParagraph = axis.getTitle().addTextFrameForOverriding(axisTitle).getParagraphs().get_Item(0);
    IPortionFormat titleFormat = titleParagraph.getParagraphFormat().getDefaultPortionFormat();
    titleFormat.setFontBold(NullableBool.False);
    titleFormat.setFontHeight(12f);
}
อัปเดตแผนภูมิ
- สร้างอ็อบเจ็กต์ของคลาส Presentation ที่เป็นตัวแทนของงานนำเสนอที่มีแผนภูมิที่ต้องการอัปเดต
- รับอ้างอิงสไลด์โดยใช้ดัชนีของมัน
- เดินทางผ่านรูปทรงทั้งหมดเพื่อหาตำแหน่งแผนภูมิที่ต้องการ
- เข้าถึง worksheet ของข้อมูลแผนภูมิ
- แก้ไข Series ของแผนภูมิโดยเปลี่ยนค่าของ Series
- เพิ่ม Series ใหม่และเติมข้อมูลให้เต็ม
- บันทึก Presentation ที่แก้ไขเป็นไฟล์ PPTX
โค้ด Java นี้แสดงวิธีอัปเดตแผนภูมิ:
import com.aspose.slides.*;

// เปิดไฟล์งานนำเสนอที่มีแผนภูมิเพื่ออัปเดต
Presentation pres = new Presentation("ExistingChart.pptx");
try {
    // เข้าถึงสไลด์แรก
    ISlide sld = pres.getSlides().get_Item(0);

    // ดึงแผนภูมิจากสไลด์
    IChart chart = (IChart)sld.getShapes().get_Item(0);

    // ตั้งค่าดัชนีของชีตข้อมูลแผนภูมิ
    int defaultWorksheetIndex = 0;

    // ดึง Worksheet ของข้อมูลแผนภูมิ
    IChartDataWorkbook fact = chart.getChartData().getChartDataWorkbook();

    // เปลี่ยนชื่อ Category ของแผนภูมิ
    fact.getCell(defaultWorksheetIndex, 1, 0, "Modified Category 1");
    fact.getCell(defaultWorksheetIndex, 2, 0, "Modified Category 2");

    // รับ Series แรกของแผนภูมิ
    IChartSeries series = chart.getChartData().getSeries().get_Item(0);

    // อัปเดตข้อมูล Series ตอนนี้
    fact.getCell(defaultWorksheetIndex, 0, 1, "New_Series1");// แก้ไขชื่อ Series
    series.getDataPoints().get_Item(0).getValue().setData(90);
    series.getDataPoints().get_Item(1).getValue().setData(123);
    series.getDataPoints().get_Item(2).getValue().setData(44);

    // รับ Series ที่สองของแผนภูมิ
    series = chart.getChartData().getSeries().get_Item(1);

    // อัปเดตข้อมูล Series ตอนนี้
    fact.getCell(defaultWorksheetIndex, 0, 2, "New_Series2");// แก้ไขชื่อ Series
    series.getDataPoints().get_Item(0).getValue().setData(23);
    series.getDataPoints().get_Item(1).getValue().setData(67);
    series.getDataPoints().get_Item(2).getValue().setData(99);

    // กำลังเพิ่ม Series ใหม่
    chart.getChartData().getSeries().add(fact.getCell(defaultWorksheetIndex, 0, 3, "Series 3"), chart.getType());

    // รับ Series ที่ 3 ของแผนภูมิ
    series = chart.getChartData().getSeries().get_Item(2);

    // กำลังเติมข้อมูลให้ Series
    series.getDataPoints().addDataPointForBarSeries(fact.getCell(defaultWorksheetIndex, 1, 3, 20));
    series.getDataPoints().addDataPointForBarSeries(fact.getCell(defaultWorksheetIndex, 2, 3, 50));
    series.getDataPoints().addDataPointForBarSeries(fact.getCell(defaultWorksheetIndex, 3, 3, 30));

    chart.setType(ChartType.ClusteredCylinder);

    // บันทึกงานนำเสนอพร้อมแผนภูมิ
    pres.save("AsposeChartModified_out.pptx", SaveFormat.Pptx);
} finally {
    if (pres != null) pres.dispose();
}
กำหนดช่วงข้อมูลสำหรับแผนภูมิ
เพื่อกำหนดช่วงข้อมูลสำหรับแผนภูมิ ทำตามขั้นตอนต่อไปนี้:
- สร้างอ็อบเจ็กต์ของคลาส Presentation ที่เป็นตัวแทนของงานนำเสนอที่มีแผนภูมิ
- รับอ้างอิงสไลด์โดยใช้ดัชนีของมัน
- เดินทางผ่านรูปทรงทั้งหมดเพื่อหาตำแหน่งแผนภูมิที่ต้องการ
- เข้าถึงข้อมูลแผนภูมิและกำหนดช่วง
- บันทึก Presentation ที่แก้ไขเป็นไฟล์ PPTX
โค้ด Java นี้แสดงวิธีกำหนดช่วงข้อมูลสำหรับแผนภูมิ:
import com.aspose.slides.*;

// เปิดงานนำเสนอที่มีแผนภูมิ
Presentation pres = new Presentation("ExistingChart.pptx");
try {
    ISlide slide = pres.getSlides().get_Item(0);
    IChart chart = (IChart)slide.getShapes().get_Item(0);

    chart.getChartData().setRange("Sheet1!A1:B4");

    pres.save("SetDataRange_out.pptx", SaveFormat.Pptx);
} finally {
    if (pres != null) pres.dispose();
}
ใช้ Marker เริ่มต้นในแผนภูมิ
เมื่อใช้ marker เริ่มต้นในแผนภูมิแต่ละ Series จะได้รับสัญลักษณ์ marker ที่แตกต่างโดยอัตโนมัติ
โค้ด Java นี้แสดงวิธีตั้งค่า marker สำหรับ Series โดยอัตโนมัติ:
import com.aspose.slides.*;

Presentation pres = new Presentation();
try {
    ISlide slide = pres.getSlides().get_Item(0);
    IChart chart = slide.getShapes().addChart(ChartType.LineWithMarkers, 10, 10, 400, 400);

    chart.getChartData().getSeries().clear();
    chart.getChartData().getCategories().clear();

    IChartDataWorkbook fact = chart.getChartData().getChartDataWorkbook();
    chart.getChartData().getSeries().add(fact.getCell(0, 0, 1, "Series 1"), chart.getType());
    IChartSeries series = chart.getChartData().getSeries().get_Item(0);

    chart.getChartData().getCategories().add(fact.getCell(0, 1, 0, "C1"));
    series.getDataPoints().addDataPointForLineSeries(fact.getCell(0, 1, 1, 24));
    chart.getChartData().getCategories().add(fact.getCell(0, 2, 0, "C2"));
    series.getDataPoints().addDataPointForLineSeries(fact.getCell(0, 2, 1, 23));
    chart.getChartData().getCategories().add(fact.getCell(0, 3, 0, "C3"));
    series.getDataPoints().addDataPointForLineSeries(fact.getCell(0, 3, 1, -10));
    chart.getChartData().getCategories().add(fact.getCell(0, 4, 0, "C4"));
    series.getDataPoints().addDataPointForLineSeries(fact.getCell(0, 4, 1, null));

    chart.getChartData().getSeries().add(fact.getCell(0, 0, 2, "Series 2"), chart.getType());
    //รับ Series ที่สองของแผนภูมิ
    IChartSeries series2 = chart.getChartData().getSeries().get_Item(1);

    //กำลังเติมข้อมูลให้ Series
    series2.getDataPoints().addDataPointForLineSeries(fact.getCell(0, 1, 2, 30));
    series2.getDataPoints().addDataPointForLineSeries(fact.getCell(0, 2, 2, 10));
    series2.getDataPoints().addDataPointForLineSeries(fact.getCell(0, 3, 2, 60));
    series2.getDataPoints().addDataPointForLineSeries(fact.getCell(0, 4, 2, 40));

    chart.setLegend(true);
    chart.getLegend().setOverlay(false);

    pres.save("DefaultMarkersInChart.pptx", SaveFormat.Pptx);
} finally {
    if (pres != null) pres.dispose();
}
FAQ
ประเภทแผนภูมิใดบ้างที่ Aspose.Slides รองรับ?
Aspose.Slides รองรับประเภทแผนภูมิหลากหลาย chart types ได้แก่ bar, line, pie, area, scatter, histogram, radar และอื่น ๆ อีกมาก ทำให้คุณเลือกประเภทที่เหมาะกับการแสดงผลข้อมูลของคุณได้
ฉันเพิ่มแผนภูมิใหม่ลงในสไลด์อย่างไร?
เพื่อเพิ่มแผนภูมิ คุณต้องสร้างอ็อบเจ็กต์ของคลาส Presentation แล้วเรียกสไลด์ที่ต้องการโดยใช้ดัชนี และเรียกเมธอดเพื่อเพิ่มแผนภูมิ พร้อมกำหนดประเภทแผนภูมิและข้อมูลเริ่มต้น กระบวนการนี้จะฝังแผนภูมิโดยตรงลงในงานนำเสนอของคุณ
ฉันจะอัปเดตข้อมูลที่แสดงในแผนภูมิได้อย่างไร?
คุณสามารถอัปเดตข้อมูลของแผนภูมิได้โดยเข้าถึง workbook ของข้อมูล (IChartDataWorkbook) ล้าง Series และ Categories เริ่มต้น แล้วเพิ่มข้อมูลที่กำหนดเองของคุณ ซึ่งจะทำให้แผนภูมิเงลียนข้อมูลล่าสุด
สามารถปรับแต่งลักษณะของแผนภูมิได้หรือไม่?
ได้, Aspose.Slides มีตัวเลือกการปรับแต่งมากมาย คุณสามารถแก้ไขสี, ฟอนต์, label, legend และองค์ประกอบ formatting elements อื่น ๆ เพื่อให้แผนภูมิตรงกับความต้องการออกแบบของคุณ