
在 Java 中为演示文稿图表添加趋势线
概述
本文说明如何使用 Aspose.Slides 为演示文稿中的图表添加趋势线。演示如何创建图表、向图表系列添加趋势线,并使用多种趋势线类型,包括指数、线性、对数、移动平均、多项式和幂。
还描述了如何通过插入直线形状在图表上添加自定义线,并提供了一个简短的 FAQ,解释了趋势线的前向和后向投影值的含义,以及在导出为 PDF 或 SVG 或将图表渲染为图像时趋势线是否会被保留。
添加趋势线
使用ITrendlineCollection.add向图表系列添加趋势线,使用TrendlineType选择其类型。示例创建了一个带默认数据的聚类柱形图,并向其三个系列中的每个系列添加了两条趋势线。
指数趋势线通过setDisplayEquation和setDisplayRSquaredValue隐藏其方程式和决定系数值,而线性趋势线为红色。对数趋势线使用addTextFrameForOverriding添加自定义标签。移动平均使用setPeriod设为三个数据点,并使用自定义setTrendlineName。
多项式趋势线的setOrder为三,并通过setForward向前延伸一个类别。幂趋势线通过setBackward向后延伸一个类别。
import com.aspose.slides.*;
import java.awt.Color;

Presentation presentation = new Presentation();
try {
    ISlide slide = presentation.getSlides().get_Item(0);

    IChart chart = slide.getShapes().addChart(ChartType.ClusteredColumn, 20, 20, 500, 400);

    IChartSeries firstSeries = chart.getChartData().getSeries().get_Item(0);

    ITrendline exponentialTrendline = firstSeries.getTrendLines().add(TrendlineType.Exponential);
    exponentialTrendline.setDisplayEquation(false);
    exponentialTrendline.setDisplayRSquaredValue(false);

    ITrendline linearTrendline = firstSeries.getTrendLines().add(TrendlineType.Linear);
    linearTrendline.getFormat().getLine().getFillFormat().setFillType(FillType.Solid);
    linearTrendline.getFormat().getLine().getFillFormat().getSolidFillColor().setColor(Color.RED);

    IChartSeries secondSeries = chart.getChartData().getSeries().get_Item(1);

    ITrendline logarithmicTrendline = secondSeries.getTrendLines().add(TrendlineType.Logarithmic);
    logarithmicTrendline.addTextFrameForOverriding("New log trend line");

    ITrendline movingAverageTrendline = secondSeries.getTrendLines().add(TrendlineType.MovingAverage);
    movingAverageTrendline.setPeriod((byte) 3);
    movingAverageTrendline.setTrendlineName("New TrendLine Name");

    IChartSeries thirdSeries = chart.getChartData().getSeries().get_Item(2);

    ITrendline polynomialTrendline = thirdSeries.getTrendLines().add(TrendlineType.Polynomial);
    polynomialTrendline.setForward(1);
    polynomialTrendline.setOrder((byte) 3);

    ITrendline powerTrendline = thirdSeries.getTrendLines().add(TrendlineType.Power);
    powerTrendline.setBackward(1);

    presentation.save("ChartTrendLines.pptx", SaveFormat.Pptx);
} finally {
    presentation.dispose();
}
设置趋势线截距
使用setIntercept将趋势线在 X = 0 时的 Y 值固定。此设置支持线性、指数和多项式趋势线。
例如,生产成本模型可能需要在已知固定成本 100 时开始,即使非零产量的测量值表明不同的基准线。对于线性趋势线,将截距固定为 b = 100,从而约束方程 y = ax + b,斜率在该约束下拟合数据。它并不是简单地移动已拟合的直线。坐标轴交叉设置控制图表坐标轴的相交位置,而不是已拟合趋势线的系数。
以下示例创建了一个散点 (XY) 图,产量从 1 到 4,对应成本分别为 170、200、230 和 260。它先使用默认的自动截距保存图表,然后将截距设置为 100 并保存第二个 PPTX。两个文件唯一的区别在于截距设置。趋势线显示其方程式并向后延伸到 X = 0。
import com.aspose.slides.*;

Presentation presentation = new Presentation();
try {
    ISlide slide = presentation.getSlides().get_Item(0);

    IChart chart = slide.getShapes().addChart(ChartType.ScatterWithMarkers, 20, 20, 480, 210);
    chart.setLegend(false);

    chart.getChartData().getSeries().clear();
    chart.getChartData().getCategories().clear();

    IChartDataWorkbook workbook = chart.getChartData().getChartDataWorkbook();
    workbook.clear(0);

    IChartDataCell nameCell = workbook.getCell(0, 0, 1, "Production cost");
    IChartSeries series = chart.getChartData().getSeries().add(nameCell, ChartType.ScatterWithMarkers);
    double[] costs = { 170, 200, 230, 260 };

    for (int i = 0; i < costs.length; i++) {
        IChartDataCell xCell = workbook.getCell(0, i + 1, 0, i + 1);
        IChartDataCell yCell = workbook.getCell(0, i + 1, 1, costs[i]);
        series.getDataPoints().addDataPointForScatterSeries(xCell, yCell);
    }

    ITrendline trendline = series.getTrendLines().add(TrendlineType.Linear);
    trendline.setDisplayEquation(true);
    trendline.setBackward(1);

    presentation.save("AutomaticIntercept.pptx", SaveFormat.Pptx);

    trendline.setIntercept(100);
    presentation.save("FixedIntercept.pptx", SaveFormat.Pptx);
} finally {
    presentation.dispose();
}
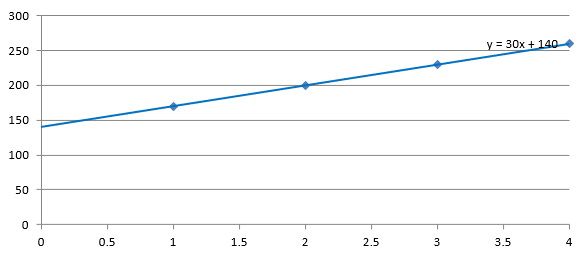
使用自动计算时,这些数据产生 y = 30x + 140。将截距设为 100 时则约得到 y = 43.33x + 100:零点的拟合值匹配已知基准线,而直线不再通过所有数据点。
| 自动截距 | 固定截距 100 |
|---|---|
 |
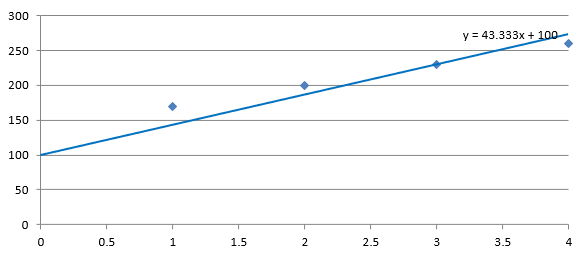 |
两幅图片使用相同的数据和坐标轴比例。趋势线向后延伸到 X = 0 以显示其截距。
默认情况下,getIntercept返回 Double.NaN,表示未指定的截距,而不是零。随后截距会根据数据自动计算。
添加自定义线
自定义线是一种绘制在图表之上的形状,而不是从系列数据计算得到的趋势线。此示例使用IShapeCollection.addAutoShape在图表上方的幻灯片中添加水平线。线的位置以幻灯片坐标(点)指定,因而从图表左边缘开始并位于图表中部。其宽度与图表宽度相同。getLineFormat 为该线设置了实心红色。
import com.aspose.slides.*;
import java.awt.Color;

Presentation presentation = new Presentation();
try {
    ISlide slide = presentation.getSlides().get_Item(0);

    IChart chart = slide.getShapes().addChart(ChartType.ClusteredColumn, 100, 100, 500, 400);

    IAutoShape line = slide.getShapes().addAutoShape(ShapeType.Line, chart.getX(), chart.getY() + chart.getHeight() / 2, chart.getWidth(), 0);
    line.getLineFormat().getFillFormat().setFillType(FillType.Solid);
    line.getLineFormat().getFillFormat().getSolidFillColor().setColor(Color.RED);

    presentation.save("AddCustomLines.pptx", SaveFormat.Pptx);
} finally {
    presentation.dispose();
}
常见问题
“前向”和“后向”在趋势线中是什么意思?
它们是趋势线向前或向后投影的长度:对于散点 (XY) 图表——以坐标轴单位计量;对于非散点图表——以类别数计量。仅允许非负值。
在将演示文稿导出为 PDF 或 SVG,或将幻灯片渲染为图像时,趋势线会被保留吗?
是的。Aspose.Slides 将演示文稿转换为PDF或SVG,并将图表渲染为图像;作为图表一部分的趋势线在这些操作中会被保留。还提供了一个方法以导出图表的图像本身。