Analyzing your prompt, please hold on...
An error occurred while retrieving the results. Please refresh the page and try again.
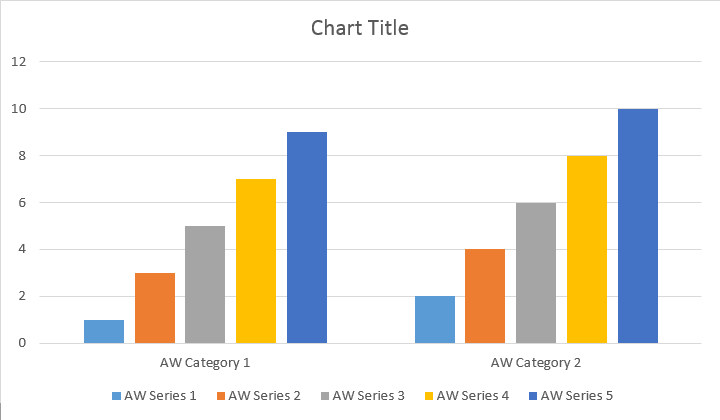
Aspose.Words provides the InsertChart method which was added into the DocumentBuilder class. So, let’s see how to insert a simple column chart into the document using DocumentBuilder->InsertChart method:
The code example given below shows how to insert a column chart.
The code produces the following result:
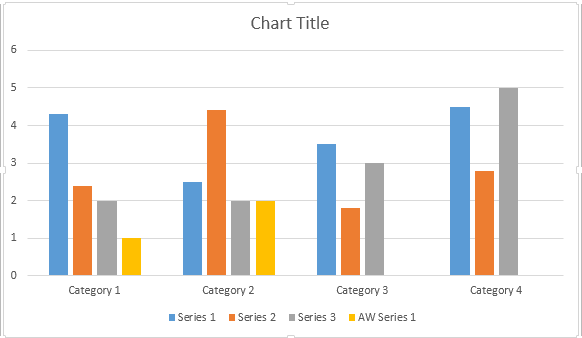
There are four different overloads for series Add method, which was exposed to cover all possible variants of data sources for all chart types:
The code produces the following result:
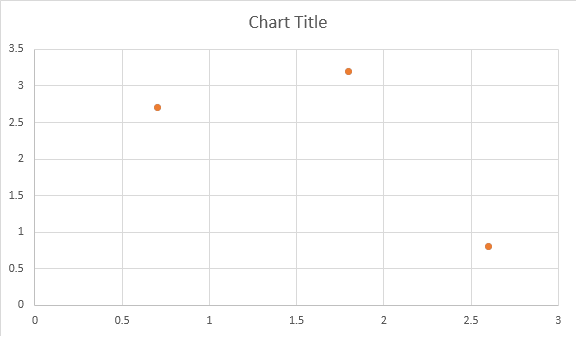
The code example given below shows how to insert a scatter chart.
The code produces the following result:
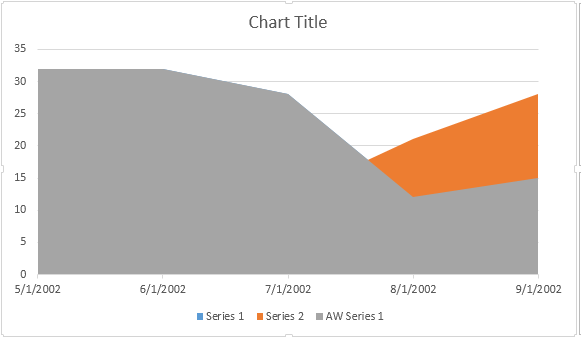
The code example given below shows how to insert an area chart.
The code produces the following result:
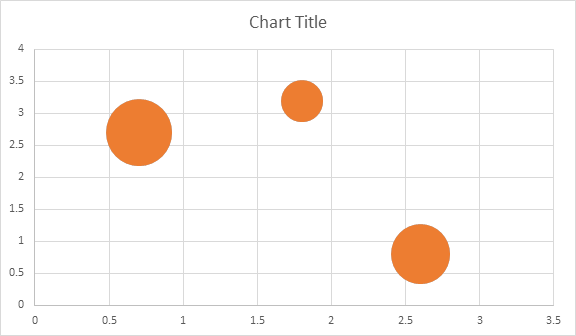
The code example given below shows how to insert a bubble chart.
The code produces the following result:
Q: How can I insert a chart at a specific location such as a bookmark?
A: Use a DocumentBuilder to move to the desired bookmark or paragraph first (e.g., builder->MoveToBookmark("MyBookmark");) and then call builder->InsertChart(...). The chart will be placed exactly where the builder’s cursor is positioned.
Q: After inserting a chart, how do I add data series and points to it?
A: Retrieve the chart’s ChartData object (Chart* chart = builder->InsertChart(...); ChartData* chartData = chart->get_ChartData();). Then call chartData->get_Series()->Add(...) to create a series and use Series->get_DataPoints()->Add(...) to populate points with numeric values.
Q: Can I change the chart type after it has been inserted?
A: Yes. Call chart->set_Type(ChartType::Pie); to change the type, or recreate the chart with the desired ChartType overload if you need a completely different layout.
Q: How do I set a chart title and axis labels?
A: Use chart->get_Title()->set_Text("Sales Overview"); for the main title. For axes, access chart->get_AxisX()->set_Title("Month"); and chart->get_AxisY()->set_Title("Revenue");.
Q: Why does the chart appear blank or without data in the generated document?
A: Ensure that you add at least one series with data points before saving the document. Also verify that the chart’s width and height are non‑zero (e.g., builder->InsertChart(ChartType::Column, 400, 300);). Missing series or zero size will result in an empty chart.
Analyzing your prompt, please hold on...
An error occurred while retrieving the results. Please refresh the page and try again.