
Crear o actualizar gráficos de presentaciones de PowerPoint en Android
Visión general
Este artículo ofrece una guía completa sobre cómo crear y personalizar gráficos usando Aspose.Slides para Android mediante Java. Aprenderá a añadir programáticamente un gráfico a una diapositiva, poblarlo con datos y aplicar diversas opciones de formato para ajustarse a sus requisitos de diseño específicos. A lo largo del artículo, se incluyen ejemplos de código detallados que ilustran cada paso, desde la inicialización de la presentación y el objeto gráfico hasta la configuración de series, ejes y leyendas. Siguiendo esta guía, obtendrá una comprensión sólida de cómo integrar la generación dinámica de gráficos en sus aplicaciones Android, facilitando la creación de presentaciones impulsadas por datos.
Crear un gráfico
Los gráficos ayudan a las personas a visualizar rápidamente los datos y a obtener ideas que pueden no ser evidentes de inmediato en una tabla o hoja de cálculo.
¿Por qué crear gráficos?
Con los gráficos, puede:
- agregar, condensar o resumir grandes cantidades de datos en una sola diapositiva de una presentación;
- revelar patrones y tendencias en los datos;
- deducir la dirección y el impulso de los datos a lo largo del tiempo o con respecto a una unidad de medida específica;
- detectar valores atípicos, aberraciones, desviaciones, errores y datos sin sentido;
- comunicar o presentar datos complejos.
En PowerPoint, puede crear gráficos mediante la función Insertar, que ofrece plantillas para diseñar muchos tipos de gráficos. Con Aspose.Slides, puede crear tanto gráficos habituales (basados en tipos de gráfico populares) como gráficos personalizados.
Note
Utilice la enumeración ChartType del paquete com.aspose.slides. Los valores de esta enumeración corresponden a diferentes tipos de gráficos.Crear gráficos de columnas agrupadas
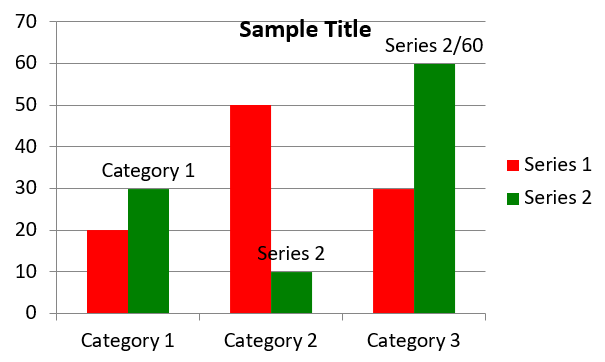
Este ejemplo usa addChart para crear un gráfico de columnas agrupadas que compara dos series a través de tres categorías. Las series utilizan rellenos rojo y verde, y las etiquetas individuales muestran nombres de categoría, nombres de serie y valores. El índice de hoja 0 se refiere a la primera hoja del libro de trabajo integrado del gráfico.
import com.aspose.slides.*;
import android.graphics.Color;

Presentation presentation = new Presentation();
try
{
    ISlide slide = presentation.getSlides().get_Item(0);

    IChart chart = slide.getShapes().addChart(ChartType.ClusteredColumn, 20, 20, 500, 300);

    chart.getChartTitle().addTextFrameForOverriding("Sample Title");
    chart.getChartTitle().getTextFrameForOverriding().getTextFrameFormat().setCenterText(NullableBool.True);
    chart.getChartTitle().setHeight(20);
    chart.setTitle(true);

    IChartDataWorkbook workbook = chart.getChartData().getChartDataWorkbook();
    int worksheetIndex = 0;

    chart.getChartData().getSeries().clear();
    chart.getChartData().getCategories().clear();

    IChartDataCell seriesNameCell = workbook.getCell(worksheetIndex, 0, 1, "Series 1");
    chart.getChartData().getSeries().add(seriesNameCell, chart.getType());
    seriesNameCell = workbook.getCell(worksheetIndex, 0, 2, "Series 2");
    chart.getChartData().getSeries().add(seriesNameCell, chart.getType());

    IChartDataCell categoryCell = workbook.getCell(worksheetIndex, 1, 0, "Category 1");
    chart.getChartData().getCategories().add(categoryCell);
    categoryCell = workbook.getCell(worksheetIndex, 2, 0, "Category 2");
    chart.getChartData().getCategories().add(categoryCell);
    categoryCell = workbook.getCell(worksheetIndex, 3, 0, "Category 3");
    chart.getChartData().getCategories().add(categoryCell);

    IChartSeries series = chart.getChartData().getSeries().get_Item(0);

    IChartDataCell valueCell = workbook.getCell(worksheetIndex, 1, 1, 20);
    series.getDataPoints().addDataPointForBarSeries(valueCell);
    valueCell = workbook.getCell(worksheetIndex, 2, 1, 50);
    series.getDataPoints().addDataPointForBarSeries(valueCell);
    valueCell = workbook.getCell(worksheetIndex, 3, 1, 30);
    series.getDataPoints().addDataPointForBarSeries(valueCell);

    series.getFormat().getFill().setFillType(FillType.Solid);
    series.getFormat().getFill().getSolidFillColor().setColor(Color.RED);

    series = chart.getChartData().getSeries().get_Item(1);

    valueCell = workbook.getCell(worksheetIndex, 1, 2, 30);
    series.getDataPoints().addDataPointForBarSeries(valueCell);
    valueCell = workbook.getCell(worksheetIndex, 2, 2, 10);
    series.getDataPoints().addDataPointForBarSeries(valueCell);
    valueCell = workbook.getCell(worksheetIndex, 3, 2, 60);
    series.getDataPoints().addDataPointForBarSeries(valueCell);

    series.getFormat().getFill().setFillType(FillType.Solid);
    series.getFormat().getFill().getSolidFillColor().setColor(Color.rgb(0, 128, 0));

    IDataLabel label = series.getDataPoints().get_Item(0).getLabel();
    label.getDataLabelFormat().setShowCategoryName(true);

    label = series.getDataPoints().get_Item(1).getLabel();
    label.getDataLabelFormat().setShowSeriesName(true);

    label = series.getDataPoints().get_Item(2).getLabel();
    label.getDataLabelFormat().setShowValue(true);
    label.getDataLabelFormat().setShowSeriesName(true);
    label.getDataLabelFormat().setSeparator("/");

    presentation.save("AsposeChart.pptx", SaveFormat.Pptx);
}
finally
{
    presentation.dispose();
}
El resultado:
Crear gráficos de dispersión
Los gráficos de dispersión (también conocidos como diagramas de dispersión o gráficos x‑y) se utilizan a menudo para comprobar patrones o demostrar correlaciones entre dos variables.
Use un gráfico de dispersión cuando:
- tenga datos numéricos emparejados;
- tenga dos variables que se relacionen bien entre sí;
- quiera determinar si las dos variables están relacionadas;
- tenga una variable independiente que tenga múltiples valores para una variable dependiente.
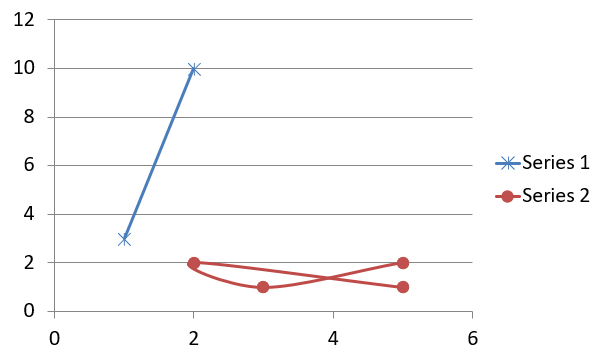
Este ejemplo traza dos conjuntos de valores x‑y. La primera serie usa líneas rectas con marcadores de estrella, mientras que la segunda usa líneas suavizadas con marcadores circulares; ambas usan un tamaño de marcador de 10, configurado con setSize. El método setSymbol controla la forma del marcador.
import com.aspose.slides.*;

Presentation presentation = new Presentation();
try
{
    ISlide slide = presentation.getSlides().get_Item(0);

    IChart chart = slide.getShapes().addChart(ChartType.ScatterWithSmoothLines, 20, 20, 500, 300);

    IChartDataWorkbook workbook = chart.getChartData().getChartDataWorkbook();
    int worksheetIndex = 0;

    chart.getChartData().getSeries().clear();

    IChartDataCell seriesNameCell = workbook.getCell(worksheetIndex, 1, 1, "Series 1");
    chart.getChartData().getSeries().add(seriesNameCell, chart.getType());
    seriesNameCell = workbook.getCell(worksheetIndex, 1, 3, "Series 2");
    chart.getChartData().getSeries().add(seriesNameCell, chart.getType());

    IChartSeries series = chart.getChartData().getSeries().get_Item(0);

    IChartDataCell xValueCell = workbook.getCell(worksheetIndex, 2, 1, 1);
    IChartDataCell yValueCell = workbook.getCell(worksheetIndex, 2, 2, 3);
    series.getDataPoints().addDataPointForScatterSeries(xValueCell, yValueCell);

    xValueCell = workbook.getCell(worksheetIndex, 3, 1, 2);
    yValueCell = workbook.getCell(worksheetIndex, 3, 2, 10);
    series.getDataPoints().addDataPointForScatterSeries(xValueCell, yValueCell);

    series.setType(ChartType.ScatterWithStraightLinesAndMarkers);

    series.getMarker().setSize(10);
    series.getMarker().setSymbol(MarkerStyleType.Star);

    series = chart.getChartData().getSeries().get_Item(1);

    xValueCell = workbook.getCell(worksheetIndex, 2, 3, 5);
    yValueCell = workbook.getCell(worksheetIndex, 2, 4, 2);
    series.getDataPoints().addDataPointForScatterSeries(xValueCell, yValueCell);

    xValueCell = workbook.getCell(worksheetIndex, 3, 3, 3);
    yValueCell = workbook.getCell(worksheetIndex, 3, 4, 1);
    series.getDataPoints().addDataPointForScatterSeries(xValueCell, yValueCell);

    xValueCell = workbook.getCell(worksheetIndex, 4, 3, 2);
    yValueCell = workbook.getCell(worksheetIndex, 4, 4, 2);
    series.getDataPoints().addDataPointForScatterSeries(xValueCell, yValueCell);

    xValueCell = workbook.getCell(worksheetIndex, 5, 3, 5);
    yValueCell = workbook.getCell(worksheetIndex, 5, 4, 1);
    series.getDataPoints().addDataPointForScatterSeries(xValueCell, yValueCell);

    series.getMarker().setSize(10);
    series.getMarker().setSymbol(MarkerStyleType.Circle);

    presentation.save("AsposeChart.pptx", SaveFormat.Pptx);
}
finally
{
    presentation.dispose();
}
El resultado:
Crear gráficos de pastel
Los gráficos de pastel se utilizan mejor para mostrar la relación parte‑todo en los datos, especialmente cuando los datos contienen etiquetas categóricas con valores numéricos. Sin embargo, si sus datos contienen muchas partes o etiquetas, podría considerar usar un gráfico de barras en su lugar.
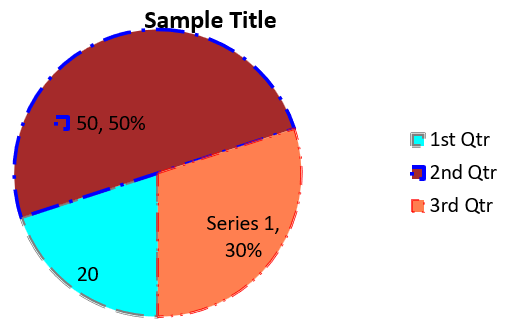
Este ejemplo crea un gráfico de pastel con tres valores trimestrales. Cada porción tiene un relleno y un borde personalizados, y las etiquetas muestran diferentes combinaciones de valores, porcentajes e información de la serie. El método setFirstSliceAngle establece que la primera porción comience en 180 grados.
import com.aspose.slides.*;
import android.graphics.Color;

Presentation presentation = new Presentation();
try
{
    ISlide slide = presentation.getSlides().get_Item(0);

    IChart chart = slide.getShapes().addChart(ChartType.Pie, 20, 20, 500, 300);

    chart.getChartTitle().addTextFrameForOverriding("Sample Title");
    chart.getChartTitle().getTextFrameForOverriding().getTextFrameFormat().setCenterText(NullableBool.True);
    chart.getChartTitle().setHeight(20);
    chart.setTitle(true);

    chart.getChartData().getSeries().get_Item(0).getLabels().getDefaultDataLabelFormat().setShowValue(true);

    IChartDataWorkbook workbook = chart.getChartData().getChartDataWorkbook();
    int worksheetIndex = 0;

    chart.getChartData().getSeries().clear();
    chart.getChartData().getCategories().clear();

    IChartDataCell categoryCell = workbook.getCell(0, 1, 0, "1st Qtr");
    chart.getChartData().getCategories().add(categoryCell);
    categoryCell = workbook.getCell(0, 2, 0, "2nd Qtr");
    chart.getChartData().getCategories().add(categoryCell);
    categoryCell = workbook.getCell(0, 3, 0, "3rd Qtr");
    chart.getChartData().getCategories().add(categoryCell);

    IChartDataCell seriesNameCell = workbook.getCell(0, 0, 1, "Series 1");
    IChartSeries series = chart.getChartData().getSeries().add(seriesNameCell, chart.getType());

    IChartDataCell valueCell = workbook.getCell(worksheetIndex, 1, 1, 20);
    series.getDataPoints().addDataPointForPieSeries(valueCell);
    valueCell = workbook.getCell(worksheetIndex, 2, 1, 50);
    series.getDataPoints().addDataPointForPieSeries(valueCell);
    valueCell = workbook.getCell(worksheetIndex, 3, 1, 30);
    series.getDataPoints().addDataPointForPieSeries(valueCell);

    chart.getChartData().getSeriesGroups().get_Item(0).setColorVaried(true);

    IChartDataPoint firstSlice = series.getDataPoints().get_Item(0);
    firstSlice.getFormat().getFill().setFillType(FillType.Solid);
    firstSlice.getFormat().getFill().getSolidFillColor().setColor(Color.CYAN);

    firstSlice.getFormat().getLine().getFillFormat().setFillType(FillType.Solid);
    firstSlice.getFormat().getLine().getFillFormat().getSolidFillColor().setColor(Color.rgb(128, 128, 128));
    firstSlice.getFormat().getLine().setWidth(3.0);
    firstSlice.getFormat().getLine().setStyle(LineStyle.ThinThick);
    firstSlice.getFormat().getLine().setDashStyle(LineDashStyle.LargeDash);

    IChartDataPoint secondSlice = series.getDataPoints().get_Item(1);
    secondSlice.getFormat().setFill().setFillType(FillType.Solid);
    secondSlice.getFormat().getFill().getSolidFillColor().setColor(Color.rgb(165, 42, 42));

    secondSlice.getFormat().getLine().getFillFormat().setFillType(FillType.Solid);
    secondSlice.getFormat().getLine().getFillFormat().getSolidFillColor().setColor(Color.BLUE);
    secondSlice.getFormat().getLine().setWidth(3.0);
    secondSlice.getFormat().getLine().setStyle(LineStyle.Single);
    secondSlice.getFormat().getLine().setDashStyle(LineDashStyle.LargeDashDot);

    IChartDataPoint thirdSlice = series.getDataPoints().get_Item(2);
    thirdSlice.getFormat().getFill().setFillType(FillType.Solid);
    thirdSlice.getFormat().getFill().getSolidFillColor().setColor(Color.rgb(255, 127, 80));

    thirdSlice.getFormat().getLine().getFillFormat().setFillType(FillType.Solid);
    thirdSlice.getFormat().getLine().getFillFormat().getSolidFillColor().setColor(Color.RED);
    thirdSlice.getFormat().getLine().setWidth(2.0);
    thirdSlice.getFormat().getLine().setStyle(LineStyle.ThinThin);
    thirdSlice.getFormat().getLine().setDashStyle(LineDashStyle.LargeDashDotDot);

    IDataLabel firstLabel = series.getDataPoints().get_Item(0).getLabel();
    firstLabel.getDataLabelFormat().setShowValue(true);

    IDataLabel secondLabel = series.getDataPoints().get_Item(1).getLabel();
    secondLabel.getDataLabelFormat().setShowValue(true);
    secondLabel.getDataLabelFormat().setShowLegendKey(true);
    secondLabel.getDataLabelFormat().setShowPercentage(true);

    IDataLabel thirdLabel = series.getDataPoints().get_Item(2).getLabel();
    thirdLabel.getDataLabelFormat().setShowSeriesName(true);
    thirdLabel.getDataLabelFormat().setShowPercentage(true);

    series.getLabels().getDefaultDataLabelFormat().setShowLeaderLines(true);

    chart.getChartData().getSeriesGroups().get_Item(0).setFirstSliceAngle(180);

    presentation.save("PieChart.pptx", SaveFormat.Pptx);
}
finally
{
    presentation.dispose();
}
El resultado:
Crear gráficos de líneas
Los gráficos de líneas (también conocidos como diagramas de líneas) se emplean mejor en situaciones en las que desea demostrar cambios en el valor a lo largo del tiempo. Con un gráfico de líneas, puede comparar una gran cantidad de datos a la vez, seguir cambios y tendencias a lo largo del tiempo, resaltar anomalías en series de datos y más.
Este ejemplo usa addChart para crear un gráfico de líneas con series y categorías predeterminadas, y luego guarda la presentación como PPTX.
import com.aspose.slides.*;

Presentation presentation = new Presentation();
try
{
    ISlide slide = presentation.getSlides().get_Item(0);

    IChart lineChart = slide.getShapes().addChart(ChartType.Line, 20, 20, 500, 300);

    presentation.save("lineChart.pptx", SaveFormat.Pptx);
}
finally
{
    presentation.dispose();
}
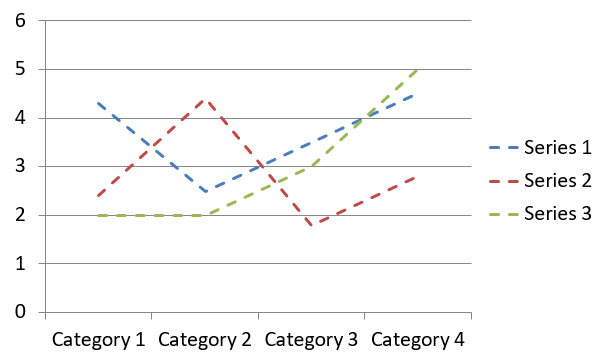
De forma predeterminada, los puntos de un gráfico de líneas están unidos por líneas rectas continuas. Si desea que los puntos se unan mediante guiones, llame a setDashStyle con un valor de LineDashStyle:
import com.aspose.slides.*;

Presentation presentation = new Presentation();
try
{
    ISlide slide = presentation.getSlides().get_Item(0);

    IChart lineChart = slide.getShapes().addChart(ChartType.Line, 20, 20, 500, 300);

    for (IChartSeries series : lineChart.getChartData().getSeries())
    {
        series.getFormat().getLine().setDashStyle(LineDashStyle.Dash);
    }
}
finally
{
    presentation.dispose();
}
El resultado:
Crear gráficos de mapa de árbol
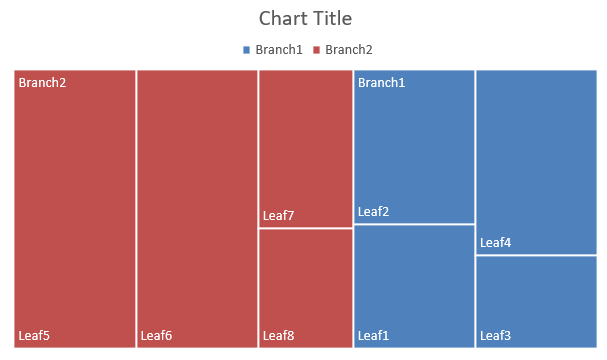
Los gráficos de mapa de árbol se utilizan mejor para datos de ventas cuando desea mostrar el tamaño relativo de las categorías de datos y llamar rápidamente la atención sobre los elementos que son grandes contribuyentes dentro de cada categoría.
Este ejemplo crea un mapa de árbol con ocho hojas agrupadas en cuatro troncos y dos ramificaciones. El método setGroupingItem asigna troncos en el nivel de agrupación 1 y ramificaciones en el nivel 2. Los valores determinan los tamaños relativos de los rectángulos, mientras que las etiquetas de categoría y las etiquetas de padres superpuestas identifican la jerarquía.
import com.aspose.slides.*;

Presentation presentation = new Presentation();
try
{
    ISlide slide = presentation.getSlides().get_Item(0);

    IChart chart = slide.getShapes().addChart(ChartType.Treemap, 20, 20, 500, 300);

    chart.getChartData().getCategories().clear();
    chart.getChartData().getSeries().clear();

    IChartDataWorkbook workbook = chart.getChartData().getChartDataWorkbook();
    workbook.clear(0);

    // Rama 1
    IChartDataCell categoryCell = workbook.getCell(0, "C1", "Leaf1");
    IChartCategory leaf = chart.getChartData().getCategories().add(categoryCell);
    leaf.getGroupingLevels().setGroupingItem(1, "Stem1");
    leaf.getGroupingLevels().setGroupingItem(2, "Branch1");

    categoryCell = workbook.getCell(0, "C2", "Leaf2");
    chart.getChartData().getCategories().add(categoryCell);

    categoryCell = workbook.getCell(0, "C3", "Leaf3");
    leaf = chart.getChartData().getCategories().add(categoryCell);
    leaf.getGroupingLevels().setGroupingItem(1, "Stem2");

    categoryCell = workbook.getCell(0, "C4", "Leaf4");
    chart.getChartData().getCategories().add(categoryCell);

    // Rama 2
    categoryCell = workbook.getCell(0, "C5", "Leaf5");
    leaf = chart.getChartData().getCategories().add(categoryCell);
    leaf.getGroupingLevels().setGroupingItem(1, "Stem3");
    leaf.getGroupingLevels().setGroupingItem(2, "Branch2");

    categoryCell = workbook.getCell(0, "C6", "Leaf6");
    chart.getChartData().getCategories().add(categoryCell);

    categoryCell = workbook.getCell(0, "C7", "Leaf7");
    leaf = chart.getChartData().getCategories().add(categoryCell);
    leaf.getGroupingLevels().setGroupingItem(1, "Stem4");

    categoryCell = workbook.getCell(0, "C8", "Leaf8");
    chart.getChartData().getCategories().add(categoryCell);

    IChartSeries series = chart.getChartData().getSeries().add(ChartType.Treemap);
    series.getLabels().getDefaultDataLabelFormat().setShowCategoryName(true);
    IChartDataCell valueCell = workbook.getCell(0, "D1", 4);
    series.getDataPoints().addDataPointForTreemapSeries(valueCell);
    valueCell = workbook.getCell(0, "D2", 5);
    series.getDataPoints().addDataPointForTreemapSeries(valueCell);
    valueCell = workbook.getCell(0, "D3", 3);
    series.getDataPoints().addDataPointForTreemapSeries(valueCell);
    valueCell = workbook.getCell(0, "D4", 6);
    series.getDataPoints().addDataPointForTreemapSeries(valueCell);
    valueCell = workbook.getCell(0, "D5", 9);
    series.getDataPoints().addDataPointForTreemapSeries(valueCell);
    valueCell = workbook.getCell(0, "D6", 9);
    series.getDataPoints().addDataPointForTreemapSeries(valueCell);
    valueCell = workbook.getCell(0, "D7", 4);
    series.getDataPoints().addDataPointForTreemapSeries(valueCell);
    valueCell = workbook.getCell(0, "D8", 3);
    series.getDataPoints().addDataPointForTreemapSeries(valueCell);

    series.setParentLabelLayout(ParentLabelLayoutType.Overlapping);

    presentation.save("Treemap.pptx", SaveFormat.Pptx);
}
finally
{
    presentation.dispose();
}
El resultado:
Crear gráficos de cascada
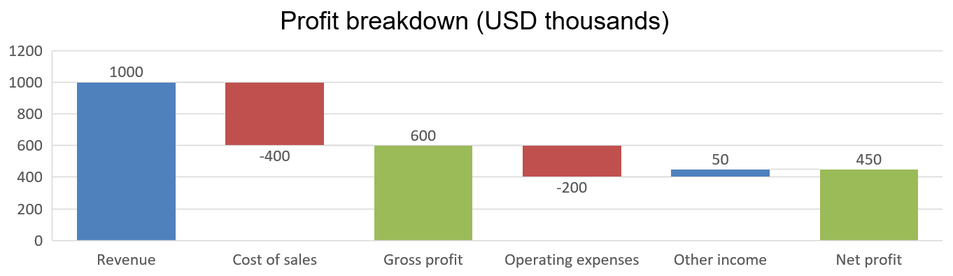
Un gráfico de cascada muestra cómo los cambios positivos y negativos contribuyen a un valor final. Por ejemplo, un desglose de beneficios puede comenzar con los ingresos, restar costos y añadir otros ingresos. Las columnas de cambio flotan entre los valores acumulados anteriores y los nuevos, mientras que las columnas totales se extienden desde cero hasta el valor acumulado.
El siguiente ejemplo utiliza cantidades en miles de dólares estadounidenses:
| Categoría | Valor en el libro | Tipo de columna |
|---|---|---|
| Ingresos | 1000 | Incremento |
| Coste de ventas | -400 | Decremento |
| Beneficio bruto | 600 | Total intermedio |
| Gastos operativos | -200 | Decremento |
| Otros ingresos | 50 | Incremento |
| Beneficio neto | 450 | Total final |
Para marcar un punto como total intermedio o final, llame a su método setSetAsTotal con true. Proporcione la cantidad acumulada real en la celda del libro correspondiente: 600 para el beneficio bruto (1000 - 400) y 450 para el beneficio neto (600 - 200 + 50). El método marca la columna como total; no calcula ni rellena el valor de la celda. No use cero como marcador de posición ni proporcione otro cambio para un punto total. Una columna total muestra el valor acumulado sin volver a añadirlo al valor corriente.
Este ejemplo completo en Java crea un gráfico usando el miembro Waterfall de ChartType, elimina los datos predeterminados y rellena el libro de trabajo integrado. El índice de hoja 0 selecciona la primera hoja; la columna A contiene los nombres de categoría y la columna B los valores. Cada celda de valor se añade con addDataPointForWaterfallSeries. Los índices de punto basados en cero 2 y 5 identifican los totales intermedios y finales. Llamar a setShowValue con true muestra las cantidades en las columnas. No se necesita una presentación o libro de trabajo de entrada.
import com.aspose.slides.*;

Presentation presentation = new Presentation();
try
{
    ISlide slide = presentation.getSlides().get_Item(0);

    IChart chart = slide.getShapes().addChart(ChartType.Waterfall, 20, 20, 680, 200);

    chart.setTitle(true);
    chart.getChartTitle().addTextFrameForOverriding("Profit breakdown (USD thousands)");
    chart.getChartTitle().setOverlay(false);
    chart.setLegend(false);

    chart.getChartData().getSeries().clear();
    chart.getChartData().getCategories().clear();

    IChartDataWorkbook workbook = chart.getChartData().getChartDataWorkbook();
    int worksheetIndex = 0;

    workbook.clear(worksheetIndex);

    IChartDataCell seriesNameCell = workbook.getCell(worksheetIndex, 0, 1, "Profit");
    IChartSeries series = chart.getChartData().getSeries().add(seriesNameCell, ChartType.Waterfall);
    String[] categories = new String[] { "Revenue", "Cost of sales", "Gross profit", "Operating expenses", "Other income", "Net profit" };
    double[] values = new double[] { 1000, -400, 600, -200, 50, 450 };

    for (int i = 0; i < categories.length; i++)
    {
        IChartDataCell categoryCell = workbook.getCell(worksheetIndex, i + 1, 0, categories[i]);
        chart.getChartData().getCategories().add(categoryCell);
        IChartDataCell valueCell = workbook.getCell(worksheetIndex, i + 1, 1, values[i]);
        series.getDataPoints().addDataPointForWaterfallSeries(valueCell);
    }

    // Los puntos tercero y sexto representan totales, no cambios adicionales.
    series.getDataPoints().get_Item(2).setSetAsTotal(true);
    series.getDataPoints().get_Item(5).setSetAsTotal(true);
    series.setShowConnectorLines(true);
    series.getLabels().getDefaultDataLabelFormat().setShowValue(true);

    presentation.save("WaterfallChart.pptx", SaveFormat.Pptx);
}
finally
{
    presentation.dispose();
}
Llame al método a nivel de serie setShowConnectorLines con true para mostrar líneas que conectan columnas consecutivas y facilitar el seguimiento del valor acumulado. Para ocultar estas líneas, reemplace la llamada al método en el ejemplo por series.setShowConnectorLines(false); antes de guardar. Esto solo cambia la visibilidad de la línea, no los datos ni los totales.
La presentación guardada muestra un beneficio bruto de 600 y un beneficio neto de 450, con ambos totales dibujados desde cero:
Crear gráficos de cotización
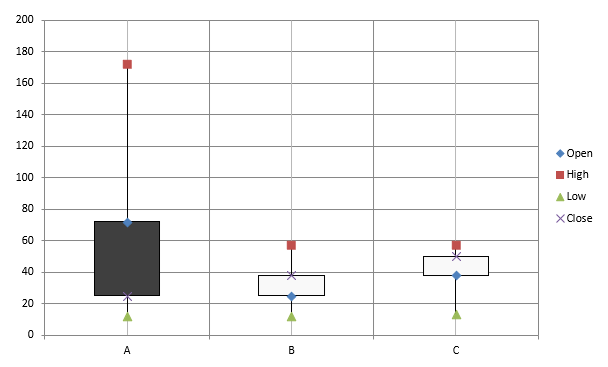
Los gráficos de cotización se utilizan para mostrar datos financieros como precios de apertura, máximo, mínimo y cierre, ayudando a analizar tendencias del mercado y volatilidad. Ofrecen información esencial sobre el rendimiento de acciones, facilitando la toma de decisiones informadas por parte de inversores y analistas.
Este ejemplo crea un gráfico OHLC con cuatro series en ese orden y tres categorías. El método setUpDownBars habilita barras arriba/abajo, y getHiLowLinesFormat controla las líneas alto‑bajo que muestran los rangos de precios, mientras que las líneas de serie individuales y las líneas de cuadrícula horizontales menores están ocultas.
import com.aspose.slides.*;

Presentation presentation = new Presentation();
try
{
    ISlide slide = presentation.getSlides().get_Item(0);

    IChart chart = slide.getShapes().addChart(ChartType.OpenHighLowClose, 20, 20, 500, 300, false);

    IChartDataWorkbook workbook = chart.getChartData().getChartDataWorkbook();

    IChartDataCell categoryCell = workbook.getCell(0, 1, 0, "A");
    chart.getChartData().getCategories().add(categoryCell);
    categoryCell = workbook.getCell(0, 2, 0, "B");
    chart.getChartData().getCategories().add(categoryCell);
    categoryCell = workbook.getCell(0, 3, 0, "C");
    chart.getChartData().getCategories().add(categoryCell);

    IChartDataCell seriesNameCell = workbook.getCell(0, 0, 1, "Open");
    chart.getChartData().getSeries().add(seriesNameCell, ChartType.OpenHighLowClose);
    seriesNameCell = workbook.getCell(0, 0, 2, "High");
    chart.getChartData().getSeries().add(seriesNameCell, ChartType.OpenHighLowClose);
    seriesNameCell = workbook.getCell(0, 0, 3, "Low");
    chart.getChartData().getSeries().add(seriesNameCell, ChartType.OpenHighLowClose);
    seriesNameCell = workbook.getCell(0, 0, 4, "Close");
    chart.getChartData().getSeries().add(seriesNameCell, ChartType.OpenHighLowClose);

    IChartSeries series = chart.getChartData().getSeries().get_Item(0);
    IChartDataCell valueCell = workbook.getCell(0, 1, 1, 72);
    series.getDataPoints().addDataPointForStockSeries(valueCell);
    valueCell = workbook.getCell(0, 2, 1, 25);
    series.getDataPoints().addDataPointForStockSeries(valueCell);
    valueCell = workbook.getCell(0, 3, 1, 38);
    series.getDataPoints().addDataPointForStockSeries(valueCell);

    series = chart.getChartData().getSeries().get_Item(1);
    valueCell = workbook.getCell(0, 1, 2, 172);
    series.getDataPoints().addDataPointForStockSeries(valueCell);
    valueCell = workbook.getCell(0, 2, 2, 57);
    series.getDataPoints().addDataPointForStockSeries(valueCell);
    valueCell = workbook.getCell(0, 3, 2, 57);
    series.getDataPoints().addDataPointForStockSeries(valueCell);

    series = chart.getChartData().getSeries().get_Item(2);
    valueCell = workbook.getCell(0, 1, 3, 12);
    series.getDataPoints().addDataPointForStockSeries(valueCell);
    valueCell = workbook.getCell(0, 2, 3, 12);
    series.getDataPoints().addDataPointForStockSeries(valueCell);
    valueCell = workbook.getCell(0, 3, 3, 13);
    series.getDataPoints().addDataPointForStockSeries(valueCell);

    series = chart.getChartData().getSeries().get_Item(3);
    valueCell = workbook.getCell(0, 1, 4, 25);
    series.getDataPoints().addDataPointForStockSeries(valueCell);
    valueCell = workbook.getCell(0, 2, 4, 38);
    series.getDataPoints().addDataPointForStockSeries(valueCell);
    valueCell = workbook.getCell(0, 3, 4, 50);
    series.getDataPoints().addDataPointForStockSeries(valueCell);

    chart.getChartData().getSeriesGroups().get_Item(0).getUpDownBars().setUpDownBars(true);
    chart.getChartData().getSeriesGroups().get_Item(0).getHiLowLinesFormat().getLine().getFillFormat().setFillType(FillType.Solid);

    for (IChartSeries stockSeries : chart.getChartData().getSeries())
    {
        stockSeries.getFormat().getLine().getFillFormat().setFillType(FillType.NoFill);
    }

    chart.getAxes().getVerticalAxis().getMinorGridLinesFormat().getLine().getFillFormat().setFillType(FillType.NoFill);

    presentation.save("Stock-chart.pptx", SaveFormat.Pptx);
}
finally
{
    presentation.dispose();
}
El resultado:
Crear gráficos de caja y bigotes
Los gráficos de caja y bigotes se utilizan para mostrar la distribución de datos resumendo medidas estadísticas clave, como la mediana, los cuartiles y los posibles valores atípicos. Son particularmente útiles en análisis exploratorio de datos y estudios estadísticos para comprender rápidamente la variabilidad de los datos e identificar anomalías.
Este ejemplo crea un gráfico de caja y bigotes a partir de seis valores. El método setQuartileMethod selecciona el cálculo de cuartiles exclusivo. El ejemplo también habilita líneas de media, marcadores de media, puntos internos y puntos atípicos.
import com.aspose.slides.*;

Presentation presentation = new Presentation();
try
{
    ISlide slide = presentation.getSlides().get_Item(0);

    IChart chart = slide.getShapes().addChart(ChartType.BoxAndWhisker, 20, 20, 500, 300);

    chart.getChartData().getCategories().clear();
    chart.getChartData().getSeries().clear();

    IChartDataWorkbook workbook = chart.getChartData().getChartDataWorkbook();
    workbook.clear(0);

    IChartDataCell categoryCell = workbook.getCell(0, "A1", "Category 1");
    chart.getChartData().getCategories().add(categoryCell);
    categoryCell = workbook.getCell(0, "A2", "Category 2");
    chart.getChartData().getCategories().add(categoryCell);
    categoryCell = workbook.getCell(0, "A3", "Category 3");
    chart.getChartData().getCategories().add(categoryCell);
    categoryCell = workbook.getCell(0, "A4", "Category 4");
    chart.getChartData().getCategories().add(categoryCell);
    categoryCell = workbook.getCell(0, "A5", "Category 5");
    chart.getChartData().getCategories().add(categoryCell);
    categoryCell = workbook.getCell(0, "A6", "Category 6");
    chart.getChartData().getCategories().add(categoryCell);

    IChartSeries series = chart.getChartData().getSeries().add(ChartType.BoxAndWhisker);

    series.setQuartileMethod(QuartileMethodType.Exclusive);
    series.setShowMeanLine(true);
    series.setShowMeanMarkers(true);
    series.setShowInnerPoints(true);
    series.setShowOutlierPoints(true);

    IChartDataCell valueCell = workbook.getCell(0, "B1", 15);
    series.getDataPoints().addDataPointForBoxAndWhiskerSeries(valueCell);
    valueCell = workbook.getCell(0, "B2", 41);
    series.getDataPoints().addDataPointForBoxAndWhiskerSeries(valueCell);
    valueCell = workbook.getCell(0, "B3", 16);
    series.getDataPoints().addDataPointForBoxAndWhiskerSeries(valueCell);
    valueCell = workbook.getCell(0, "B4", 10);
    series.getDataPoints().addDataPointForBoxAndWhiskerSeries(valueCell);
    valueCell = workbook.getCell(0, "B5", 23);
    series.getDataPoints().addDataPointForBoxAndWhiskerSeries(valueCell);
    valueCell = workbook.getCell(0, "B6", 16);
    series.getDataPoints().addDataPointForBoxAndWhiskerSeries(valueCell);

    presentation.save("BoxAndWhisker.pptx", SaveFormat.Pptx);
}
finally
{
    presentation.dispose();
}
Crear gráficos de embudo
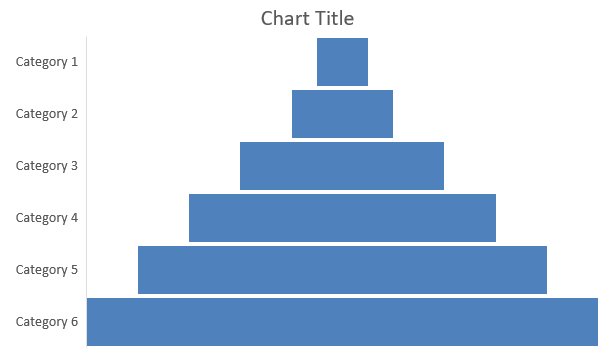
Los gráficos de embudo se utilizan para visualizar procesos que implican etapas secuenciales, donde el volumen de datos disminuye a medida que avanza de un paso al siguiente. Son especialmente útiles para analizar tasas de conversión, identificar cuellos de botella y seguir la eficiencia de procesos de ventas o marketing.
Este ejemplo usa addChart para añadir un gráfico de embudo a la primera diapositiva de una presentación existente. Reemplaza los datos predeterminados con seis categorías y valores que van de 50 a 500, y luego guarda la presentación actualizada. La presentación de entrada debe contener al menos una diapositiva.
import com.aspose.slides.*;

Presentation presentation = new Presentation("test.pptx");
try
{
    ISlide slide = presentation.getSlides().get_Item(0);

    IChart chart = slide.getShapes().addChart(ChartType.Funnel, 50, 50, 500, 400);

    chart.getChartData().getCategories().clear();
    chart.getChartData().getSeries().clear();

    IChartDataWorkbook workbook = chart.getChartData().getChartDataWorkbook();
    workbook.clear(0);

    IChartDataCell categoryCell = workbook.getCell(0, "A1", "Category 1");
    chart.getChartData().getCategories().add(categoryCell);
    categoryCell = workbook.getCell(0, "A2", "Category 2");
    chart.getChartData().getCategories().add(categoryCell);
    categoryCell = workbook.getCell(0, "A3", "Category 3");
    chart.getChartData().getCategories().add(categoryCell);
    categoryCell = workbook.getCell(0, "A4", "Category 4");
    chart.getChartData().getCategories().add(categoryCell);
    categoryCell = workbook.getCell(0, "A5", "Category 5");
    chart.getChartData().getCategories().add(categoryCell);
    categoryCell = workbook.getCell(0, "A6", "Category 6");
    chart.getChartData().getCategories().add(categoryCell);

    IChartSeries series = chart.getChartData().getSeries().add(ChartType.Funnel);

    IChartDataCell valueCell = workbook.getCell(0, "B1", 50);
    series.getDataPoints().addDataPointForFunnelSeries(valueCell);
    valueCell = workbook.getCell(0, "B2", 100);
    series.getDataPoints().addDataPointForFunnelSeries(valueCell);
    valueCell = workbook.getCell(0, "B3", 200);
    series.getDataPoints().addDataPointForFunnelSeries(valueCell);
    valueCell = workbook.getCell(0, "B4", 300);
    series.getDataPoints().addDataPointForFunnelSeries(valueCell);
    valueCell = workbook.getCell(0, "B5", 400);
    series.getDataPoints().addDataPointForFunnelSeries(valueCell);
    valueCell = workbook.getCell(0, "B6", 500);
    series.getDataPoints().addDataPointForFunnelSeries(valueCell);

    presentation.save("Funnel.pptx", SaveFormat.Pptx);
}
finally
{
    presentation.dispose();
}
El resultado:
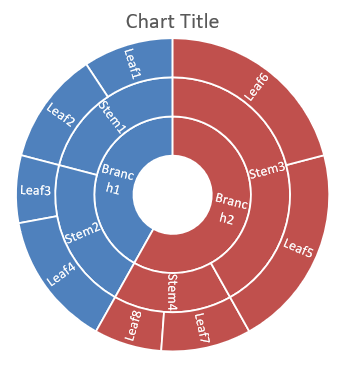
Crear gráficos de explosión radial
Los gráficos de explosión radial se utilizan para visualizar datos jerárquicos, mostrando los niveles como anillos concéntricos. Ayudan a ilustrar relaciones parte‑todo y son ideales para representar categorías anidadas y subcategorías de forma clara y compacta.
Este ejemplo crea un gráfico de explosión radial con ocho hojas agrupadas en cuatro troncos y dos ramificaciones. El método setGroupingItem asigna troncos en el nivel de agrupación 1 y ramificaciones en el nivel 2. Las etiquetas de categoría identifican los segmentos y los valores determinan su tamaño relativo.
import com.aspose.slides.*;

Presentation presentation = new Presentation();
try
{
    ISlide slide = presentation.getSlides().get_Item(0);

    IChart chart = slide.getShapes().addChart(ChartType.Sunburst, 20, 20, 500, 300);

    chart.getChartData().getCategories().clear();
    chart.getChartData().getSeries().clear();

    IChartDataWorkbook workbook = chart.getChartData().getChartDataWorkbook();
    workbook.clear(0);

    // Rama 1
    IChartDataCell categoryCell = workbook.getCell(0, "C1", "Leaf1");
    IChartCategory leaf = chart.getChartData().getCategories().add(categoryCell);
    leaf.getGroupingLevels().setGroupingItem(1, "Stem1");
    leaf.getGroupingLevels().setGroupingItem(2, "Branch1");

    categoryCell = workbook.getCell(0, "C2", "Leaf2");
    chart.getChartData().getCategories().add(categoryCell);

    categoryCell = workbook.getCell(0, "C3", "Leaf3");
    leaf = chart.getChartData().getCategories().add(categoryCell);
    leaf.getGroupingLevels().setGroupingItem(1, "Stem2");

    categoryCell = workbook.getCell(0, "C4", "Leaf4");
    chart.getChartData().getCategories().add(categoryCell);

    // Rama 2
    categoryCell = workbook.getCell(0, "C5", "Leaf5");
    leaf = chart.getChartData().getCategories().add(categoryCell);
    leaf.getGroupingLevels().setGroupingItem(1, "Stem3");
    leaf.getGroupingLevels().setGroupingItem(2, "Branch2");

    categoryCell = workbook.getCell(0, "C6", "Leaf6");
    chart.getChartData().getCategories().add(categoryCell);

    categoryCell = workbook.getCell(0, "C7", "Leaf7");
    leaf = chart.getChartData().getCategories().add(categoryCell);
    leaf.getGroupingLevels().setGroupingItem(1, "Stem4");

    categoryCell = workbook.getCell(0, "C8", "Leaf8");
    chart.getChartData().getCategories().add(categoryCell);

    IChartSeries series = chart.getChartData().getSeries().add(ChartType.Sunburst);
    series.getLabels().getDefaultDataLabelFormat().setShowCategoryName(true);
    IChartDataCell valueCell = workbook.getCell(0, "D1", 4);
    series.getDataPoints().addDataPointForSunburstSeries(valueCell);
    valueCell = workbook.getCell(0, "D2", 5);
    series.getDataPoints().addDataPointForSunburstSeries(valueCell);
    valueCell = workbook.getCell(0, "D3", 3);
    series.getDataPoints().addDataPointForSunburstSeries(valueCell);
    valueCell = workbook.getCell(0, "D4", 6);
    series.getDataPoints().addDataPointForSunburstSeries(valueCell);
    valueCell = workbook.getCell(0, "D5", 9);
    series.getDataPoints().addDataPointForSunburstSeries(valueCell);
    valueCell = workbook.getCell(0, "D6", 9);
    series.getDataPoints().addDataPointForSunburstSeries(valueCell);
    valueCell = workbook.getCell(0, "D7", 4);
    series.getDataPoints().addDataPointForSunburstSeries(valueCell);
    valueCell = workbook.getCell(0, "D8", 3);
    series.getDataPoints().addDataPointForSunburstSeries(valueCell);

    presentation.save("Sunburst.pptx", SaveFormat.Pptx);
}
finally
{
    presentation.dispose();
}
El resultado:
Crear gráficos de histograma
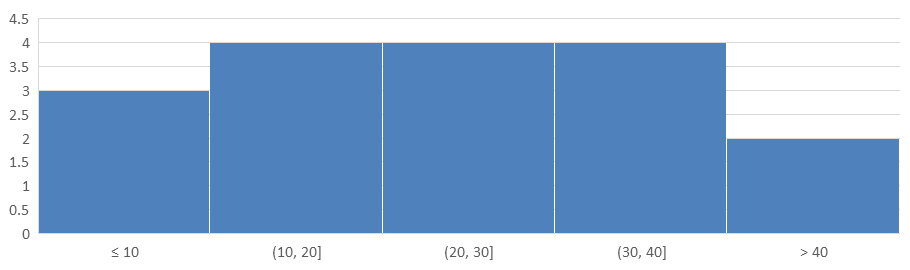
Los gráficos de histograma muestran cómo los valores numéricos se distribuyen en intervalos (cajas). Para informes mensuales sobre tiempos de procesamiento de pedidos, use el mismo ancho de caja y umbrales para mantener los intervalos consistentes y facilitar la comparación de distribuciones.
Llame a setAggregationType en el eje horizontal con un modo de AxisAggregationType. setBinWidth se aplica solo a ByBinWidth; setNumberOfBins se aplica solo a ByNumberOfBins. Use Automatic para que el gráfico elija las cajas.
Usar un ancho de caja fijo
Este ejemplo agrupa los tiempos de procesamiento en intervalos de 10 minutos, con cajas separadas para tiempos iguales o inferiores a 10 minutos y superiores a 40 minutos. Habilite estas cajas con setUnderflowBin y setOverflowBin. Al proporcionar umbrales explícitos mediante setUnderflowBin y setOverflowBin, llame a setAutomaticUnderflowBin y setAutomaticOverflowBin con false.
import com.aspose.slides.*;

Presentation presentation = new Presentation();
try
{
    ISlide slide = presentation.getSlides().get_Item(0);

    IChart chart = slide.getShapes().addChart(ChartType.Histogram, 20, 20, 680, 200);

    chart.setLegend(false);
    chart.setTitle(false);

    chart.getChartData().getCategories().clear();
    chart.getChartData().getSeries().clear();

    IChartDataWorkbook workbook = chart.getChartData().getChartDataWorkbook();
    workbook.clear(0);

    IChartSeries series = chart.getChartData().getSeries().add(ChartType.Histogram);
    double[] values = { 5, 10, 10, 11, 15, 20, 20, 21, 25, 30, 30, 31, 35, 40, 40, 41, 50 };
    for (int i = 0; i < values.length; i++)
    {
        IChartDataCell valueCell = workbook.getCell(0, i, 0, values[i]);
        series.getDataPoints().addDataPointForHistogramSeries(valueCell);
    }

    IAxis axis = chart.getAxes().getHorizontalAxis();
    axis.setAggregationType(AxisAggregationType.ByBinWidth);
    axis.setBinWidth(10);
    axis.setUnderflowBin(true);
    axis.setAutomaticUnderflowBin(false);
    axis.setUnderflowBin(10);
    axis.setOverflowBin(true);
    axis.setAutomaticOverflowBin(false);
    axis.setOverflowBin(40);

    presentation.save("Histogram-bin-width.pptx", SaveFormat.Pptx);
}
finally
{
    presentation.dispose();
}
La presentación mostrada en PowerPoint indica recuentos de cajas de 3, 4, 4, 4 y 2. La caja de subflujo incluye 5, 10, 10, por lo que su umbral es inclusivo. La caja de desbordamiento incluye solo 41, 50, por lo que su umbral es exclusivo; ambos valores iguales a 40 permanecen en el intervalo anterior. Las cajas intermedias contienen valores mayores que su límite inferior y menores o iguales que su límite superior.
Especificar el número de cajas
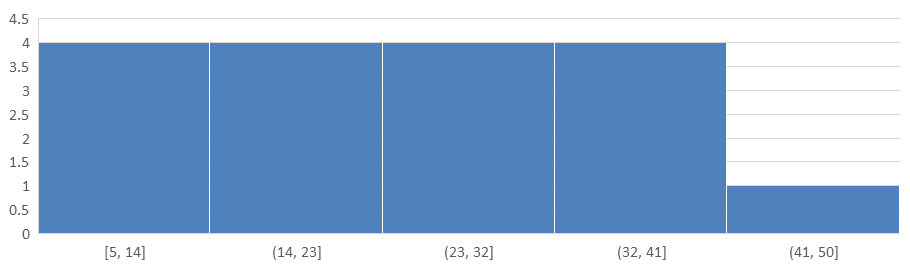
Para un nivel de detalle fijo en lugar de intervalos fijos, solicite cinco cajas para los mismos datos. Este ejemplo deja las cajas de subflujo y desbordamiento desactivadas. El gráfico determina el ancho a partir del rango de datos, por lo que los límites pueden cambiar entre informes.
import com.aspose.slides.*;

Presentation presentation = new Presentation();
try
{
    ISlide slide = presentation.getSlides().get_Item(0);

    IChart chart = slide.getShapes().addChart(ChartType.Histogram, 20, 20, 680, 200);

    chart.setLegend(false);
    chart.setTitle(false);

    chart.getChartData().getCategories().clear();
    chart.getChartData().getSeries().clear();

    IChartDataWorkbook workbook = chart.getChartData().getChartDataWorkbook();
    workbook.clear(0);

    IChartSeries series = chart.getChartData().getSeries().add(ChartType.Histogram);
    double[] values = { 5, 10, 10, 11, 15, 20, 20, 21, 25, 30, 30, 31, 35, 40, 40, 41, 50 };
    for (int i = 0; i < values.length; i++)
    {
        IChartDataCell valueCell = workbook.getCell(0, i, 0, values[i]);
        series.getDataPoints().addDataPointForHistogramSeries(valueCell);
    }

    IAxis axis = chart.getAxes().getHorizontalAxis();
    axis.setAggregationType(AxisAggregationType.ByNumberOfBins);
    axis.setNumberOfBins(5);

    presentation.save("Histogram-bin-count.pptx", SaveFormat.Pptx);
}
finally
{
    presentation.dispose();
}
Las cinco cajas tienen recuentos de 4, 4, 4, 4 y 1. Compare esta distribución con el resultado de ancho fijo anterior: los valores de entrada son idénticos, pero los límites difieren.
Crear gráficos de radar
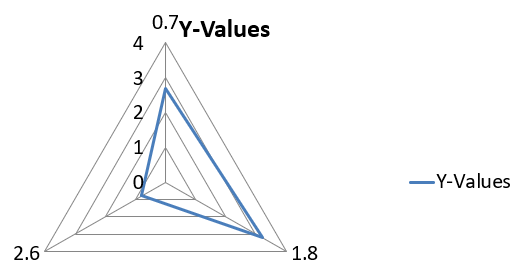
Los gráficos de radar se utilizan para mostrar datos multivariantes en un formato bidimensional, permitiendo comparar fácilmente varias variables simultáneamente. Son particularmente útiles para identificar patrones, fortalezas y debilidades en múltiples métricas o atributos de rendimiento.
Este ejemplo usa addChart para crear un gráfico de radar con series y categorías predeterminadas, y luego guarda la presentación como PPTX.
import com.aspose.slides.*;

Presentation presentation = new Presentation();
try
{
    ISlide slide = presentation.getSlides().get_Item(0);

    slide.getShapes().addChart(ChartType.Radar, 20, 20, 500, 300);

    presentation.save("Radar-chart.pptx", SaveFormat.Pptx);
}
finally
{
    presentation.dispose();
}
El resultado:
Crear gráficos de varias categorías
Los gráficos de varias categorías se utilizan para mostrar datos que implican más de una agrupación categórica, permitiendo comparar valores a través de múltiples dimensiones simultáneamente. Son especialmente útiles cuando necesita analizar tendencias y relaciones dentro de conjuntos de datos complejos y de varias capas.
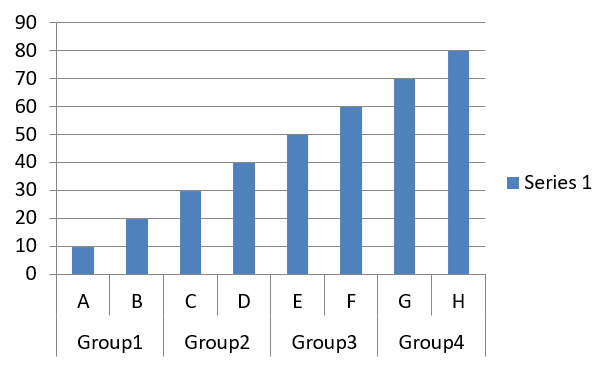
Este ejemplo crea un gráfico de columnas agrupadas con ocho categorías distribuidas en cuatro pares. El método setGroupingItem asigna a cada par una etiqueta compartida en el nivel de agrupación 1, produciendo un eje de categorías con etiquetas tanto individuales como de grupo.
import com.aspose.slides.*;

Presentation presentation = new Presentation();
try
{
    ISlide slide = presentation.getSlides().get_Item(0);

    IChart chart = slide.getShapes().addChart(ChartType.ClusteredColumn, 20, 20, 500, 300);

    chart.getChartData().getSeries().clear();
    chart.getChartData().getCategories().clear();

    IChartDataWorkbook workbook = chart.getChartData().getChartDataWorkbook();
    workbook.clear(0);

    int worksheetIndex = 0;

    IChartDataCell categoryCell = workbook.getCell(0, "c2", "A");
    IChartCategory category = chart.getChartData().getCategories().add(categoryCell);
    category.getGroupingLevels().setGroupingItem(1, "Group1");
    categoryCell = workbook.getCell(0, "c3", "B");
    category = chart.getChartData().getCategories().add(categoryCell);

    categoryCell = workbook.getCell(0, "c4", "C");
    category = chart.getChartData().getCategories().add(categoryCell);
    category.getGroupingLevels().setGroupingItem(1, "Group2");
    categoryCell = workbook.getCell(0, "c5", "D");
    category = chart.getChartData().getCategories().add(categoryCell);

    categoryCell = workbook.getCell(0, "c6", "E");
    category = chart.getChartData().getCategories().add(categoryCell);
    category.getGroupingLevels().setGroupingItem(1, "Group3");
    categoryCell = workbook.getCell(0, "c7", "F");
    category = chart.getChartData().getCategories().add(categoryCell);

    categoryCell = workbook.getCell(0, "c8", "G");
    category = chart.getChartData().getCategories().add(categoryCell);
    category.getGroupingLevels().setGroupingItem(1, "Group4");
    categoryCell = workbook.getCell(0, "c9", "H");
    category = chart.getChartData().getCategories().add(categoryCell);

    IChartDataCell seriesNameCell = workbook.getCell(0, "D1", "Series 1");
    IChartSeries series = chart.getChartData().getSeries().add(seriesNameCell, ChartType.ClusteredColumn);

    IChartDataCell valueCell = workbook.getCell(worksheetIndex, "D2", 10);
    series.getDataPoints().addDataPointForBarSeries(valueCell);
    valueCell = workbook.getCell(worksheetIndex, "D3", 20);
    series.getDataPoints().addDataPointForBarSeries(valueCell);
    valueCell = workbook.getCell(worksheetIndex, "D4", 30);
    series.getDataPoints().addDataPointForBarSeries(valueCell);
    valueCell = workbook.getCell(worksheetIndex, "D5", 40);
    series.getDataPoints().addDataPointForBarSeries(valueCell);
    valueCell = workbook.getCell(worksheetIndex, "D6", 50);
    series.getDataPoints().addDataPointForBarSeries(valueCell);
    valueCell = workbook.getCell(worksheetIndex, "D7", 60);
    series.getDataPoints().addDataPointForBarSeries(valueCell);
    valueCell = workbook.getCell(worksheetIndex, "D8", 70);
    series.getDataPoints().addDataPointForBarSeries(valueCell);
    valueCell = workbook.getCell(worksheetIndex, "D9", 80);
    series.getDataPoints().addDataPointForBarSeries(valueCell);

    presentation.save("AsposeChart.pptx", SaveFormat.Pptx);
}
finally
{
    presentation.dispose();
}
El resultado:
Crear gráficos de mapa
Los gráficos de mapa se utilizan para visualizar datos geográficos asignando información a ubicaciones específicas como países, estados o ciudades. Son particularmente útiles para analizar tendencias regionales, datos demográficos y distribuciones espaciales de forma clara y visualmente atractiva.
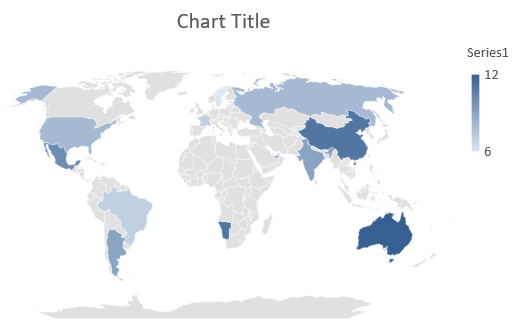
Este ejemplo usa addChart para crear un gráfico de mapa con los datos geográficos predeterminados y lo guarda para su visualización en PowerPoint.
import com.aspose.slides.*;

Presentation presentation = new Presentation();
try
{
    ISlide slide = presentation.getSlides().get_Item(0);

    IChart chart = slide.getShapes().addChart(ChartType.Map, 20, 20, 500, 300);

    presentation.save("mapChart.pptx", SaveFormat.Pptx);
}
finally
{
    presentation.dispose();
}
El resultado:
Note
La imagen anterior muestra la presentación guardada abierta en PowerPoint. Aspose.Slides escribe el gráfico de mapa y sus datos correctamente, pero no dibuja los gráficos de mapa por sí mismo: cuando una diapositiva que contiene uno se renderiza a una imagen o se convierte a PDF o SVG, el área del gráfico queda en blanco. Otras formas en la misma diapositiva no se ven afectadas.Crear gráficos combinados
Un gráfico combinado (o gráfico combo) combina dos o más tipos de gráficos en un solo diagrama. Este gráfico le permite resaltar, comparar o examinar diferencias entre dos o más conjuntos de datos, ayudándole a identificar relaciones entre ellos.

Este ejemplo combina dos series de columnas agrupadas con una serie de líneas a través de cuatro categorías. Las columnas usan el eje vertical primario, mientras que setPlotOnSecondAxis coloca la línea en un eje vertical secundario a la derecha. Las funciones auxiliares configuran el título, la leyenda, las etiquetas de los ejes y las líneas de cuadrícula.
import com.aspose.slides.*;
import android.graphics.Color;

class ComboChartExample
{
    void createComboChart()
    {
        Presentation presentation = new Presentation();
        try
        {
            IChart chart = createChartWithFirstSeries(presentation.getSlides().get_Item(0));

            addSecondSeriesToChart(chart);
            addThirdSeriesToChart(chart);

            setPrimaryAxesFormat(chart);
            setSecondaryAxesFormat(chart);

            presentation.save("combo-chart.pptx", SaveFormat.Pptx);
        }
        finally
        {
            presentation.dispose();
        }
    }

    IChart createChartWithFirstSeries(ISlide slide)
    {
        IChart chart = slide.getShapes().addChart(ChartType.ClusteredColumn, 50, 50, 600, 400);

        chart.setTitle(true);
        chart.getChartTitle().addTextFrameForOverriding("Chart Title");
        chart.getChartTitle().setOverlay(false);
        IPortionFormat portionFormat = chart.getChartTitle().getTextFrameForOverriding().getParagraphs().get_Item(0).getParagraphFormat().getDefaultPortionFormat();
        portionFormat.setFontBold(NullableBool.False);
        portionFormat.setFontHeight(18f);

        chart.getLegend().setPosition(LegendPositionType.Bottom);
        chart.getLegend().getTextFormat().getPortionFormat().setFontHeight(12f);

        chart.getChartData().getSeries().clear();
        chart.getChartData().getCategories().clear();

        IChartDataWorkbook workbook = chart.getChartData().getChartDataWorkbook();
        int worksheetIndex = 0;

        IChartDataCell categoryCell = workbook.getCell(worksheetIndex, 1, 0, "Category 1");
        chart.getChartData().getCategories().add(categoryCell);
        categoryCell = workbook.getCell(worksheetIndex, 2, 0, "Category 2");
        chart.getChartData().getCategories().add(categoryCell);
        categoryCell = workbook.getCell(worksheetIndex, 3, 0, "Category 3");
        chart.getChartData().getCategories().add(categoryCell);
        categoryCell = workbook.getCell(worksheetIndex, 4, 0, "Category 4");
        chart.getChartData().getCategories().add(categoryCell);

        IChartDataCell seriesNameCell = workbook.getCell(worksheetIndex, 0, 1, "Series 1");
        IChartSeries series = chart.getChartData().getSeries().add(seriesNameCell, chart.getType());

        series.getParentSeriesGroup().setOverlap((byte) -25);
        series.getParentSeriesGroup().setGapWidth(220);

        IChartDataCell valueCell = workbook.getCell(worksheetIndex, 1, 1, 4.3);
        series.getDataPoints().addDataPointForBarSeries(valueCell);
        valueCell = workbook.getCell(worksheetIndex, 2, 1, 2.5);
        series.getDataPoints().addDataPointForBarSeries(valueCell);
        valueCell = workbook.getCell(worksheetIndex, 3, 1, 3.5);
        series.getDataPoints().addDataPointForBarSeries(valueCell);
        valueCell = workbook.getCell(worksheetIndex, 4, 1, 4.5);
        series.getDataPoints().addDataPointForBarSeries(valueCell);

        return chart;
    }

    void addSecondSeriesToChart(IChart chart)
    {
        IChartDataWorkbook workbook = chart.getChartData().getChartDataWorkbook();
        final int worksheetIndex = 0;

        IChartDataCell seriesNameCell = workbook.getCell(worksheetIndex, 0, 2, "Series 2");
        IChartSeries series = chart.getChartData().getSeries().add(seriesNameCell, ChartType.ClusteredColumn);

        series.getParentSeriesGroup().setOverlap((byte) -25);
        series.getParentSeriesGroup().setGapWidth(220);

        IChartDataCell valueCell = workbook.getCell(worksheetIndex, 1, 2, 2.4);
        series.getDataPoints().addDataPointForBarSeries(valueCell);
        valueCell = workbook.getCell(worksheetIndex, 2, 2, 4.4);
        series.getDataPoints().addDataPointForBarSeries(valueCell);
        valueCell = workbook.getCell(worksheetIndex, 3, 2, 1.8);
        series.getDataPoints().addDataPointForBarSeries(valueCell);
        valueCell = workbook.getCell(worksheetIndex, 4, 2, 2.8);
        series.getDataPoints().addDataPointForBarSeries(valueCell);
    }

    void addThirdSeriesToChart(IChart chart)
    {
        IChartDataWorkbook workbook = chart.getChartData().getChartDataWorkbook();
        final int worksheetIndex = 0;

        IChartDataCell seriesNameCell = workbook.getCell(worksheetIndex, 0, 3, "Series 3");
        IChartSeries series = chart.getChartData().getSeries().add(seriesNameCell, ChartType.Line);

        IChartDataCell valueCell = workbook.getCell(worksheetIndex, 1, 3, 2.0);
        series.getDataPoints().addDataPointForLineSeries(valueCell);
        valueCell = workbook.getCell(worksheetIndex, 2, 3, 2.0);
        series.getDataPoints().addDataPointForLineSeries(valueCell);
        valueCell = workbook.getCell(worksheetIndex, 3, 3, 3.0);
        series.getDataPoints().addDataPointForLineSeries(valueCell);
        valueCell = workbook.getCell(worksheetIndex, 4, 3, 5.0);
        series.getDataPoints().addDataPointForLineSeries(valueCell);

        series.setPlotOnSecondAxis(true);
    }

    void setPrimaryAxesFormat(IChart chart)
    {
        IAxis horizontalAxis = chart.getAxes().getHorizontalAxis();
        horizontalAxis.getTextFormat().getPortionFormat().setFontHeight(12f);
        horizontalAxis.getFormat().getLine().getFillFormat().setFillType(FillType.NoFill);

        setAxisTitle(horizontalAxis, "X Axis");

        IAxis verticalAxis = chart.getAxes().getVerticalAxis();
        verticalAxis.getTextFormat().getPortionFormat().setFontHeight(12f);
        verticalAxis.getFormat().getLine().getFillFormat().setFillType(FillType.NoFill);

        setAxisTitle(verticalAxis, "Y Axis 1");

        ILineFillFormat majorGridLinesFormat = verticalAxis.getMajorGridLinesFormat().getLine().getFillFormat();
        majorGridLinesFormat.setFillType(FillType.Solid);
        majorGridLinesFormat.getSolidFillColor().setColor(Color.rgb(217, 217, 217));
    }

    void setSecondaryAxesFormat(IChart chart)
    {
        IAxis secondaryHorizontalAxis = chart.getAxes().getSecondaryHorizontalAxis();
        secondaryHorizontalAxis.setPosition(AxisPositionType.Bottom);
        secondaryHorizontalAxis.setCrossType(CrossesType.Maximum);
        secondaryHorizontalAxis.setVisible(false);
        secondaryHorizontalAxis.getMajorGridLinesFormat().getLine().getFillFormat().setFillType(FillType.NoFill);
        secondaryHorizontalAxis.getMinorGridLinesFormat().getLine().getFillFormat().setFillType(FillType.NoFill);

        IAxis secondaryVerticalAxis = chart.getAxes().getSecondaryVerticalAxis();
        secondaryVerticalAxis.setPosition(AxisPositionType.Right);
        secondaryVerticalAxis.getTextFormat().getPortionFormat().setFontHeight(12f);
        secondaryVerticalAxis.getFormat().getLine().getFillFormat().setFillType(FillType.NoFill);
        secondaryVerticalAxis.getMajorGridLinesFormat().getLine().getFillFormat().setFillType(FillType.NoFill);
        secondaryVerticalAxis.getMinorGridLinesFormat().getLine().getFillFormat().setFillType(FillType.NoFill);

        setAxisTitle(secondaryVerticalAxis, "Y Axis 2");
    }

    void setAxisTitle(IAxis axis, String axisTitle)
    {
        axis.setTitle(true);
        axis.getTitle().setOverlay(false);
        IPortionFormat titlePortionFormat = axis.getTitle().addTextFrameForOverriding(axisTitle).getParagraphs().get_Item(0).getParagraphFormat().getDefaultPortionFormat();
        titlePortionFormat.setFontBold(NullableBool.False);
        titlePortionFormat.setFontHeight(12f);
    }
}

ComboChartExample example = new ComboChartExample();
example.createComboChart();
Actualizar gráficos
Aspose.Slides para Android mediante Java le permite actualizar gráficos de PowerPoint modificando los datos del gráfico, el formato y el estilo. Esta funcionalidad simplifica el proceso de mantener las presentaciones actualizadas con contenido dinámico y garantiza que los gráficos reflejen con precisión los datos actuales y los estándares visuales.
Este ejemplo actualiza el gráfico llamado “My chart” en la primera diapositiva de una presentación existente. Requiere dos series de columnas con tres puntos de datos cada una, con etiquetas de categoría en la columna A y nombres de serie en la primera fila de la primera hoja de cálculo. El ejemplo usa getCell para cambiar celdas del libro, actualiza los valores de las series, añade una tercera serie y cambia el gráfico a cilindros agrupados mediante setType.
import com.aspose.slides.*;

final String chartName = "My chart";

Presentation presentation = new Presentation("ExistingChart.pptx");
try
{
    ISlide slide = presentation.getSlides().get_Item(0);

    for (IShape shape : slide.getShapes())
    {
        if (shape instanceof IChart && chartName.equals(shape.getName()))
        {
            IChart chart = (IChart) shape;
            int worksheetIndex = 0;

            IChartDataWorkbook workbook = chart.getChartData().getChartDataWorkbook();

            workbook.getCell(worksheetIndex, 1, 0, "Modified Category 1");
            workbook.getCell(worksheetIndex, 2, 0, "Modified Category 2");

            IChartSeries series = chart.getChartData().getSeries().get_Item(0);

            workbook.getCell(worksheetIndex, 0, 1, "New_Series 1");
            series.getDataPoints().get_Item(0).getValue().setData(90);
            series.getDataPoints().get_Item(1).getValue().setData(123);
            series.getDataPoints().get_Item(2).getValue().setData(44);

            series = chart.getChartData().getSeries().get_Item(1);

            workbook.getCell(worksheetIndex, 0, 2, "New_Series 2");
            series.getDataPoints().get_Item(0).getValue().setData(23);
            series.getDataPoints().get_Item(1).getValue().setData(67);
            series.getDataPoints().get_Item(2).getValue().setData(99);

            IChartDataCell seriesNameCell = workbook.getCell(worksheetIndex, 0, 3, "Series 3");
            series = chart.getChartData().getSeries().add(seriesNameCell, chart.getType());

            IChartDataCell valueCell = workbook.getCell(worksheetIndex, 1, 3, 20);
            series.getDataPoints().addDataPointForBarSeries(valueCell);
            valueCell = workbook.getCell(worksheetIndex, 2, 3, 50);
            series.getDataPoints().addDataPointForBarSeries(valueCell);
            valueCell = workbook.getCell(worksheetIndex, 3, 3, 30);
            series.getDataPoints().addDataPointForBarSeries(valueCell);

            chart.setType(ChartType.ClusteredCylinder);
        }
    }

    presentation.save("AsposeChartModified.pptx", SaveFormat.Pptx);
}
finally
{
    presentation.dispose();
}
Definir el rango de datos para un gráfico
Para inspeccionar el rango ya usado por un gráfico existente, consulte Retrieve a Chart’s Data Range.
Aspose.Slides para Android mediante Java ofrece la flexibilidad de definir un rango de datos específico de una hoja de cálculo como origen para los datos de su gráfico. Esto significa que puede mapear directamente una parte de su hoja de cálculo al gráfico, controlando qué celdas contribuyen a las series y categorías del gráfico. Como resultado, puede actualizar y sincronizar sus gráficos fácilmente con los últimos cambios de datos en su hoja, asegurando que sus presentaciones de PowerPoint reflejen información actual y precisa.
Este ejemplo usa setRange para establecer la fuente de datos del gráfico llamado “My chart” en la primera diapositiva de una presentación existente a Sheet1!A1:B4. El libro del gráfico debe contener esa hoja y un rango poblado con un encabezado de serie en la primera fila, etiquetas de categoría en la columna A y tres valores en la columna B.
import com.aspose.slides.*;

final String chartName = "My chart";

Presentation presentation = new Presentation("ExistingChart.pptx");
try
{
    ISlide slide = presentation.getSlides().get_Item(0);

    for (IShape shape : slide.getShapes())
    {
        if (shape instanceof IChart && chartName.equals(shape.getName()))
        {
            IChart chart = (IChart) shape;
            chart.getChartData().setRange("Sheet1!A1:B4");
        }
    }

    presentation.save("SetDataRange.pptx", SaveFormat.Pptx);
}
finally
{
    presentation.dispose();
}
Usar marcadores predeterminados en los gráficos
Cuando utiliza marcadores predeterminados en los gráficos, a cada serie del gráfico se asigna automáticamente un símbolo de marcador predeterminado diferente.
Este ejemplo usa addChart para crear un gráfico con dos series de líneas y una leyenda. La configuración de marcadores accedida mediante getMarker conserva los símbolos de marcador asignados automáticamente. La primera serie incluye un valor negativo y un valor ausente, representado por null, mientras que la segunda tiene un valor para cada categoría.
import com.aspose.slides.*;

Presentation presentation = new Presentation();
try
{
    ISlide slide = presentation.getSlides().get_Item(0);

    IChart chart = slide.getShapes().addChart(ChartType.LineWithMarkers, 10, 10, 400, 400);

    chart.getChartData().getSeries().clear();
    chart.getChartData().getCategories().clear();

    IChartDataWorkbook workbook = chart.getChartData().getChartDataWorkbook();

    IChartDataCell seriesNameCell = workbook.getCell(0, 0, 1, "Series 1");
    IChartSeries series = chart.getChartData().getSeries().add(seriesNameCell, chart.getType());

    IChartDataCell categoryCell = workbook.getCell(0, 1, 0, "C1");
    chart.getChartData().getCategories().add(categoryCell);
    IChartDataCell valueCell = workbook.getCell(0, 1, 1, 24);
    series.getDataPoints().addDataPointForLineSeries(valueCell);

    categoryCell = workbook.getCell(0, 2, 0, "C2");
    chart.getChartData().getCategories().add(categoryCell);
    valueCell = workbook.getCell(0, 2, 1, 23);
    series.getDataPoints().addDataPointForLineSeries(valueCell);

    categoryCell = workbook.getCell(0, 3, 0, "C3");
    chart.getChartData().getCategories().add(categoryCell);
    valueCell = workbook.getCell(0, 3, 1, -10);
    series.getDataPoints().addDataPointForLineSeries(valueCell);

    categoryCell = workbook.getCell(0, 4, 0, "C4");
    chart.getChartData().getCategories().add(categoryCell);
    valueCell = workbook.getCell(0, 4, 1, null);
    series.getDataPoints().addDataPointForLineSeries(valueCell);

    seriesNameCell = workbook.getCell(0, 0, 2, "Series 2");
    IChartSeries secondSeries = chart.getChartData().getSeries().add(seriesNameCell, chart.getType());

    valueCell = workbook.getCell(0, 1, 2, 30);
    secondSeries.getDataPoints().addDataPointForLineSeries(valueCell);
    valueCell = workbook.getCell(0, 2, 2, 10);
    secondSeries.getDataPoints().addDataPointForLineSeries(valueCell);
    valueCell = workbook.getCell(0, 3, 2, 60);
    secondSeries.getDataPoints().addDataPointForLineSeries(valueCell);
    valueCell = workbook.getCell(0, 4, 2, 40);
    secondSeries.getDataPoints().addDataPointForLineSeries(valueCell);

    chart.setLegend(true);
    chart.getLegend().setOverlay(false);

    presentation.save("DefaultMarkersInChart.pptx", SaveFormat.Pptx);
}
finally
{
    presentation.dispose();
}
Preguntas frecuentes
¿Qué tipos de gráficos son compatibles con Aspose.Slides para Android mediante Java?
Aspose.Slides para Android mediante Java admite una amplia gama de tipos de gráficos, incluidos barra, línea, pastel, área, dispersión, histograma, radar y muchos más. Esta flexibilidad le permite elegir el tipo de gráfico más apropiado para sus necesidades de visualización de datos.
¿Cómo añado un nuevo gráfico a una diapositiva?
Para añadir un gráfico, primero crea una instancia de la clase Presentation, obtiene la diapositiva deseada mediante su índice y luego llama al método para añadir un gráfico, especificando el tipo de gráfico y los datos iniciales. Este proceso integra el gráfico directamente en su presentación.
¿Cómo puedo actualizar los datos mostrados en un gráfico?
Puede actualizar los datos de un gráfico accediendo a su libro de datos (IChartDataWorkbook), eliminando cualquier serie y categoría predeterminadas, y luego añadiendo sus datos personalizados. Esto le permite refrescar programáticamente el gráfico para reflejar los datos más recientes.
¿Es posible personalizar la apariencia del gráfico?
Sí, Aspose.Slides para Android mediante Java ofrece amplias opciones de personalización. Puede modificar colores, fuentes, etiquetas, leyendas y otros elementos de formato para adaptar la apariencia del gráfico a sus requisitos de diseño específicos.