
PowerPoint prezentációk diagramjainak létrehozása vagy frissítése C++-ban
Áttekintés
Ez a cikk átfogó útmutatót nyújt a diagramok létrehozásához és testreszabásához az Aspose.Slides for C++ használatával. Megtanulja, hogyan adhat programozottan diagramot egy diára, töltse fel adatokkal, és alkalmazzon különféle formázási lehetőségeket a tervezési követelményeknek megfelelően. A cikkben részletes kódrészletek illusztrálják minden lépést, a prezentáció és a diagramobjektum inicializálásától a sorok, tengelyek és jelmagyarázatok konfigurálásáig. Az útmutató követésével alaposan megértheti, hogyan integrálhatja a dinamikus diagramgenerálást C++ alkalmazásaiba, egyszerűsítve az adatvezérelt prezentációk létrehozását.
Diagram létrehozása
A diagramok segítenek az embereknek gyorsan megjeleníteni az adatokat és felismerni azokat a meglátásokat, amelyek egy táblázatból vagy táblázatkezetből nem lennének azonnal nyilvánvalóak.
Miért kell diagramokat létrehozni?
A diagramok használatával:
- nagy mennyiségű adatot aggregálhat, tömöríthet vagy összefoglalhat egyetlen dián egy prezentációban;
- mintákat és trendeket tárhat fel az adatokban;
- meghatározhatja az adatok időbeli vagy egy adott mértékegységhez viszonyított irányát és lendületét;
- felismerheti az eltéréseket, anomáliákat, hibákat és értelmetlen adatokat;
- komplex adatokat kommunikálhat vagy bemutathat.
A PowerPointban a Insert (Beszúrás) funkcióval hozhat létre diagramokat, amely számos diagramtípus sablonját biztosítja. Az Aspose.Slides segítségével mind szabványos diagramokat (népszerű típusok alapján), mind egyedi diagramokat hozhat létre.
Note
Használja a ChartType felsorolást a Aspose::Slides::Charts névtérben. Ennek a felsorolásnak az értékei a különböző diagramtípusoknak felelnek meg.Csoportos oszlopdiagramok létrehozása
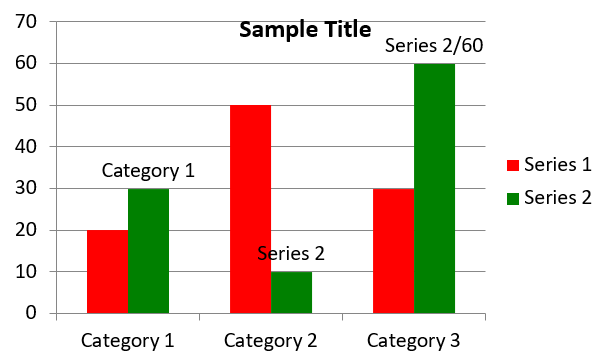
Ez a példa a AddChart metódust használja egy csoportos oszlopdiagram létrehozásához, amely két sorozatot hasonlít össze három kategóriában. A sorozatok piros és zöld kitöltést használnak, és az egyedi címkék a kategória nevét, a sorozat nevét és az értékeket mutatják. A 0. munkalap index az beágyazott diagrammunkafüzet első lapjára vonatkozik.
#include <system/shared_ptr.h>
#include <system/object_ext.h>
#include <system/string.h>
#include <drawing/color.h>
#include <DOM/Chart/ChartType.h>
#include <DOM/Chart/IChartCategoryCollection.h>
#include <DOM/Chart/IChartData.h>
#include <DOM/Chart/IChartDataCell.h>
#include <DOM/Chart/IChartDataPoint.h>
#include <DOM/Chart/IChartDataPointCollection.h>
#include <DOM/Chart/IChartDataWorkbook.h>
#include <DOM/Chart/IChartSeries.h>
#include <DOM/Chart/IChartSeriesCollection.h>
#include <DOM/Chart/IChartTitle.h>
#include <DOM/Chart/IDataLabel.h>
#include <DOM/Chart/IDataLabelCollection.h>
#include <DOM/Chart/IDataLabelFormat.h>
#include <DOM/Chart/IDoubleChartValue.h>
#include <DOM/Chart/IFormat.h>
#include <DOM/FillType.h>
#include <DOM/IChart.h>
#include <DOM/IColorFormat.h>
#include <DOM/IFillFormat.h>
#include <DOM/ILineFillFormat.h>
#include <DOM/ILineFormat.h>
#include <DOM/IShapeCollection.h>
#include <DOM/ISlide.h>
#include <DOM/ITextFrame.h>
#include <DOM/ITextFrameFormat.h>
#include <DOM/NullableBool.h>
#include <DOM/Presentation.h>
#include <Export/SaveFormat.h>

using namespace System;
using namespace System::Drawing;
using namespace Aspose::Slides;
using namespace Aspose::Slides::Charts;
using namespace Aspose::Slides::Export;

auto presentation = MakeObject<Presentation>();
auto slide = presentation->get_Slide(0);

auto chart = slide->get_Shapes()->AddChart(ChartType::ClusteredColumn, 20, 20, 500, 300);

chart->get_ChartTitle()->AddTextFrameForOverriding(u"Sample Title");
chart->get_ChartTitle()->get_TextFrameForOverriding()->get_TextFrameFormat()->set_CenterText(NullableBool::True);
chart->get_ChartTitle()->set_Height(20);
chart->set_HasTitle(true);

auto workbook = chart->get_ChartData()->get_ChartDataWorkbook();
auto worksheetIndex = 0;

chart->get_ChartData()->get_Series()->Clear();
chart->get_ChartData()->get_Categories()->Clear();

auto seriesNameCell = workbook->GetCell(worksheetIndex, 0, 1, ObjectExt::Box(String(u"Series 1")));
chart->get_ChartData()->get_Series()->Add(seriesNameCell, chart->get_Type());
seriesNameCell = workbook->GetCell(worksheetIndex, 0, 2, ObjectExt::Box(String(u"Series 2")));
chart->get_ChartData()->get_Series()->Add(seriesNameCell, chart->get_Type());

auto categoryCell = workbook->GetCell(worksheetIndex, 1, 0, ObjectExt::Box(String(u"Category 1")));
chart->get_ChartData()->get_Categories()->Add(categoryCell);
categoryCell = workbook->GetCell(worksheetIndex, 2, 0, ObjectExt::Box(String(u"Category 2")));
chart->get_ChartData()->get_Categories()->Add(categoryCell);
categoryCell = workbook->GetCell(worksheetIndex, 3, 0, ObjectExt::Box(String(u"Category 3")));
chart->get_ChartData()->get_Categories()->Add(categoryCell);

auto series = chart->get_ChartData()->get_Series()->idx_get(0);

auto valueCell = workbook->GetCell(worksheetIndex, 1, 1, ObjectExt::Box(20));
series->get_DataPoints()->AddDataPointForBarSeries(valueCell);
valueCell = workbook->GetCell(worksheetIndex, 2, 1, ObjectExt::Box(50));
series->get_DataPoints()->AddDataPointForBarSeries(valueCell);
valueCell = workbook->GetCell(worksheetIndex, 3, 1, ObjectExt::Box(30));
series->get_DataPoints()->AddDataPointForBarSeries(valueCell);

series->get_Format()->get_Fill()->set_FillType(FillType::Solid);
series->get_Format()->get_Fill()->get_SolidFillColor()->set_Color(Color::get_Red());

series = chart->get_ChartData()->get_Series()->idx_get(1);

valueCell = workbook->GetCell(worksheetIndex, 1, 2, ObjectExt::Box(30));
series->get_DataPoints()->AddDataPointForBarSeries(valueCell);
valueCell = workbook->GetCell(worksheetIndex, 2, 2, ObjectExt::Box(10));
series->get_DataPoints()->AddDataPointForBarSeries(valueCell);
valueCell = workbook->GetCell(worksheetIndex, 3, 2, ObjectExt::Box(60));
series->get_DataPoints()->AddDataPointForBarSeries(valueCell);

series->get_Format()->get_Fill()->set_FillType(FillType::Solid);
series->get_Format()->get_Fill()->get_SolidFillColor()->set_Color(Color::get_Green());

auto label = series->get_DataPoints()->idx_get(0)->get_Label();
label->get_DataLabelFormat()->set_ShowCategoryName(true);

label = series->get_DataPoints()->idx_get(1)->get_Label();
label->get_DataLabelFormat()->set_ShowSeriesName(true);

label = series->get_DataPoints()->idx_get(2)->get_Label();
label->get_DataLabelFormat()->set_ShowValue(true);
label->get_DataLabelFormat()->set_ShowSeriesName(true);
label->get_DataLabelFormat()->set_Separator(u"/");

presentation->Save(u"AsposeChart.pptx", SaveFormat::Pptx);
Az eredmény:
Pontdiagramok létrehozása
A pontdiagramok (más néven szórási diagramok vagy x‑y grafikonok) gyakran használatosak minták keresésére vagy két változó közötti korreláció bemutatására.
Használjon pontdiagramot, ha:
- páros numerikus adatai vannak;
- két változó jól párosítható egymással;
- meg szeretné határozni, hogy a két változó összefügg-e;
- van egy független változó, amelynek több értéke van egy függő változóhoz.
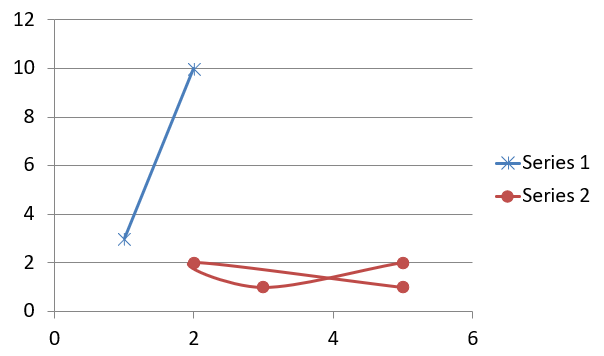
Ez a példa két x‑y értékkészletet ábrázol. Az első sorozat egyenes vonalakat és csillagjelzőket használ, míg a második sima vonalakat és körjelzőket; mindkettő 10-es jelzőmérettel rendelkezik, amely a set_Size metódussal van beállítva. A set_Symbol metódus szabályozza a jelző alakját.
#include <system/shared_ptr.h>
#include <system/object_ext.h>
#include <system/string.h>
#include <DOM/Chart/ChartType.h>
#include <DOM/Chart/IChartCategoryCollection.h>
#include <DOM/Chart/IChartData.h>
#include <DOM/Chart/IChartDataCell.h>
#include <DOM/Chart/IChartDataPoint.h>
#include <DOM/Chart/IChartDataPointCollection.h>
#include <DOM/Chart/IChartDataWorkbook.h>
#include <DOM/Chart/IChartSeries.h>
#include <DOM/Chart/IChartSeriesCollection.h>
#include <DOM/Chart/IDoubleChartValue.h>
#include <DOM/Chart/IFormat.h>
#include <DOM/Chart/IMarker.h>
#include <DOM/Chart/MarkerStyleType.h>
#include <DOM/IChart.h>
#include <DOM/IColorFormat.h>
#include <DOM/IFillFormat.h>
#include <DOM/ILineFillFormat.h>
#include <DOM/ILineFormat.h>
#include <DOM/IShapeCollection.h>
#include <DOM/ISlide.h>
#include <DOM/Presentation.h>
#include <Export/SaveFormat.h>

using namespace System;
using namespace Aspose::Slides;
using namespace Aspose::Slides::Charts;
using namespace Aspose::Slides::Export;

auto presentation = MakeObject<Presentation>();
auto slide = presentation->get_Slide(0);

auto chart = slide->get_Shapes()->AddChart(ChartType::ScatterWithSmoothLines, 20, 20, 500, 300);

auto workbook = chart->get_ChartData()->get_ChartDataWorkbook();
auto worksheetIndex = 0;

chart->get_ChartData()->get_Series()->Clear();

auto seriesNameCell = workbook->GetCell(worksheetIndex, 1, 1, ObjectExt::Box(String(u"Series 1")));
chart->get_ChartData()->get_Series()->Add(seriesNameCell, chart->get_Type());
seriesNameCell = workbook->GetCell(worksheetIndex, 1, 3, ObjectExt::Box(String(u"Series 2")));
chart->get_ChartData()->get_Series()->Add(seriesNameCell, chart->get_Type());

auto series = chart->get_ChartData()->get_Series()->idx_get(0);

auto xValueCell = workbook->GetCell(worksheetIndex, 2, 1, ObjectExt::Box(1));
auto yValueCell = workbook->GetCell(worksheetIndex, 2, 2, ObjectExt::Box(3));
series->get_DataPoints()->AddDataPointForScatterSeries(xValueCell, yValueCell);

xValueCell = workbook->GetCell(worksheetIndex, 3, 1, ObjectExt::Box(2));
yValueCell = workbook->GetCell(worksheetIndex, 3, 2, ObjectExt::Box(10));
series->get_DataPoints()->AddDataPointForScatterSeries(xValueCell, yValueCell);

series->set_Type(ChartType::ScatterWithStraightLinesAndMarkers);

series->get_Marker()->set_Size(10);
series->get_Marker()->set_Symbol(MarkerStyleType::Star);

series = chart->get_ChartData()->get_Series()->idx_get(1);

xValueCell = workbook->GetCell(worksheetIndex, 2, 3, ObjectExt::Box(5));
yValueCell = workbook->GetCell(worksheetIndex, 2, 4, ObjectExt::Box(2));
series->get_DataPoints()->AddDataPointForScatterSeries(xValueCell, yValueCell);

xValueCell = workbook->GetCell(worksheetIndex, 3, 3, ObjectExt::Box(3));
yValueCell = workbook->GetCell(worksheetIndex, 3, 4, ObjectExt::Box(1));
series->get_DataPoints()->AddDataPointForScatterSeries(xValueCell, yValueCell);

xValueCell = workbook->GetCell(worksheetIndex, 4, 3, ObjectExt::Box(2));
yValueCell = workbook->GetCell(worksheetIndex, 4, 4, ObjectExt::Box(2));
series->get_DataPoints()->AddDataPointForScatterSeries(xValueCell, yValueCell);

xValueCell = workbook->GetCell(worksheetIndex, 5, 3, ObjectExt::Box(5));
yValueCell = workbook->GetCell(worksheetIndex, 5, 4, ObjectExt::Box(1));
series->get_DataPoints()->AddDataPointForScatterSeries(xValueCell, yValueCell);

series->get_Marker()->set_Size(10);
series->get_Marker()->set_Symbol(MarkerStyleType::Circle);

presentation->Save(u"AsposeChart.pptx", SaveFormat::Pptx);
Az eredmény:
Kördiagramok létrehozása
A kördiagramok leginkább a rész‑egész arányok bemutatására alkalmasak, különösen akkor, ha az adatok kategórikus címkéket és numerikus értékeket tartalmaznak. Ha azonban sok rész vagy címke van, érdemes oszlopdiagramot használni.
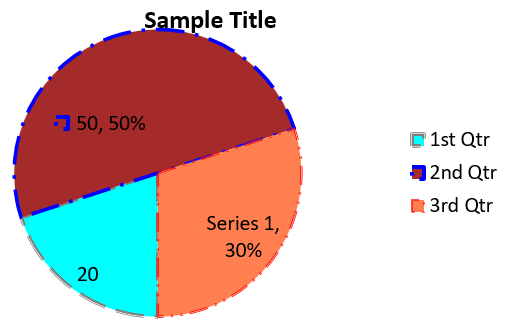
Ez a példa három negyedéves értékkel hoz létre egy kördiagramot. Minden szelet egyedi kitöltéssel és szegéllyel rendelkezik, a címkék pedig különböző kombinációkat mutatnak az értékek, százalékok és sorozatinformációk között. A set_FirstSliceAngle metódus az első szeletet 180 fokra állítja.
#include <system/shared_ptr.h>
#include <system/object_ext.h>
#include <system/string.h>
#include <drawing/color.h>
#include <DOM/Chart/ChartType.h>
#include <DOM/Chart/IChartCategoryCollection.h>
#include <DOM/Chart/IChartData.h>
#include <DOM/Chart/IChartDataCell.h>
#include <DOM/Chart/IChartDataPoint.h>
#include <DOM/Chart/IChartDataPointCollection.h>
#include <DOM/Chart/IChartDataWorkbook.h>
#include <DOM/Chart/IChartSeries.h>
#include <DOM/Chart/IChartSeriesCollection.h>
#include <DOM/Chart/IChartSeriesGroup.h>
#include <DOM/Chart/IChartSeriesGroupCollection.h>
#include <DOM/Chart/IChartTextFormat.h>
#include <DOM/Chart/IChartTitle.h>
#include <DOM/Chart/IDataLabel.h>
#include <DOM/Chart/IDataLabelCollection.h>
#include <DOM/Chart/IDataLabelFormat.h>
#include <DOM/Chart/IDoubleChartValue.h>
#include <DOM/Chart/IFormat.h>
#include <DOM/Chart/ILegend.h>
#include <DOM/FillType.h>
#include <DOM/IChart.h>
#include <DOM/IColorFormat.h>
#include <DOM/IFillFormat.h>
#include <DOM/ILineFillFormat.h>
#include <DOM/ILineFormat.h>
#include <DOM/IPortionFormat.h>
#include <DOM/IShapeCollection.h>
#include <DOM/ISlide.h>
#include <DOM/ITextFrame.h>
#include <DOM/ITextFrameFormat.h>
#include <DOM/LineDashStyle.h>
#include <DOM/LineStyle.h>
#include <DOM/NullableBool.h>
#include <DOM/Presentation.h>
#include <Export/SaveFormat.h>

using namespace System;
using namespace System::Drawing;
using namespace Aspose::Slides;
using namespace Aspose::Slides::Charts;
using namespace Aspose::Slides::Export;

auto presentation = MakeObject<Presentation>();
auto slide = presentation->get_Slide(0);

auto chart = slide->get_Shapes()->AddChart(ChartType::Pie, 20, 20, 500, 300);

chart->get_ChartTitle()->AddTextFrameForOverriding(u"Sample Title");
chart->get_ChartTitle()->get_TextFrameForOverriding()->get_TextFrameFormat()->set_CenterText(NullableBool::True);
chart->get_ChartTitle()->set_Height(20);
chart->set_HasTitle(true);

chart->get_ChartData()->get_Series()->idx_get(0)->get_Labels()->get_DefaultDataLabelFormat()->set_ShowValue(true);

auto workbook = chart->get_ChartData()->get_ChartDataWorkbook();
auto worksheetIndex = 0;

chart->get_ChartData()->get_Series()->Clear();
chart->get_ChartData()->get_Categories()->Clear();

auto categoryCell = workbook->GetCell(0, 1, 0, ObjectExt::Box(String(u"1st Qtr")));
chart->get_ChartData()->get_Categories()->Add(categoryCell);
categoryCell = workbook->GetCell(0, 2, 0, ObjectExt::Box(String(u"2nd Qtr")));
chart->get_ChartData()->get_Categories()->Add(categoryCell);
categoryCell = workbook->GetCell(0, 3, 0, ObjectExt::Box(String(u"3rd Qtr")));
chart->get_ChartData()->get_Categories()->Add(categoryCell);

auto seriesNameCell = workbook->GetCell(0, 0, 1, ObjectExt::Box(String(u"Series 1")));
auto series = chart->get_ChartData()->get_Series()->Add(seriesNameCell, chart->get_Type());

auto valueCell = workbook->GetCell(worksheetIndex, 1, 1, ObjectExt::Box(20));
series->get_DataPoints()->AddDataPointForPieSeries(valueCell);
valueCell = workbook->GetCell(worksheetIndex, 2, 1, ObjectExt::Box(50));
series->get_DataPoints()->AddDataPointForPieSeries(valueCell);
valueCell = workbook->GetCell(worksheetIndex, 3, 1, ObjectExt::Box(30));
series->get_DataPoints()->AddDataPointForPieSeries(valueCell);

chart->get_ChartData()->get_SeriesGroups()->idx_get(0)->set_IsColorVaried(true);

auto firstSlice = series->get_DataPoints()->idx_get(0);
firstSlice->get_Format()->get_Fill()->set_FillType(FillType::Solid);
firstSlice->get_Format()->get_Fill()->get_SolidFillColor()->set_Color(Color::get_Cyan());

firstSlice->get_Format()->get_Line()->get_FillFormat()->set_FillType(FillType::Solid);
firstSlice->get_Format()->get_Line()->get_FillFormat()->get_SolidFillColor()->set_Color(Color::get_Gray());
firstSlice->get_Format()->get_Line()->set_Width(3.0);
firstSlice->get_Format()->get_Line()->set_Style(LineStyle::ThinThick);
firstSlice->get_Format()->get_Line()->set_DashStyle(LineDashStyle::LargeDash);

auto secondSlice = series->get_DataPoints()->idx_get(1);
secondSlice->get_Format()->get_Fill()->set_FillType(FillType::Solid);
secondSlice->get_Format()->get_Fill()->get_SolidFillColor()->set_Color(Color::get_Brown());

secondSlice->get_Format()->get_Line()->get_FillFormat()->set_FillType(FillType::Solid);
secondSlice->get_Format()->get_Line()->get_FillFormat()->get_SolidFillColor()->set_Color(Color::get_Blue());
secondSlice->get_Format()->get_Line()->set_Width(3.0);
secondSlice->get_Format()->get_Line()->set_Style(LineStyle::Single);
secondSlice->get_Format()->get_Line()->set_DashStyle(LineDashStyle::LargeDashDot);

auto thirdSlice = series->get_DataPoints()->idx_get(2);
thirdSlice->get_Format()->get_Fill()->set_FillType(FillType::Solid);
thirdSlice->get_Format()->get_Fill()->get_SolidFillColor()->set_Color(Color::get_Coral());

thirdSlice->get_Format()->get_Line()->get_FillFormat()->set_FillType(FillType::Solid);
thirdSlice->get_Format()->get_Line()->get_FillFormat()->get_SolidFillColor()->set_Color(Color::get_Red());
thirdSlice->get_Format()->get_Line()->set_Width(2.0);
thirdSlice->get_Format()->get_Line()->set_Style(LineStyle::ThinThin);
thirdSlice->get_Format()->get_Line()->set_DashStyle(LineDashStyle::LargeDashDotDot);

auto firstLabel = series->get_DataPoints()->idx_get(0)->get_Label();
firstLabel->get_DataLabelFormat()->set_ShowValue(true);

auto secondLabel = series->get_DataPoints()->idx_get(1)->get_Label();
secondLabel->get_DataLabelFormat()->set_ShowValue(true);
secondLabel->get_DataLabelFormat()->set_ShowLegendKey(true);
secondLabel->get_DataLabelFormat()->set_ShowPercentage(true);

auto thirdLabel = series->get_DataPoints()->idx_get(2)->get_Label();
thirdLabel->get_DataLabelFormat()->set_ShowSeriesName(true);
thirdLabel->get_DataLabelFormat()->set_ShowPercentage(true);

series->get_Labels()->get_DefaultDataLabelFormat()->set_ShowLeaderLines(true);

chart->get_ChartData()->get_SeriesGroups()->idx_get(0)->set_FirstSliceAngle(180);

presentation->Save(u"PieChart.pptx", SaveFormat::Pptx);
Az eredmény:
Vonaldiagramok létrehozása
A vonaldiagramok (más néven vonalgrafikonok) leginkább olyan helyzetekben használandók, ahol az értékek időbeli változását szeretnénk bemutatni. Egy vonaldiagramból egyszerre nagy mennyiségű adatot hasonlíthatunk össze, nyomon követhetjük az időbeli változásokat és trendeket, kiemelhetjük az anomáliákat az adatcsoportokban, és így tovább.
Ez a példa a AddChart metódust használja egy vonaldiagram létrehozásához az alapértelmezett sorozatokkal és kategóriákkal, majd PPTX formátumban menti a prezentációt.
#include <system/shared_ptr.h>
#include <DOM/Chart/ChartType.h>
#include <DOM/Chart/IChartCategoryCollection.h>
#include <DOM/Chart/IChartData.h>
#include <DOM/Chart/IChartSeriesCollection.h>
#include <DOM/Chart/IFormat.h>
#include <DOM/IChart.h>
#include <DOM/IColorFormat.h>
#include <DOM/IFillFormat.h>
#include <DOM/ILineFillFormat.h>
#include <DOM/ILineFormat.h>
#include <DOM/IShapeCollection.h>
#include <DOM/ISlide.h>
#include <DOM/Presentation.h>
#include <Export/SaveFormat.h>

using namespace System;
using namespace Aspose::Slides;
using namespace Aspose::Slides::Charts;
using namespace Aspose::Slides::Export;

auto presentation = MakeObject<Presentation>();
auto slide = presentation->get_Slide(0);

auto lineChart = slide->get_Shapes()->AddChart(ChartType::Line, 20, 20, 500, 300);

presentation->Save(u"lineChart.pptx", SaveFormat::Pptx);
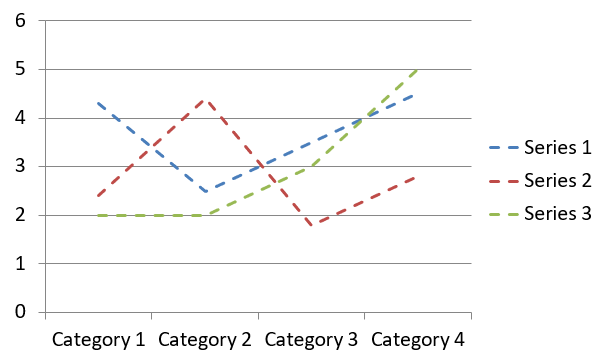
Alapértelmezés szerint a vonaldiagram pontjait egyenes, folytonos vonalak kötik össze. Ha pontokat szaggatott vonalakkal szeretne összekötni, hívja meg a set_DashStyle metódust a LineDashStyle egyik értékével:
#include <system/shared_ptr.h>
#include <DOM/Chart/ChartType.h>
#include <DOM/Chart/IChartCategoryCollection.h>
#include <DOM/Chart/IChartData.h>
#include <DOM/Chart/IChartSeries.h>
#include <DOM/Chart/IChartSeriesCollection.h>
#include <DOM/Chart/IFormat.h>
#include <DOM/IChart.h>
#include <DOM/IColorFormat.h>
#include <DOM/IFillFormat.h>
#include <DOM/ILineFillFormat.h>
#include <DOM/ILineFormat.h>
#include <DOM/IShapeCollection.h>
#include <DOM/ISlide.h>
#include <DOM/LineDashStyle.h>
#include <DOM/Presentation.h>

using namespace System;
using namespace Aspose::Slides;
using namespace Aspose::Slides::Charts;

auto presentation = MakeObject<Presentation>();
auto slide = presentation->get_Slide(0);

auto lineChart = slide->get_Shapes()->AddChart(ChartType::Line, 20, 20, 500, 300);

for (auto series : lineChart->get_ChartData()->get_Series())
{
    series->get_Format()->get_Line()->set_DashStyle(LineDashStyle::Dash);
}
Az eredmény:
Fa térkép diagramok létrehozása
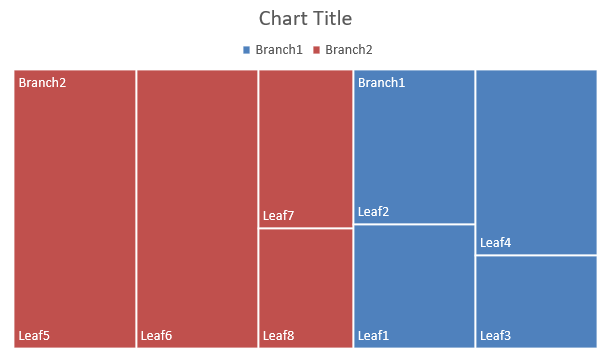
A fa térkép diagramok leginkább értékesítési adatok esetén használhatók, amikor a adatkategóriák relatív méretét szeretné megjeleníteni, és gyorsan felhívni a figyelmet az egyes kategóriák nagy hozzájáruló elemeire.
Ez a példa egy fa térképet hoz létre nyolc levéllel, amelyek négy szárra és két ágra csoportosulnak. A SetGroupingItem metódus az 1‑es szintű csoportosításnál a szárakat, a 2‑es szintnél pedig az ágakat rendeli. Az értékek határozzák meg a relatív téglalapméreteket, míg a kategória‑ és a szülőcímkék az hierarchiát jelzik.
#include <system/shared_ptr.h>
#include <system/object_ext.h>
#include <system/string.h>
#include <DOM/Chart/ChartType.h>
#include <DOM/Chart/IChartCategory.h>
#include <DOM/Chart/IChartCategoryCollection.h>
#include <DOM/Chart/IChartCategoryLevelsManager.h>
#include <DOM/Chart/IChartData.h>
#include <DOM/Chart/IChartDataCell.h>
#include <DOM/Chart/IChartDataPoint.h>
#include <DOM/Chart/IChartDataPointCollection.h>
#include <DOM/Chart/IChartDataWorkbook.h>
#include <DOM/Chart/IChartSeries.h>
#include <DOM/Chart/IChartSeriesCollection.h>
#include <DOM/Chart/IDataLabel.h>
#include <DOM/Chart/IDataLabelCollection.h>
#include <DOM/Chart/IDataLabelFormat.h>
#include <DOM/Chart/IFormat.h>
#include <DOM/Chart/ParentLabelLayoutType.h>
#include <DOM/IChart.h>
#include <DOM/IColorFormat.h>
#include <DOM/IFillFormat.h>
#include <DOM/ILineFillFormat.h>
#include <DOM/ILineFormat.h>
#include <DOM/IShapeCollection.h>
#include <DOM/ISlide.h>
#include <DOM/Presentation.h>
#include <Export/SaveFormat.h>

using namespace System;
using namespace Aspose::Slides;
using namespace Aspose::Slides::Charts;
using namespace Aspose::Slides::Export;

auto presentation = MakeObject<Presentation>();
auto slide = presentation->get_Slide(0);

auto chart = slide->get_Shapes()->AddChart(ChartType::Treemap, 20, 20, 500, 300);

chart->get_ChartData()->get_Categories()->Clear();
chart->get_ChartData()->get_Series()->Clear();

auto workbook = chart->get_ChartData()->get_ChartDataWorkbook();
workbook->Clear(0);

// Ág 1
auto categoryCell = workbook->GetCell(0, u"C1", ObjectExt::Box(String(u"Leaf1")));
auto leaf = chart->get_ChartData()->get_Categories()->Add(categoryCell);
leaf->get_GroupingLevels()->SetGroupingItem(1, ObjectExt::Box(String(u"Stem1")));
leaf->get_GroupingLevels()->SetGroupingItem(2, ObjectExt::Box(String(u"Branch1")));

categoryCell = workbook->GetCell(0, u"C2", ObjectExt::Box(String(u"Leaf2")));
chart->get_ChartData()->get_Categories()->Add(categoryCell);

categoryCell = workbook->GetCell(0, u"C3", ObjectExt::Box(String(u"Leaf3")));
leaf = chart->get_ChartData()->get_Categories()->Add(categoryCell);
leaf->get_GroupingLevels()->SetGroupingItem(1, ObjectExt::Box(String(u"Stem2")));

categoryCell = workbook->GetCell(0, u"C4", ObjectExt::Box(String(u"Leaf4")));
chart->get_ChartData()->get_Categories()->Add(categoryCell);

// Ág 2
categoryCell = workbook->GetCell(0, u"C5", ObjectExt::Box(String(u"Leaf5")));
leaf = chart->get_ChartData()->get_Categories()->Add(categoryCell);
leaf->get_GroupingLevels()->SetGroupingItem(1, ObjectExt::Box(String(u"Stem3")));
leaf->get_GroupingLevels()->SetGroupingItem(2, ObjectExt::Box(String(u"Branch2")));

categoryCell = workbook->GetCell(0, u"C6", ObjectExt::Box(String(u"Leaf6")));
chart->get_ChartData()->get_Categories()->Add(categoryCell);

categoryCell = workbook->GetCell(0, u"C7", ObjectExt::Box(String(u"Leaf7")));
leaf = chart->get_ChartData()->get_Categories()->Add(categoryCell);
leaf->get_GroupingLevels()->SetGroupingItem(1, ObjectExt::Box(String(u"Stem4")));

categoryCell = workbook->GetCell(0, u"C8", ObjectExt::Box(String(u"Leaf8")));
chart->get_ChartData()->get_Categories()->Add(categoryCell);

auto series = chart->get_ChartData()->get_Series()->Add(ChartType::Treemap);
series->get_Labels()->get_DefaultDataLabelFormat()->set_ShowCategoryName(true);
auto valueCell = workbook->GetCell(0, u"D1", ObjectExt::Box(4));
series->get_DataPoints()->AddDataPointForTreemapSeries(valueCell);
valueCell = workbook->GetCell(0, u"D2", ObjectExt::Box(5));
series->get_DataPoints()->AddDataPointForTreemapSeries(valueCell);
valueCell = workbook->GetCell(0, u"D3", ObjectExt::Box(3));
series->get_DataPoints()->AddDataPointForTreemapSeries(valueCell);
valueCell = workbook->GetCell(0, u"D4", ObjectExt::Box(6));
series->get_DataPoints()->AddDataPointForTreemapSeries(valueCell);
valueCell = workbook->GetCell(0, u"D5", ObjectExt::Box(9));
series->get_DataPoints()->AddDataPointForTreemapSeries(valueCell);
valueCell = workbook->GetCell(0, u"D6", ObjectExt::Box(9));
series->get_DataPoints()->AddDataPointForTreemapSeries(valueCell);
valueCell = workbook->GetCell(0, u"D7", ObjectExt::Box(4));
series->get_DataPoints()->AddDataPointForTreemapSeries(valueCell);
valueCell = workbook->GetCell(0, u"D8", ObjectExt::Box(3));
series->get_DataPoints()->AddDataPointForTreemapSeries(valueCell);

series->set_ParentLabelLayout(ParentLabelLayoutType::Overlapping);

presentation->Save(u"Treemap.pptx", SaveFormat::Pptx);
Az eredmény:
Vízözön diagramok létrehozása
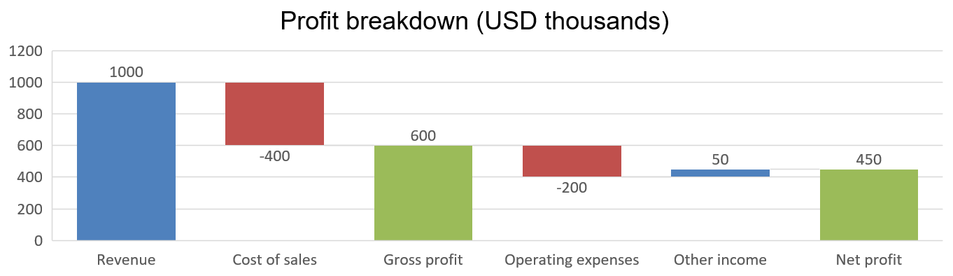
A vízözön diagram azt mutatja, hogy a pozitív és negatív változások hogyan járulnak hozzá a végső értékhez. Például egy nyereségtörés a bevételből indul, levonja a költségeket, majd hozzáadja a többi jövedelmet. A változásos oszlopok a korábbi és az új futó értékek között lebegnek, míg a teljes oszlopok a nullától a felhalmozott értékig terjednek.
Az alábbi példa ezredek amerikai dollárban kifejezett összegeket használja:
| Category | Workbook value | Column type |
|---|---|---|
| Revenue | 1000 | Increase |
| Cost of sales | -400 | Decrease |
| Gross profit | 600 | Intermediate total |
| Operating expenses | -200 | Decrease |
| Other income | 50 | Increase |
| Net profit | 450 | Final total |
Egy pontot közbenső vagy végső összegként megjelölni a set_SetAsTotal metódus true értékével kell hívni. A pont munkafüzet cellájában adja meg a tényleges felhalmozott összeget: 600 a bruttó nyereséghez (1000 - 400) és 450 a nettó nyereséghez (600 - 200 + 50). A metódus csak megjelöli az oszlopot összegként; nem számítja ki vagy tölti ki a cella értékét. Ne használjon nullát helyőrzőként, és ne adjon meg másik változást egy összegpontnál. A teljes oszlop a felhalmozott értéket jeleníti meg anélkül, hogy újból hozzáadná a futó értékhez.
Ez a teljes C++ példa a Waterfall tagot a ChartType enumerációból használja, törli az alapértelmezett adatokat, és feltölti a beágyazott munkafüzetet. A 0 indexű munkalap az első munkalapot választja; az A oszlop a kategórianéveket, a B oszlop az értékeket tartalmazza. Minden értékcellát a AddDataPointForWaterfallSeries metódussal adunk hozzá. A 0‑alapú pontindexek 2 és 5 a közbenső és a végső összegeket azonosítják. A set_ShowValue true értéke megjeleníti az összegeket az oszlopokon. Bemutató vagy munkafüzet fájlra nincs szükség.
#include <system/shared_ptr.h>
#include <system/object_ext.h>
#include <system/string.h>
#include <system/array.h>
#include <DOM/Chart/ChartType.h>
#include <DOM/Chart/IChartCategoryCollection.h>
#include <DOM/Chart/IChartData.h>
#include <DOM/Chart/IChartDataCell.h>
#include <DOM/Chart/IChartDataPoint.h>
#include <DOM/Chart/IChartDataPointCollection.h>
#include <DOM/Chart/IChartDataWorkbook.h>
#include <DOM/Chart/IChartSeries.h>
#include <DOM/Chart/IChartSeriesCollection.h>
#include <DOM/Chart/IChartTextFormat.h>
#include <DOM/Chart/IChartTitle.h>
#include <DOM/Chart/IDataLabel.h>
#include <DOM/Chart/IDataLabelCollection.h>
#include <DOM/Chart/IDataLabelFormat.h>
#include <DOM/Chart/IDoubleChartValue.h>
#include <DOM/Chart/IFormat.h>
#include <DOM/Chart/ILegend.h>
#include <DOM/IChart.h>
#include <DOM/IColorFormat.h>
#include <DOM/IFillFormat.h>
#include <DOM/ILineFillFormat.h>
#include <DOM/ILineFormat.h>
#include <DOM/IPortionFormat.h>
#include <DOM/IShapeCollection.h>
#include <DOM/ISlide.h>
#include <DOM/ITextFrame.h>
#include <DOM/ITextFrameFormat.h>
#include <DOM/NullableBool.h>
#include <DOM/Presentation.h>
#include <Export/SaveFormat.h>

using namespace System;
using namespace Aspose::Slides;
using namespace Aspose::Slides::Charts;
using namespace Aspose::Slides::Export;

auto presentation = MakeObject<Presentation>();
auto slide = presentation->get_Slide(0);

auto chart = slide->get_Shapes()->AddChart(ChartType::Waterfall, 20, 20, 680, 200);

chart->set_HasTitle(true);
chart->get_ChartTitle()->AddTextFrameForOverriding(u"Profit breakdown (USD thousands)");
chart->get_ChartTitle()->set_Overlay(false);
chart->set_HasLegend(false);

chart->get_ChartData()->get_Series()->Clear();
chart->get_ChartData()->get_Categories()->Clear();

auto workbook = chart->get_ChartData()->get_ChartDataWorkbook();
auto worksheetIndex = 0;

workbook->Clear(worksheetIndex);

auto seriesNameCell = workbook->GetCell(worksheetIndex, 0, 1, ObjectExt::Box(String(u"Profit")));
auto series = chart->get_ChartData()->get_Series()->Add(seriesNameCell, ChartType::Waterfall);
auto categories = MakeArray<String>({ u"Revenue", u"Cost of sales", u"Gross profit", u"Operating expenses", u"Other income", u"Net profit" });
auto values = MakeArray<double>({ 1000, -400, 600, -200, 50, 450 });

for (auto i = 0; i < categories->get_Length(); i++)
{
    auto categoryCell = workbook->GetCell(worksheetIndex, i + 1, 0, ObjectExt::Box(categories->idx_get(i)));
    chart->get_ChartData()->get_Categories()->Add(categoryCell);
    auto valueCell = workbook->GetCell(worksheetIndex, i + 1, 1, ObjectExt::Box(values->idx_get(i)));
    series->get_DataPoints()->AddDataPointForWaterfallSeries(valueCell);
}

// A harmadik és hatodik pont összegként jelenik meg, nem további változásként.
series->get_DataPoints()->idx_get(2)->set_SetAsTotal(true);
series->get_DataPoints()->idx_get(5)->set_SetAsTotal(true);
series->set_ShowConnectorLines(true);
series->get_Labels()->get_DefaultDataLabelFormat()->set_ShowValue(true);

presentation->Save(u"WaterfallChart.pptx", SaveFormat::Pptx);
A sorozatszintű set_ShowConnectorLines metódus true értékével megjeleníthetők a szomszédos oszlopokat összekötő vonalak, így könnyebb követni a futó értéket. Ezeknek a vonalaknak a rejtéséhez cserélje le a példában a hozzárendelést series->set_ShowConnectorLines(false); –re a mentés előtt. Ez csak a vonalak láthatóságát változtatja, az adatokat vagy az összegeket nem.
A mentett prezentáció a 600 bruttó nyereséget és a 450 nettó nyereséget mutatja, mindkét összeg a nulláról indul:
Részvénydiagramok létrehozása
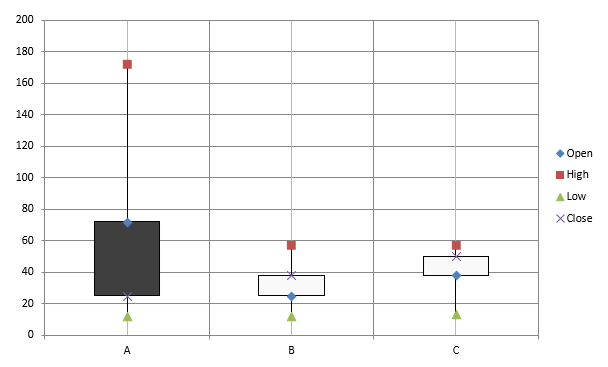
A részvénydiagramok pénzügyi adatok, például nyitó, magas, alacsony és záróárak megjelenítésére szolgálnak, segítve a piaci trendek és volatilitás elemzését. Alapvető betekintést nyújtanak a részvény teljesítményébe, támogatva a befektetőket és elemzőket a tájékozott döntések meghozatalában.
Ez a példa egy nyitó‑magas‑alacsony‑záró (OHLC) diagramot hoz létre négy sorozattal ebben a sorrendben, és három kategóriával. A set_HasUpDownBars metódus engedélyezi a fel‑le sávokat, a get_HiLowLinesFormat szabályozza a magas‑alacsony vonalakat, amelyek az árintervallumot mutatják, míg az egyes sorozatsorok és a kisebb vízszintes rácsvonalak rejtve maradnak.
#include <DOM/Chart/IChartLinesFormat.h>
#include <system/shared_ptr.h>
#include <system/object_ext.h>
#include <system/string.h>
#include <DOM/Chart/ChartType.h>
#include <DOM/Chart/IAxesManager.h>
#include <DOM/Chart/IAxis.h>
#include <DOM/Chart/IChartCategoryCollection.h>
#include <DOM/Chart/IChartData.h>
#include <DOM/Chart/IChartDataCell.h>
#include <DOM/Chart/IChartDataPoint.h>
#include <DOM/Chart/IChartDataPointCollection.h>
#include <DOM/Chart/IChartDataWorkbook.h>
#include <DOM/Chart/IChartSeries.h>
#include <DOM/Chart/IChartSeriesCollection.h>
#include <DOM/Chart/IChartSeriesGroup.h>
#include <DOM/Chart/IChartSeriesGroupCollection.h>
#include <DOM/Chart/IFormat.h>
#include <DOM/Chart/IUpDownBarsManager.h>
#include <DOM/FillType.h>
#include <DOM/IChart.h>
#include <DOM/IColorFormat.h>
#include <DOM/IFillFormat.h>
#include <DOM/ILineFillFormat.h>
#include <DOM/ILineFormat.h>
#include <DOM/IShapeCollection.h>
#include <DOM/ISlide.h>
#include <DOM/Presentation.h>
#include <Export/SaveFormat.h>

using namespace System;
using namespace Aspose::Slides;
using namespace Aspose::Slides::Charts;
using namespace Aspose::Slides::Export;

auto presentation = MakeObject<Presentation>();
auto slide = presentation->get_Slide(0);

auto chart = slide->get_Shapes()->AddChart(ChartType::OpenHighLowClose, 20, 20, 500, 300, false);

auto workbook = chart->get_ChartData()->get_ChartDataWorkbook();

auto categoryCell = workbook->GetCell(0, 1, 0, ObjectExt::Box(String(u"A")));
chart->get_ChartData()->get_Categories()->Add(categoryCell);
categoryCell = workbook->GetCell(0, 2, 0, ObjectExt::Box(String(u"B")));
chart->get_ChartData()->get_Categories()->Add(categoryCell);
categoryCell = workbook->GetCell(0, 3, 0, ObjectExt::Box(String(u"C")));
chart->get_ChartData()->get_Categories()->Add(categoryCell);

auto seriesNameCell = workbook->GetCell(0, 0, 1, ObjectExt::Box(String(u"Open")));
chart->get_ChartData()->get_Series()->Add(seriesNameCell, ChartType::OpenHighLowClose);
seriesNameCell = workbook->GetCell(0, 0, 2, ObjectExt::Box(String(u"High")));
chart->get_ChartData()->get_Series()->Add(seriesNameCell, ChartType::OpenHighLowClose);
seriesNameCell = workbook->GetCell(0, 0, 3, ObjectExt::Box(String(u"Low")));
chart->get_ChartData()->get_Series()->Add(seriesNameCell, ChartType::OpenHighLowClose);
seriesNameCell = workbook->GetCell(0, 0, 4, ObjectExt::Box(String(u"Close")));
chart->get_ChartData()->get_Series()->Add(seriesNameCell, ChartType::OpenHighLowClose);

auto series = chart->get_ChartData()->get_Series()->idx_get(0);
auto valueCell = workbook->GetCell(0, 1, 1, ObjectExt::Box(72));
series->get_DataPoints()->AddDataPointForStockSeries(valueCell);
valueCell = workbook->GetCell(0, 2, 1, ObjectExt::Box(25));
series->get_DataPoints()->AddDataPointForStockSeries(valueCell);
valueCell = workbook->GetCell(0, 3, 1, ObjectExt::Box(38));
series->get_DataPoints()->AddDataPointForStockSeries(valueCell);

series = chart->get_ChartData()->get_Series()->idx_get(1);
valueCell = workbook->GetCell(0, 1, 2, ObjectExt::Box(172));
series->get_DataPoints()->AddDataPointForStockSeries(valueCell);
valueCell = workbook->GetCell(0, 2, 2, ObjectExt::Box(57));
series->get_DataPoints()->AddDataPointForStockSeries(valueCell);
valueCell = workbook->GetCell(0, 3, 2, ObjectExt::Box(57));
series->get_DataPoints()->AddDataPointForStockSeries(valueCell);

series = chart->get_ChartData()->get_Series()->idx_get(2);
valueCell = workbook->GetCell(0, 1, 3, ObjectExt::Box(12));
series->get_DataPoints()->AddDataPointForStockSeries(valueCell);
valueCell = workbook->GetCell(0, 2, 3, ObjectExt::Box(12));
series->get_DataPoints()->AddDataPointForStockSeries(valueCell);
valueCell = workbook->GetCell(0, 3, 3, ObjectExt::Box(13));
series->get_DataPoints()->AddDataPointForStockSeries(valueCell);

series = chart->get_ChartData()->get_Series()->idx_get(3);
valueCell = workbook->GetCell(0, 1, 4, ObjectExt::Box(25));
series->get_DataPoints()->AddDataPointForStockSeries(valueCell);
valueCell = workbook->GetCell(0, 2, 4, ObjectExt::Box(38));
series->get_DataPoints()->AddDataPointForStockSeries(valueCell);
valueCell = workbook->GetCell(0, 3, 4, ObjectExt::Box(50));
series->get_DataPoints()->AddDataPointForStockSeries(valueCell);

chart->get_ChartData()->get_SeriesGroups()->idx_get(0)->get_UpDownBars()->set_HasUpDownBars(true);
chart->get_ChartData()->get_SeriesGroups()->idx_get(0)->get_HiLowLinesFormat()->get_Line()->get_FillFormat()->set_FillType(FillType::Solid);

for (auto stockSeries : chart->get_ChartData()->get_Series())
{
    stockSeries->get_Format()->get_Line()->get_FillFormat()->set_FillType(FillType::NoFill);
}

chart->get_Axes()->get_VerticalAxis()->get_MinorGridLinesFormat()->get_Line()->get_FillFormat()->set_FillType(FillType::NoFill);

presentation->Save(u"Stock-chart.pptx", SaveFormat::Pptx);
Az eredmény:
Doboz‑ és bajusz diagramok létrehozása
A doboz‑ és bajusz diagramok az adat eloszlását jelenítik meg, összefoglalva a kulcsfontosságú statisztikai mérőszámokat, mint a medián, kvartilisek és esetleges kiugró értékek. Különösen hasznosak felderítő adat-elemzésben és statisztikai tanulmányokban, hogy gyorsan megértsük az adatok variabilitását és az esetleges anomáliákat.
Ez a példa hat értékkel hoz létre egy doboz‑ és bajusz diagramot. A set_QuartileMethod metódus az exkluzív kvartilis számítást választja. A példa továbbá engedélyezi a középértékvonalakat, középérték‑jelölőket, belső pontokat és kiugró pontokat.
#include <system/shared_ptr.h>
#include <system/object_ext.h>
#include <system/string.h>
#include <DOM/Chart/ChartType.h>
#include <DOM/Chart/IChartCategoryCollection.h>
#include <DOM/Chart/IChartData.h>
#include <DOM/Chart/IChartDataCell.h>
#include <DOM/Chart/IChartDataPoint.h>
#include <DOM/Chart/IChartDataPointCollection.h>
#include <DOM/Chart/IChartDataWorkbook.h>
#include <DOM/Chart/IChartSeries.h>
#include <DOM/Chart/IChartSeriesCollection.h>
#include <DOM/Chart/IFormat.h>
#include <DOM/Chart/IMarker.h>
#include <DOM/Chart/QuartileMethodType.h>
#include <DOM/IChart.h>
#include <DOM/IColorFormat.h>
#include <DOM/IFillFormat.h>
#include <DOM/ILineFillFormat.h>
#include <DOM/ILineFormat.h>
#include <DOM/IShapeCollection.h>
#include <DOM/ISlide.h>
#include <DOM/Presentation.h>
#include <Export/SaveFormat.h>

using namespace System;
using namespace Aspose::Slides;
using namespace Aspose::Slides::Charts;
using namespace Aspose::Slides::Export;

auto presentation = MakeObject<Presentation>();
auto slide = presentation->get_Slide(0);

auto chart = slide->get_Shapes()->AddChart(ChartType::BoxAndWhisker, 20, 20, 500, 300);

chart->get_ChartData()->get_Categories()->Clear();
chart->get_ChartData()->get_Series()->Clear();

auto workbook = chart->get_ChartData()->get_ChartDataWorkbook();
workbook->Clear(0);

auto categoryCell = workbook->GetCell(0, u"A1", ObjectExt::Box(String(u"Category 1")));
chart->get_ChartData()->get_Categories()->Add(categoryCell);
categoryCell = workbook->GetCell(0, u"A2", ObjectExt::Box(String(u"Category 2")));
chart->get_ChartData()->get_Categories()->Add(categoryCell);
categoryCell = workbook->GetCell(0, u"A3", ObjectExt::Box(String(u"Category 3")));
chart->get_ChartData()->get_Categories()->Add(categoryCell);
categoryCell = workbook->GetCell(0, u"A4", ObjectExt::Box(String(u"Category 4")));
chart->get_ChartData()->get_Categories()->Add(categoryCell);
categoryCell = workbook->GetCell(0, u"A5", ObjectExt::Box(String(u"Category 5")));
chart->get_ChartData()->get_Categories()->Add(categoryCell);
categoryCell = workbook->GetCell(0, u"A6", ObjectExt::Box(String(u"Category 6")));
chart->get_ChartData()->get_Categories()->Add(categoryCell);

auto series = chart->get_ChartData()->get_Series()->Add(ChartType::BoxAndWhisker);

series->set_QuartileMethod(QuartileMethodType::Exclusive);
series->set_ShowMeanLine(true);
series->set_ShowMeanMarkers(true);
series->set_ShowInnerPoints(true);
series->set_ShowOutlierPoints(true);

auto valueCell = workbook->GetCell(0, u"B1", ObjectExt::Box(15));
series->get_DataPoints()->AddDataPointForBoxAndWhiskerSeries(valueCell);
valueCell = workbook->GetCell(0, u"B2", ObjectExt::Box(41));
series->get_DataPoints()->AddDataPointForBoxAndWhiskerSeries(valueCell);
valueCell = workbook->GetCell(0, u"B3", ObjectExt::Box(16));
series->get_DataPoints()->AddDataPointForBoxAndWhiskerSeries(valueCell);
valueCell = workbook->GetCell(0, u"B4", ObjectExt::Box(10));
series->get_DataPoints()->AddDataPointForBoxAndWhiskerSeries(valueCell);
valueCell = workbook->GetCell(0, u"B5", ObjectExt::Box(23));
series->get_DataPoints()->AddDataPointForBoxAndWhiskerSeries(valueCell);
valueCell = workbook->GetCell(0, u"B6", ObjectExt::Box(16));
series->get_DataPoints()->AddDataPointForBoxAndWhiskerSeries(valueCell);

presentation->Save(u"BoxAndWhisker.pptx", SaveFormat::Pptx);
Tölcsér diagramok létrehozása
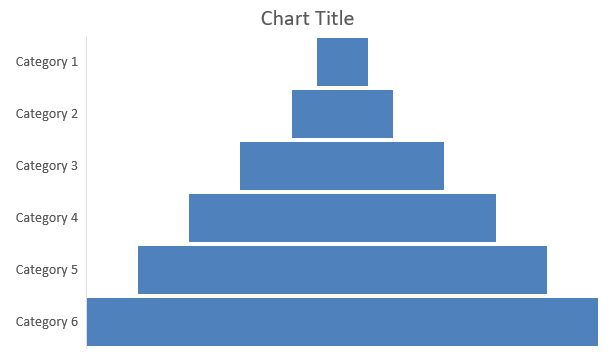
A tölcsér diagramokat folyamatok szekvenciális szakaszainak vizualizálására használják, ahol az adat mennyisége csökken az egyes lépések között. Különösen hasznosak a konverziós arányok elemzésében, a szűk keresztmetszetek azonosításában és az értékesítési vagy marketing folyamatok hatékonyságának nyomon követésében.
Ez a példa a AddChart metódussal egy tölcsér diagramot ad az adott prezentáció első diájához. A alapértelmezett adatot hat kategóriára és 50‑től 500‑ig terjedő értékekre cseréli, majd menti a frissített prezentációt. A bemeneti prezentációnak legalább egy diával kell rendelkeznie.
#include <system/shared_ptr.h>
#include <system/object_ext.h>
#include <system/string.h>
#include <DOM/Chart/ChartType.h>
#include <DOM/Chart/IChartCategoryCollection.h>
#include <DOM/Chart/IChartData.h>
#include <DOM/Chart/IChartDataCell.h>
#include <DOM/Chart/IChartDataPoint.h>
#include <DOM/Chart/IChartDataPointCollection.h>
#include <DOM/Chart/IChartDataWorkbook.h>
#include <DOM/Chart/IChartSeries.h>
#include <DOM/Chart/IChartSeriesCollection.h>
#include <DOM/Chart/IFormat.h>
#include <DOM/IChart.h>
#include <DOM/IColorFormat.h>
#include <DOM/IFillFormat.h>
#include <DOM/ILineFillFormat.h>
#include <DOM/ILineFormat.h>
#include <DOM/IShapeCollection.h>
#include <DOM/ISlide.h>
#include <DOM/Presentation.h>
#include <Export/SaveFormat.h>

using namespace System;
using namespace Aspose::Slides;
using namespace Aspose::Slides::Charts;
using namespace Aspose::Slides::Export;

auto presentation = MakeObject<Presentation>(u"test.pptx");
auto slide = presentation->get_Slide(0);

auto chart = slide->get_Shapes()->AddChart(ChartType::Funnel, 50, 50, 500, 400);

chart->get_ChartData()->get_Categories()->Clear();
chart->get_ChartData()->get_Series()->Clear();

auto workbook = chart->get_ChartData()->get_ChartDataWorkbook();
workbook->Clear(0);

auto categoryCell = workbook->GetCell(0, u"A1", ObjectExt::Box(String(u"Category 1")));
chart->get_ChartData()->get_Categories()->Add(categoryCell);
categoryCell = workbook->GetCell(0, u"A2", ObjectExt::Box(String(u"Category 2")));
chart->get_ChartData()->get_Categories()->Add(categoryCell);
categoryCell = workbook->GetCell(0, u"A3", ObjectExt::Box(String(u"Category 3")));
chart->get_ChartData()->get_Categories()->Add(categoryCell);
categoryCell = workbook->GetCell(0, u"A4", ObjectExt::Box(String(u"Category 4")));
chart->get_ChartData()->get_Categories()->Add(categoryCell);
categoryCell = workbook->GetCell(0, u"A5", ObjectExt::Box(String(u"Category 5")));
chart->get_ChartData()->get_Categories()->Add(categoryCell);
categoryCell = workbook->GetCell(0, u"A6", ObjectExt::Box(String(u"Category 6")));
chart->get_ChartData()->get_Categories()->Add(categoryCell);

auto series = chart->get_ChartData()->get_Series()->Add(ChartType::Funnel);

auto valueCell = workbook->GetCell(0, u"B1", ObjectExt::Box(50));
series->get_DataPoints()->AddDataPointForFunnelSeries(valueCell);
valueCell = workbook->GetCell(0, u"B2", ObjectExt::Box(100));
series->get_DataPoints()->AddDataPointForFunnelSeries(valueCell);
valueCell = workbook->GetCell(0, u"B3", ObjectExt::Box(200));
series->get_DataPoints()->AddDataPointForFunnelSeries(valueCell);
valueCell = workbook->GetCell(0, u"B4", ObjectExt::Box(300));
series->get_DataPoints()->AddDataPointForFunnelSeries(valueCell);
valueCell = workbook->GetCell(0, u"B5", ObjectExt::Box(400));
series->get_DataPoints()->AddDataPointForFunnelSeries(valueCell);
valueCell = workbook->GetCell(0, u"B6", ObjectExt::Box(500));
series->get_DataPoints()->AddDataPointForFunnelSeries(valueCell);

presentation->Save(u"Funnel.pptx", SaveFormat::Pptx);
Az eredmény:
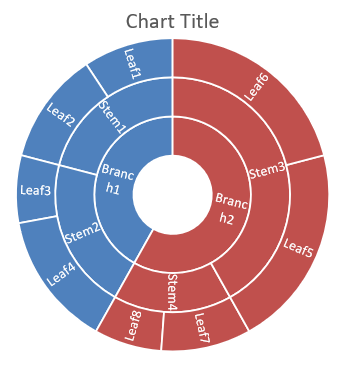
Napfény diagramok létrehozása
A napfény diagramok hierarchikus adatokat jelenítenek meg, a szinteket koncentrikus gyűrűkként ábrázolva. Segítenek a rész‑egész kapcsolatok illusztrálásában, és ideálisak ágyazott kategóriák és al‑kategóriák tiszta, kompakt formában történő ábrázolására.
Ez a példa nyolc levélből álló napfény diagramot hoz létre, négy szárra és két ágra csoportosítva. A SetGroupingItem metódus az 1‑es szintnél a szárakat, a 2‑es szintnél az ágakat rendeli. A kategóriacímkék az egyes szegmenseket azonosítják, az értékek pedig a relatív méreteket határozzák meg.
#include <system/shared_ptr.h>
#include <system/object_ext.h>
#include <system/string.h>
#include <DOM/Chart/ChartType.h>
#include <DOM/Chart/IChartCategory.h>
#include <DOM/Chart/IChartCategoryCollection.h>
#include <DOM/Chart/IChartCategoryLevelsManager.h>
#include <DOM/Chart/IChartData.h>
#include <DOM/Chart/IChartDataCell.h>
#include <DOM/Chart/IChartDataPoint.h>
#include <DOM/Chart/IChartDataPointCollection.h>
#include <DOM/Chart/IChartDataWorkbook.h>
#include <DOM/Chart/IChartSeries.h>
#include <DOM/Chart/IChartSeriesCollection.h>
#include <DOM/Chart/IDataLabel.h>
#include <DOM/Chart/IDataLabelCollection.h>
#include <DOM/Chart/IDataLabelFormat.h>
#include <DOM/Chart/IFormat.h>
#include <DOM/IChart.h>
#include <DOM/IColorFormat.h>
#include <DOM/IFillFormat.h>
#include <DOM/ILineFillFormat.h>
#include <DOM/ILineFormat.h>
#include <DOM/IShapeCollection.h>
#include <DOM/ISlide.h>
#include <DOM/Presentation.h>
#include <Export/SaveFormat.h>

using namespace System;
using namespace Aspose::Slides;
using namespace Aspose::Slides::Charts;
using namespace Aspose::Slides::Export;

auto presentation = MakeObject<Presentation>();
auto slide = presentation->get_Slide(0);

auto chart = slide->get_Shapes()->AddChart(ChartType::Sunburst, 20, 20, 500, 300);

chart->get_ChartData()->get_Categories()->Clear();
chart->get_ChartData()->get_Series()->Clear();

auto workbook = chart->get_ChartData()->get_ChartDataWorkbook();
workbook->Clear(0);

// Ág 1
auto categoryCell = workbook->GetCell(0, u"C1", ObjectExt::Box(String(u"Leaf1")));
auto leaf = chart->get_ChartData()->get_Categories()->Add(categoryCell);
leaf->get_GroupingLevels()->SetGroupingItem(1, ObjectExt::Box(String(u"Stem1")));
leaf->get_GroupingLevels()->SetGroupingItem(2, ObjectExt::Box(String(u"Branch1")));

categoryCell = workbook->GetCell(0, u"C2", ObjectExt::Box(String(u"Leaf2")));
chart->get_ChartData()->get_Categories()->Add(categoryCell);

categoryCell = workbook->GetCell(0, u"C3", ObjectExt::Box(String(u"Leaf3")));
leaf = chart->get_ChartData()->get_Categories()->Add(categoryCell);
leaf->get_GroupingLevels()->SetGroupingItem(1, ObjectExt::Box(String(u"Stem2")));

categoryCell = workbook->GetCell(0, u"C4", ObjectExt::Box(String(u"Leaf4")));
chart->get_ChartData()->get_Categories()->Add(categoryCell);

// Ág 2
categoryCell = workbook->GetCell(0, u"C5", ObjectExt::Box(String(u"Leaf5")));
leaf = chart->get_ChartData()->get_Categories()->Add(categoryCell);
leaf->get_GroupingLevels()->SetGroupingItem(1, ObjectExt::Box(String(u"Stem3")));
leaf->get_GroupingLevels()->SetGroupingItem(2, ObjectExt::Box(String(u"Branch2")));

categoryCell = workbook->GetCell(0, u"C6", ObjectExt::Box(String(u"Leaf6")));
chart->get_ChartData()->get_Categories()->Add(categoryCell);

categoryCell = workbook->GetCell(0, u"C7", ObjectExt::Box(String(u"Leaf7")));
leaf = chart->get_ChartData()->get_Categories()->Add(categoryCell);
leaf->get_GroupingLevels()->SetGroupingItem(1, ObjectExt::Box(String(u"Stem4")));

categoryCell = workbook->GetCell(0, u"C8", ObjectExt::Box(String(u"Leaf8")));
chart->get_ChartData()->get_Categories()->Add(categoryCell);

auto series = chart->get_ChartData()->get_Series()->Add(ChartType::Sunburst);
series->get_Labels()->get_DefaultDataLabelFormat()->set_ShowCategoryName(true);
auto valueCell = workbook->GetCell(0, u"D1", ObjectExt::Box(4));
series->get_DataPoints()->AddDataPointForSunburstSeries(valueCell);
valueCell = workbook->GetCell(0, u"D2", ObjectExt::Box(5));
series->get_DataPoints()->AddDataPointForSunburstSeries(valueCell);
valueCell = workbook->GetCell(0, u"D3", ObjectExt::Box(3));
series->get_DataPoints()->AddDataPointForSunburstSeries(valueCell);
valueCell = workbook->GetCell(0, u"D4", ObjectExt::Box(6));
series->get_DataPoints()->AddDataPointForSunburstSeries(valueCell);
valueCell = workbook->GetCell(0, u"D5", ObjectExt::Box(9));
series->get_DataPoints()->AddDataPointForSunburstSeries(valueCell);
valueCell = workbook->GetCell(0, u"D6", ObjectExt::Box(9));
series->get_DataPoints()->AddDataPointForSunburstSeries(valueCell);
valueCell = workbook->GetCell(0, u"D7", ObjectExt::Box(4));
series->get_DataPoints()->AddDataPointForSunburstSeries(valueCell);
valueCell = workbook->GetCell(0, u"D8", ObjectExt::Box(3));
series->get_DataPoints()->AddDataPointForSunburstSeries(valueCell);

presentation->Save(u"Sunburst.pptx", SaveFormat::Pptx);
Az eredmény:
Hisztogram diagramok létrehozása
A hisztogram diagramok megmutatják, hogyan oszlanak el a numerikus értékek intervallumok (bins) között. Havi jelentések esetén a megrendelésfeldolgozási idők esetén használjon azonos bin‑szélességet és küszöböket, hogy az intervallumok konzisztensen legyenek, és a eloszlások könnyen összehasonlíthatók legyenek.
Hívja meg a vízszintes tengelyen a set_AggregationType metódust a AxisAggregationType valamelyik módjával. A set_BinWidth csak a ByBinWidth esetén alkalmazható; a set_NumberOfBins csak a ByNumberOfBins esetén. Használja az Automatic értéket, hogy a diagram magát válassza ki a bin‑eket.
Rögzített bin‑szélesség használata
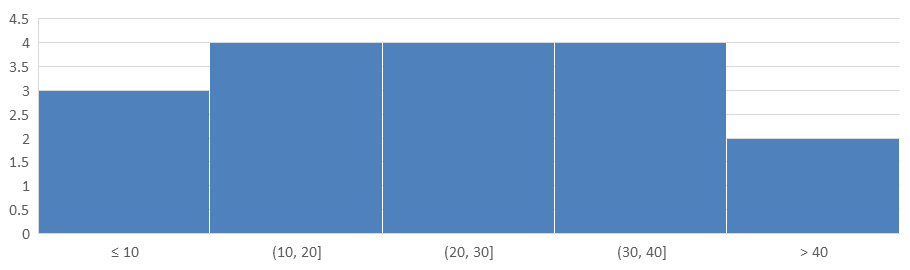
Ez a példa a feldolgozási időket 10 perces intervallumokba csoportosítja, külön bin‑ekkel a ≤10 perc és >40 perc időket. Engedélyezze ezeket a bin‑eket a set_IsUnderflowBin és a set_IsOverflowBin metódusokkal. Ha explicit küszöböket ad meg a set_UnderflowBin és a set_OverflowBin metódusokkal, hívja meg a set_IsAutomaticUnderflowBin és a set_IsAutomaticOverflowBin false értékével.
#include <system/array.h>
#include <system/shared_ptr.h>
#include <system/object_ext.h>
#include <system/string.h>
#include <DOM/Chart/AxisAggregationType.h>
#include <DOM/Chart/ChartType.h>
#include <DOM/Chart/IAxesManager.h>
#include <DOM/Chart/IAxis.h>
#include <DOM/Chart/IChartCategoryCollection.h>
#include <DOM/Chart/IChartData.h>
#include <DOM/Chart/IChartDataCell.h>
#include <DOM/Chart/IChartDataPoint.h>
#include <DOM/Chart/IChartDataPointCollection.h>
#include <DOM/Chart/IChartDataWorkbook.h>
#include <DOM/Chart/IChartSeries.h>
#include <DOM/Chart/IChartSeriesCollection.h>
#include <DOM/Chart/IFormat.h>
#include <DOM/IChart.h>
#include <DOM/IColorFormat.h>
#include <DOM/IFillFormat.h>
#include <DOM/ILineFillFormat.h>
#include <DOM/ILineFormat.h>
#include <DOM/IShapeCollection.h>
#include <DOM/ISlide.h>
#include <DOM/Presentation.h>
#include <Export/SaveFormat.h>

using namespace System;
using namespace Aspose::Slides;
using namespace Aspose::Slides::Charts;
using namespace Aspose::Slides::Export;

auto presentation = MakeObject<Presentation>();
auto slide = presentation->get_Slide(0);

auto chart = slide->get_Shapes()->AddChart(ChartType::Histogram, 20, 20, 680, 200);

chart->set_HasLegend(false);
chart->set_HasTitle(false);

chart->get_ChartData()->get_Categories()->Clear();
chart->get_ChartData()->get_Series()->Clear();

auto workbook = chart->get_ChartData()->get_ChartDataWorkbook();
workbook->Clear(0);

auto series = chart->get_ChartData()->get_Series()->Add(ChartType::Histogram);
auto values = MakeArray<double>({ 5, 10, 10, 11, 15, 20, 20, 21, 25, 30, 30, 31, 35, 40, 40, 41, 50 });
for (auto i = 0; i < values->get_Length(); i++)
{
    auto valueCell = workbook->GetCell(0, i, 0, ObjectExt::Box(values[i]));
    series->get_DataPoints()->AddDataPointForHistogramSeries(valueCell);
}

auto axis = chart->get_Axes()->get_HorizontalAxis();
axis->set_AggregationType(AxisAggregationType::ByBinWidth);
axis->set_BinWidth(10);
axis->set_IsUnderflowBin(true);
axis->set_IsAutomaticUnderflowBin(false);
axis->set_UnderflowBin(10);
axis->set_IsOverflowBin(true);
axis->set_IsAutomaticOverflowBin(false);
axis->set_OverflowBin(40);

presentation->Save(u"Histogram-bin-width.pptx", SaveFormat::Pptx);
A PowerPointban megjelenő prezentáció a bin‑számokat 3, 4, 4, 4, és 2 mutatja. Az alulfolyó bin tartalmazza a 5, 10, 10 értékeket, ezért a küszöb inkluzív. A felülfolyó bin csak a 41, 50 értékeket tartalmazza, ezért a küszöb exkluzív; a 40 értékek az előző intervallumban maradnak. A belső bin‑ek a saját alsó határuknál nagyobb, felső határuknál kisebb vagy egyenlő értékeket tartalmazzák.
A bin‑szám megadása
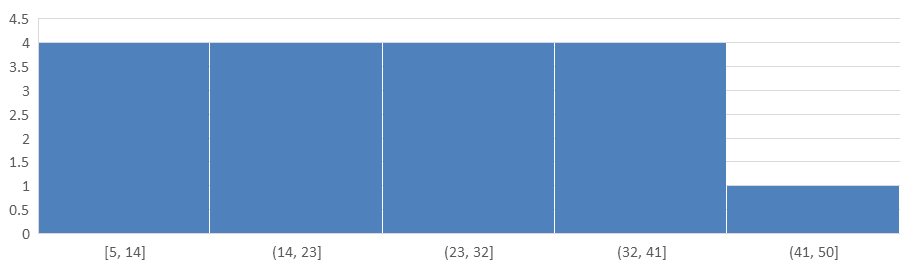
Ha a részletességi szintet szeretné rögzíteni a fix intervallumok helyett, kérje ki öt bin‑t ugyanarra az adatra. Ez a példa letiltja az alul‑ és felülfolyó bin‑eket. A diagram a szélességet az adat‑tartományból számítja, ezért a határok a jelentések között változhatnak.
#include <system/array.h>
#include <system/shared_ptr.h>
#include <system/object_ext.h>
#include <system/string.h>
#include <DOM/Chart/AxisAggregationType.h>
#include <DOM/Chart/ChartType.h>
#include <DOM/Chart/IAxesManager.h>
#include <DOM/Chart/IAxis.h>
#include <DOM/Chart/IChartCategoryCollection.h>
#include <DOM/Chart/IChartData.h>
#include <DOM/Chart/IChartDataCell.h>
#include <DOM/Chart/IChartDataPoint.h>
#include <DOM/Chart/IChartDataPointCollection.h>
#include <DOM/Chart/IChartDataWorkbook.h>
#include <DOM/Chart/IChartSeries.h>
#include <DOM/Chart/IChartSeriesCollection.h>
#include <DOM/Chart/IFormat.h>
#include <DOM/IChart.h>
#include <DOM/IColorFormat.h>
#include <DOM/IFillFormat.h>
#include <DOM/ILineFillFormat.h>
#include <DOM/ILineFormat.h>
#include <DOM/IShapeCollection.h>
#include <DOM/ISlide.h>
#include <DOM/Presentation.h>
#include <Export/SaveFormat.h>

using namespace System;
using namespace Aspose::Slides;
using namespace Aspose::Slides::Charts;
using namespace Aspose::Slides::Export;

auto presentation = MakeObject<Presentation>();
auto slide = presentation->get_Slide(0);

auto chart = slide->get_Shapes()->AddChart(ChartType::Histogram, 20, 20, 680, 200);

chart->set_HasLegend(false);
chart->set_HasTitle(false);

chart->get_ChartData()->get_Categories()->clear();
chart->get_ChartData()->get_Series()->clear();

auto workbook = chart->get_ChartData()->get_ChartDataWorkbook();
workbook->Clear(0);

auto series = chart->get_ChartData()->get_Series()->Add(ChartType::Histogram);
auto values = MakeArray<double>({ 5, 10, 10, 11, 15, 20, 20, 21, 25, 30, 30, 31, 35, 40, 40, 41, 50 });
for (auto i = 0; i < values->get_Length(); i++)
{
    auto valueCell = workbook->GetCell(0, i, 0, ObjectExt::Box(values[i]));
    series->get_DataPoints()->AddDataPointForHistogramSeries(valueCell);
}

auto axis = chart->get_Axes()->get_HorizontalAxis();
axis->set_AggregationType(AxisAggregationType::ByNumberOfBins);
axis->set_NumberOfBins(5);

presentation->Save(u"Histogram-bin-count.pptx", SaveFormat::Pptx);
Az öt bin száma 4, 4, 4, 4, és 1. Hasonlítsa össze ezt a fenti rögzített‑szélességű eredménnyel: a bemeneti értékek azonosak, de a határok eltérnek.
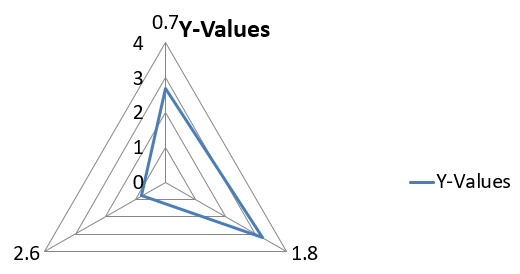
Radiális diagramok létrehozása
A radiális diagramok többváltozós adatot jelenítenek meg kétdimenziós formátumban, lehetővé téve több változó egyszerre történő összehasonlítását. Különösen hasznosak a minták, erősségek és gyengeségek azonosításában több teljesítménymutató vagy attribútum esetén.
Ez a példa a AddChart metódust használja egy radiális diagram létrehozásához az alapértelmezett sorozatokkal és kategóriákkal, majd PPTX formátumban menti a prezentációt.
#include <system/shared_ptr.h>
#include <DOM/Chart/ChartType.h>
#include <DOM/Chart/IChartCategoryCollection.h>
#include <DOM/Chart/IChartData.h>
#include <DOM/Chart/IChartSeriesCollection.h>
#include <DOM/Chart/IFormat.h>
#include <DOM/IChart.h>
#include <DOM/IColorFormat.h>
#include <DOM/IFillFormat.h>
#include <DOM/ILineFillFormat.h>
#include <DOM/ILineFormat.h>
#include <DOM/IShapeCollection.h>
#include <DOM/ISlide.h>
#include <DOM/Presentation.h>
#include <Export/SaveFormat.h>

using namespace System;
using namespace Aspose::Slides;
using namespace Aspose::Slides::Charts;
using namespace Aspose::Slides::Export;

auto presentation = MakeObject<Presentation>();
auto slide = presentation->get_Slide(0);

slide->get_Shapes()->AddChart(ChartType::Radar, 20, 20, 500, 300);

presentation->Save(u"Radar-chart.pptx", SaveFormat::Pptx);
Az eredmény:
Többkategóriás diagramok létrehozása
A többkategóriás diagramok olyan adatokat jelenítenek meg, amelyek több kategória‑csoportosítást tartalmaznak, lehetővé téve az értékek több dimenzióban történő egyidejű összehasonlítását. Különösen hasznosak összetett, többrétegű adathalmazok trendjeinek és kapcsolódásainak elemzéséhez.
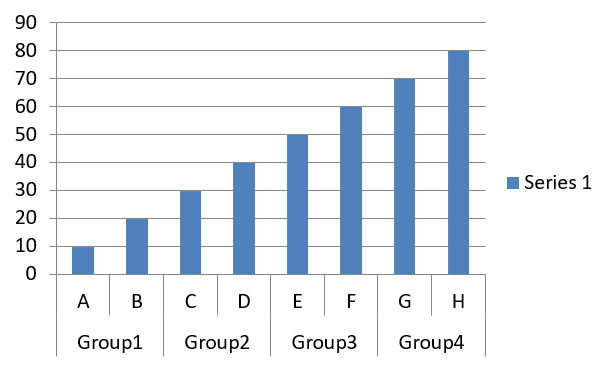
Ez a példa egy csoportos oszlopdiagramot hoz létre nyolc kategóriával, amelyek négy párosra rendeződnek. A SetGroupingItem metódus minden párnak közös címkét ad az 1‑es csoportosítási szinten, így a kategóriatengelyen egyaránt megjelennek az egyedi és a csoportcímkék.
#include <system/shared_ptr.h>
#include <system/object_ext.h>
#include <system/string.h>
#include <DOM/Chart/ChartType.h>
#include <DOM/Chart/IChartCategory.h>
#include <DOM/Chart/IChartCategoryCollection.h>
#include <DOM/Chart/IChartCategoryLevelsManager.h>
#include <DOM/Chart/IChartData.h>
#include <DOM/Chart/IChartDataCell.h>
#include <DOM/Chart/IChartDataPoint.h>
#include <DOM/Chart/IChartDataPointCollection.h>
#include <DOM/Chart/IChartDataWorkbook.h>
#include <DOM/Chart/IChartSeries.h>
#include <DOM/Chart/IChartSeriesCollection.h>
#include <DOM/Chart/IFormat.h>
#include <DOM/IChart.h>
#include <DOM/IColorFormat.h>
#include <DOM/IFillFormat.h>
#include <DOM/ILineFillFormat.h>
#include <DOM/ILineFormat.h>
#include <DOM/IShapeCollection.h>
#include <DOM/ISlide.h>
#include <DOM/Presentation.h>
#include <Export/SaveFormat.h>

using namespace System;
using namespace Aspose::Slides;
using namespace Aspose::Slides::Charts;
using namespace Aspose::Slides::Export;

auto presentation = MakeObject<Presentation>();
auto slide = presentation->get_Slide(0);

auto chart = slide->get_Shapes()->AddChart(ChartType::ClusteredColumn, 20, 20, 500, 300);

chart->get_ChartData()->get_Series()->Clear();
chart->get_ChartData()->get_Categories()->Clear();

auto workbook = chart->get_ChartData()->get_ChartDataWorkbook();
workbook->Clear(0);

auto worksheetIndex = 0;

auto categoryCell = workbook->GetCell(0, u"c2", ObjectExt::Box(String(u"A")));
auto category = chart->get_ChartData()->get_Categories()->Add(categoryCell);
category->get_GroupingLevels()->SetGroupingItem(1, ObjectExt::Box(String(u"Group1")));
categoryCell = workbook->GetCell(0, u"c3", ObjectExt::Box(String(u"B")));
category = chart->get_ChartData()->get_Categories()->Add(categoryCell);

categoryCell = workbook->GetCell(0, u"c4", ObjectExt::Box(String(u"C")));
category = chart->get_ChartData()->get_Categories()->Add(categoryCell);
category->get_GroupingLevels()->SetGroupingItem(1, ObjectExt::Box(String(u"Group2")));
categoryCell = workbook->GetCell(0, u"c5", ObjectExt::Box(String(u"D")));
category = chart->get_ChartData()->get_Categories()->Add(categoryCell);

categoryCell = workbook->GetCell(0, u"c6", ObjectExt::Box(String(u"E")));
category = chart->get_ChartData()->get_Categories()->Add(categoryCell);
category->get_GroupingLevels()->SetGroupingItem(1, ObjectExt::Box(String(u"Group3")));
categoryCell = workbook->GetCell(0, u"c7", ObjectExt::Box(String(u"F")));
category = chart->get_ChartData()->get_Categories()->Add(categoryCell);

categoryCell = workbook->GetCell(0, u"c8", ObjectExt::Box(String(u"G")));
category = chart->get_ChartData()->get_Categories()->Add(categoryCell);
category->get_GroupingLevels()->SetGroupingItem(1, ObjectExt::Box(String(u"Group4")));
categoryCell = workbook->GetCell(0, u"c9", ObjectExt::Box(String(u"H")));
category = chart->get_ChartData()->get_Categories()->Add(categoryCell);

auto seriesNameCell = workbook->GetCell(0, u"D1", ObjectExt::Box(String(u"Series 1")));
auto series = chart->get_ChartData()->get_Series()->Add(seriesNameCell, ChartType::ClusteredColumn);

auto valueCell = workbook->GetCell(worksheetIndex, u"D2", ObjectExt::Box(10));
series->get_DataPoints()->AddDataPointForBarSeries(valueCell);
valueCell = workbook->GetCell(worksheetIndex, u"D3", ObjectExt::Box(20));
series->get_DataPoints()->AddDataPointForBarSeries(valueCell);
valueCell = workbook->GetCell(worksheetIndex, u"D4", ObjectExt::Box(30));
series->get_DataPoints()->AddDataPointForBarSeries(valueCell);
valueCell = workbook->GetCell(worksheetIndex, u"D5", ObjectExt::Box(40));
series->get_DataPoints()->AddDataPointForBarSeries(valueCell);
valueCell = workbook->GetCell(worksheetIndex, u"D6", ObjectExt::Box(50));
series->get_DataPoints()->AddDataPointForBarSeries(valueCell);
valueCell = workbook->GetCell(worksheetIndex, u"D7", ObjectExt::Box(60));
series->get_DataPoints()->AddDataPointForBarSeries(valueCell);
valueCell = workbook->GetCell(worksheetIndex, u"D8", ObjectExt::Box(70));
series->get_DataPoints()->AddDataPointForBarSeries(valueCell);
valueCell = workbook->GetCell(worksheetIndex, u"D9", ObjectExt::Box(80));
series->get_DataPoints()->AddDataPointForBarSeries(valueCell);

presentation->Save(u"AsposeChart.pptx", SaveFormat::Pptx);
Az eredmény:
Térképadagramok létrehozása
A térképadagramok földrajzi adatok vizualizálására szolgálnak, az információkat konkrét helyekhez – országokhoz, államokhoz vagy városokhoz – rendelve. Különösen hasznosak regionális trendek, demográfiai adatok és térbeli eloszlások elemzésére, egyértelmű és vizuálisan vonzó módon.
Ez a példa a AddChart metódust használja egy térképadagram létrehozásához alapértelmezett földrajzi adatokkal, és a PowerPointban történő megtekintéshez menti.
#include <system/shared_ptr.h>
#include <DOM/Chart/ChartType.h>
#include <DOM/Chart/IChartCategoryCollection.h>
#include <DOM/Chart/IChartData.h>
#include <DOM/Chart/IChartSeriesCollection.h>
#include <DOM/Chart/IFormat.h>
#include <DOM/IChart.h>
#include <DOM/IColorFormat.h>
#include <DOM/IFillFormat.h>
#include <DOM/ILineFillFormat.h>
#include <DOM/ILineFormat.h>
#include <DOM/IShapeCollection.h>
#include <DOM/ISlide.h>
#include <DOM/Presentation.h>
#include <Export/SaveFormat.h>

using namespace System;
using namespace Aspose::Slides;
using namespace Aspose::Slides::Charts;
using namespace Aspose::Slides::Export;

auto presentation = MakeObject<Presentation>();
auto slide = presentation->get_Slide(0);

auto chart = slide->get_Shapes()->AddChart(ChartType::Map, 20, 20, 500, 300);

presentation->Save(u"mapChart.pptx", SaveFormat::Pptx);
Az eredmény:
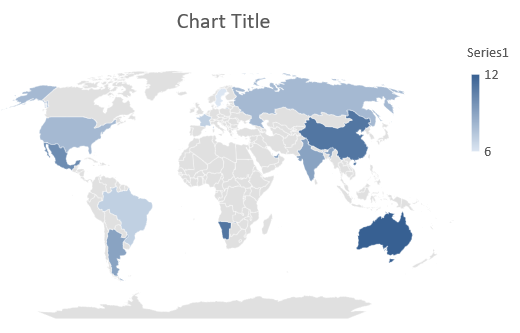
Note
A fenti kép a PowerPointban megnyitott, elmentett prezentációt mutatja. Az Aspose.Slides helyesen írja a térképadagramot és annak adatait, de maga a diagram nem kerül megrajzolásra: amikor egy olyan diát, amely tartalmaz diagramot, képpé renderelik, PDF‑re vagy SVG‑re konvertálják, a diagram területe üres marad. A többi alakzat a dián érintetlen marad.Kombinációs diagramok létrehozása
A kombinációs diagram (vagy combo diagram) több diagramtípust egyesít egyetlen grafikonban. Ez a diagram lehetővé teszi, hogy kiemelje, összehasonlítsa vagy megvizsgálja a két vagy több adathalmaz közötti különbségeket, segítve a köztük lévő kapcsolatok azonosítását.
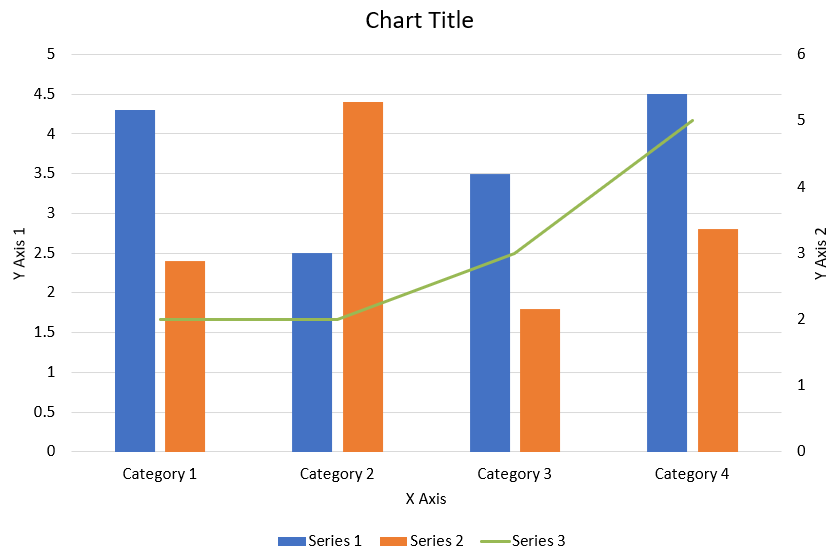
Ez a példa két csoportos oszlop sorozatot kombinál egy vonal sorozattal négy kategórián keresztül. Az oszlopok az elsődleges függőleges tengelyt használják, míg a set_PlotOnSecondAxis a vonalat a jobb oldalon lévő másodlagos függőleges tengelyre helyezi. A segédfüggvények beállítják a címet, a jelmagyarázatot, a tengelycímkéket és a rácsvonalakat.
#include <DOM/Chart/IChartLinesFormat.h>
#include <DOM/Chart/IChartPortionFormat.h>
#include <DOM/Chart/IAxisFormat.h>
#include <system/shared_ptr.h>
#include <system/object_ext.h>
#include <system/string.h>
#include <drawing/color.h>
#include <DOM/Chart/AxisPositionType.h>
#include <DOM/Chart/ChartType.h>
#include <DOM/Chart/CrossesType.h>
#include <DOM/Chart/IAxesManager.h>
#include <DOM/Chart/IAxis.h>
#include <DOM/Chart/IChartCategoryCollection.h>
#include <DOM/Chart/IChartData.h>
#include <DOM/Chart/IChartDataCell.h>
#include <DOM/Chart/IChartDataPoint.h>
#include <DOM/Chart/IChartDataPointCollection.h>
#include <DOM/Chart/IChartDataWorkbook.h>
#include <DOM/Chart/IChartSeries.h>
#include <DOM/Chart/IChartSeriesCollection.h>
#include <DOM/Chart/IChartSeriesGroup.h>
#include <DOM/Chart/IChartSeriesGroupCollection.h>
#include <DOM/Chart/IChartTextFormat.h>
#include <DOM/Chart/IChartTitle.h>
#include <DOM/Chart/IFormat.h>
#include <DOM/Chart/ILegend.h>
#include <DOM/Chart/LegendPositionType.h>
#include <DOM/FillType.h>
#include <DOM/IChart.h>
#include <DOM/IColorFormat.h>
#include <DOM/IFillFormat.h>
#include <DOM/ILineFillFormat.h>
#include <DOM/ILineFormat.h>
#include <DOM/IParagraph.h>
#include <DOM/IParagraphCollection.h>
#include <DOM/IParagraphFormat.h>
#include <DOM/IPortionFormat.h>
#include <DOM/IShapeCollection.h>
#include <DOM/ISlide.h>
#include <DOM/ITextFrame.h>
#include <DOM/ITextFrameFormat.h>
#include <DOM/NullableBool.h>
#include <DOM/Presentation.h>
#include <Export/SaveFormat.h>

using namespace System;
using namespace System::Drawing;
using namespace Aspose::Slides;
using namespace Aspose::Slides::Charts;
using namespace Aspose::Slides::Export;

struct ComboChartExample
{
    static void CreateComboChart()
    {
        auto presentation = MakeObject<Presentation>();
        auto chart = CreateChartWithFirstSeries(presentation->get_Slide(0));

        AddSecondSeriesToChart(chart);
        AddThirdSeriesToChart(chart);

        SetPrimaryAxesFormat(chart);
        SetSecondaryAxesFormat(chart);

        presentation->Save(u"combo-chart.pptx", SaveFormat::Pptx);
    }

    static SharedPtr<IChart> CreateChartWithFirstSeries(SharedPtr<ISlide> slide)
    {
        auto chart = slide->get_Shapes()->AddChart(ChartType::ClusteredColumn, 50, 50, 600, 400);

        chart->set_HasTitle(true);
        chart->get_ChartTitle()->AddTextFrameForOverriding(u"Chart Title");
        chart->get_ChartTitle()->set_Overlay(false);
        auto portionFormat = chart->get_ChartTitle()->get_TextFrameForOverriding()->get_Paragraphs()->idx_get(0)->get_ParagraphFormat()->get_DefaultPortionFormat();
        portionFormat->set_FontBold(NullableBool::False);
        portionFormat->set_FontHeight(18.0f);

        chart->get_Legend()->set_Position(LegendPositionType::Bottom);
        chart->get_Legend()->get_TextFormat()->get_PortionFormat()->set_FontHeight(12.0f);

        chart->get_ChartData()->get_Series()->Clear();
        chart->get_ChartData()->get_Categories()->Clear();

        auto workbook = chart->get_ChartData()->get_ChartDataWorkbook();
        auto worksheetIndex = 0;

        auto categoryCell = workbook->GetCell(worksheetIndex, 1, 0, ObjectExt::Box(String(u"Category 1")));
        chart->get_ChartData()->get_Categories()->Add(categoryCell);
        categoryCell = workbook->GetCell(worksheetIndex, 2, 0, ObjectExt::Box(String(u"Category 2")));
        chart->get_ChartData()->get_Categories()->Add(categoryCell);
        categoryCell = workbook->GetCell(worksheetIndex, 3, 0, ObjectExt::Box(String(u"Category 3")));
        chart->get_ChartData()->get_Categories()->Add(categoryCell);
        categoryCell = workbook->GetCell(worksheetIndex, 4, 0, ObjectExt::Box(String(u"Category 4")));
        chart->get_ChartData()->get_Categories()->Add(categoryCell);

        auto seriesNameCell = workbook->GetCell(worksheetIndex, 0, 1, ObjectExt::Box(String(u"Series 1")));
        auto series = chart->get_ChartData()->get_Series()->Add(seriesNameCell, chart->get_Type());

        series->get_ParentSeriesGroup()->set_Overlap(-25);
        series->get_ParentSeriesGroup()->set_GapWidth(220);

        auto valueCell = workbook->GetCell(worksheetIndex, 1, 1, ObjectExt::Box(4.3));
        series->get_DataPoints()->AddDataPointForBarSeries(valueCell);
        valueCell = workbook->GetCell(worksheetIndex, 2, 1, ObjectExt::Box(2.5));
        series->get_DataPoints()->AddDataPointForBarSeries(valueCell);
        valueCell = workbook->GetCell(worksheetIndex, 3, 1, ObjectExt::Box(3.5));
        series->get_DataPoints()->AddDataPointForBarSeries(valueCell);
        valueCell = workbook->GetCell(worksheetIndex, 4, 1, ObjectExt::Box(4.5));
        series->get_DataPoints()->AddDataPointForBarSeries(valueCell);

        return chart;
    }

    static void AddSecondSeriesToChart(SharedPtr<IChart> chart)
    {
        auto workbook = chart->get_ChartData()->get_ChartDataWorkbook();
        const int worksheetIndex = 0;

        auto seriesNameCell = workbook->GetCell(worksheetIndex, 0, 2, ObjectExt::Box(String(u"Series 2")));
        auto series = chart->get_ChartData()->get_Series()->Add(seriesNameCell, ChartType::ClusteredColumn);

        series->get_ParentSeriesGroup()->set_Overlap(-25);
        series->get_ParentSeriesGroup()->set_GapWidth(220);

        auto valueCell = workbook->GetCell(worksheetIndex, 1, 2, ObjectExt::Box(2.4));
        series->get_DataPoints()->AddDataPointForBarSeries(valueCell);
        valueCell = workbook->GetCell(worksheetIndex, 2, 2, ObjectExt::Box(4.4));
        series->get_DataPoints()->AddDataPointForBarSeries(valueCell);
        valueCell = workbook->GetCell(worksheetIndex, 3, 2, ObjectExt::Box(1.8));
        series->get_DataPoints()->AddDataPointForBarSeries(valueCell);
        valueCell = workbook->GetCell(worksheetIndex, 4, 2, ObjectExt::Box(2.8));
        series->get_DataPoints()->AddDataPointForBarSeries(valueCell);
    }

    static void AddThirdSeriesToChart(SharedPtr<IChart> chart)
    {
        auto workbook = chart->get_ChartData()->get_ChartDataWorkbook();
        const int worksheetIndex = 0;

        auto seriesNameCell = workbook->GetCell(worksheetIndex, 0, 3, ObjectExt::Box(String(u"Series 3")));
        auto series = chart->get_ChartData()->get_Series()->Add(seriesNameCell, ChartType::Line);

        auto valueCell = workbook->GetCell(worksheetIndex, 1, 3, ObjectExt::Box(2.0));
        series->get_DataPoints()->AddDataPointForLineSeries(valueCell);
        valueCell = workbook->GetCell(worksheetIndex, 2, 3, ObjectExt::Box(2.0));
        series->get_DataPoints()->AddDataPointForLineSeries(valueCell);
        valueCell = workbook->GetCell(worksheetIndex, 3, 3, ObjectExt::Box(3.0));
        series->get_DataPoints()->AddDataPointForLineSeries(valueCell);
        valueCell = workbook->GetCell(worksheetIndex, 4, 3, ObjectExt::Box(5.0));
        series->get_DataPoints()->AddDataPointForLineSeries(valueCell);

        series->set_PlotOnSecondAxis(true);
    }

    static void SetPrimaryAxesFormat(SharedPtr<IChart> chart)
    {
        auto horizontalAxis = chart->get_Axes()->get_HorizontalAxis();
        horizontalAxis->get_TextFormat()->get_PortionFormat()->set_FontHeight(12.0f);
        horizontalAxis->get_Format()->get_Line()->get_FillFormat()->set_FillType(FillType::NoFill);

        SetAxisTitle(horizontalAxis, u"X Axis");

        auto verticalAxis = chart->get_Axes()->get_VerticalAxis();
        verticalAxis->get_TextFormat()->get_PortionFormat()->set_FontHeight(12.0f);
        verticalAxis->get_Format()->get_Line()->get_FillFormat()->set_FillType(FillType::NoFill);

        SetAxisTitle(verticalAxis, u"Y Axis 1");

        auto majorGridLinesFormat = verticalAxis->get_MajorGridLinesFormat()->get_Line()->get_FillFormat();
        majorGridLinesFormat->set_FillType(FillType::Solid);
        majorGridLinesFormat->get_SolidFillColor()->set_Color(Color::FromArgb(217, 217, 217));
    }

    static void SetSecondaryAxesFormat(SharedPtr<IChart> chart)
    {
        auto secondaryHorizontalAxis = chart->get_Axes()->get_SecondaryHorizontalAxis();
        secondaryHorizontalAxis->set_Position(AxisPositionType::Bottom);
        secondaryHorizontalAxis->set_CrossType(CrossesType::Maximum);
        secondaryHorizontalAxis->set_IsVisible(false);
        secondaryHorizontalAxis->get_MajorGridLinesFormat()->get_Line()->get_FillFormat()->set_FillType(FillType::NoFill);
        secondaryHorizontalAxis->get_MinorGridLinesFormat()->get_Line()->get_FillFormat()->set_FillType(FillType::NoFill);

        auto secondaryVerticalAxis = chart->get_Axes()->get_SecondaryVerticalAxis();
        secondaryVerticalAxis->set_Position(AxisPositionType::Right);
        secondaryVerticalAxis->get_TextFormat()->get_PortionFormat()->set_FontHeight(12.0f);
        secondaryVerticalAxis->get_Format()->get_Line()->get_FillFormat()->set_FillType(FillType::NoFill);
        secondaryVerticalAxis->get_MajorGridLinesFormat()->get_Line()->get_FillFormat()->set_FillType(FillType::NoFill);
        secondaryVerticalAxis->get_MinorGridLinesFormat()->get_Line()->get_FillFormat()->set_FillType(FillType::NoFill);

        SetAxisTitle(secondaryVerticalAxis, u"Y Axis 2");
    }

    static void SetAxisTitle(SharedPtr<IAxis> axis, String axisTitle)
    {
        axis->set_HasTitle(true);
        axis->get_Title()->set_Overlay(false);
        auto titlePortionFormat = axis->get_Title()->AddTextFrameForOverriding(axisTitle)->get_Paragraphs()->idx_get(0)->get_ParagraphFormat()->get_DefaultPortionFormat();
        titlePortionFormat->set_FontBold(NullableBool::False);
        titlePortionFormat->set_FontHeight(12.0f);
    }
};

ComboChartExample::CreateComboChart();
Diagramok frissítése
Az Aspose.Slides for C++ lehetővé teszi, hogy PowerPoint diagramokat frissítsen a diagramadatok, a formázás és a stílus módosításával. Ez a funkció egyszerűsíti a prezentációk naprakészen tartását dinamikus tartalommal, és biztosítja, hogy a diagramok pontosan tükrözzék az aktuális adatokat és vizuális szabványokat.
Ez a példa frissíti a “My chart” nevű diagramot az első dián egy meglévő prezentációban. Két oszlop sorozatra van szükség, mindegyik három adatponttal, a kategóriacímkék az A oszlopban, a sorozatnevek az első munkalap első sorában. A példa a GetCell metódussal módosítja a munkafüzet celláit, frissíti a sorozat értékeket, hozzáad egy harmadik sorozatot, és a diagramot csoportos henger formára változtatja a set_Type metódussal.
#include <system/shared_ptr.h>
#include <system/object_ext.h>
#include <system/string.h>
#include <DOM/Chart/ChartType.h>
#include <DOM/Chart/IChartCategoryCollection.h>
#include <DOM/Chart/IChartData.h>
#include <DOM/Chart/IChartDataCell.h>
#include <DOM/Chart/IChartDataPoint.h>
#include <DOM/Chart/IChartDataPointCollection.h>
#include <DOM/Chart/IChartDataWorkbook.h>
#include <DOM/Chart/IChartSeries.h>
#include <DOM/Chart/IChartSeriesCollection.h>
#include <DOM/Chart/IDoubleChartValue.h>
#include <DOM/Chart/IFormat.h>
#include <DOM/IChart.h>
#include <DOM/IColorFormat.h>
#include <DOM/IFillFormat.h>
#include <DOM/ILineFillFormat.h>
#include <DOM/ILineFormat.h>
#include <DOM/IShape.h>
#include <DOM/IShapeCollection.h>
#include <DOM/ISlide.h>
#include <DOM/Presentation.h>
#include <Export/SaveFormat.h>

using namespace System;
using namespace Aspose::Slides;
using namespace Aspose::Slides::Charts;
using namespace Aspose::Slides::Export;

const String chartName = u"My chart";

auto presentation = MakeObject<Presentation>(u"ExistingChart.pptx");
auto slide = presentation->get_Slide(0);

for (auto shape : slide->get_Shapes())
{
    auto chart = System::DynamicCast<IChart>(shape);
    if (chart != nullptr && chart->get_Name() == chartName)
    {
        auto worksheetIndex = 0;

        auto workbook = chart->get_ChartData()->get_ChartDataWorkbook();

        workbook->GetCell(worksheetIndex, 1, 0, ObjectExt::Box(String(u"Modified Category 1")));
        workbook->GetCell(worksheetIndex, 2, 0, ObjectExt::Box(String(u"Modified Category 2")));

        auto series = chart->get_ChartData()->get_Series()->idx_get(0);

        workbook->GetCell(worksheetIndex, 0, 1, ObjectExt::Box(String(u"New_Series 1")));
        series->get_DataPoints()->idx_get(0)->get_Value()->set_Data(ObjectExt::Box(90));
        series->get_DataPoints()->idx_get(1)->get_Value()->set_Data(ObjectExt::Box(123));
        series->get_DataPoints()->idx_get(2)->get_Value()->set_Data(ObjectExt::Box(44));

        series = chart->get_ChartData()->get_Series()->idx_get(1);

        workbook->GetCell(worksheetIndex, 0, 2, ObjectExt::Box(String(u"New_Series 2")));
        series->get_DataPoints()->idx_get(0)->get_Value()->set_Data(ObjectExt::Box(23));
        series->get_DataPoints()->idx_get(1)->get_Value()->set_Data(ObjectExt::Box(67));
        series->get_DataPoints()->idx_get(2)->get_Value()->set_Data(ObjectExt::Box(99));

        auto seriesNameCell = workbook->GetCell(worksheetIndex, 0, 3, ObjectExt::Box(String(u"Series 3")));
        series = chart->get_ChartData()->get_Series()->Add(seriesNameCell, chart->get_Type());

        auto valueCell = workbook->GetCell(worksheetIndex, 1, 3, ObjectExt::Box(20));
        series->get_DataPoints()->AddDataPointForBarSeries(valueCell);
        valueCell = workbook->GetCell(worksheetIndex, 2, 3, ObjectExt::Box(50));
        series->get_DataPoints()->AddDataPointForBarSeries(valueCell);
        valueCell = workbook->GetCell(worksheetIndex, 3, 3, ObjectExt::Box(30));
        series->get_DataPoints()->AddDataPointForBarSeries(valueCell);

        chart->set_Type(ChartType::ClusteredCylinder);
    }
}

presentation->Save(u"AsposeChartModified.pptx", SaveFormat::Pptx);
Adattartomány beállítása diagramhoz
A már meglévő diagram által használt tartomány megtekintéséhez lásd a Retrieve a Chart’s Data Range oldalt.
Az Aspose.Slides for C++ rugalmasságot biztosít egy adott munkalap adatainak meghatározott tartományként való megadásához diagram adatforrásként. Ez lehetővé teszi, hogy közvetlenül egy munkalap részt leképezze a diagramra, és irányíthassa, mely cellák járulnak hozzá a diagram sorozataihoz és kategóriáihoz. Ennek eredményeként könnyen frissítheti és szinkronizálhatja diagramjait a munkalap legújabb adatváltozásaival, biztosítva, hogy a PowerPoint prezentációk aktuális és pontos információkat tartalmazzanak.
Ez a példa a SetRange metódust használja a “My chart” nevű diagram adatforrásának beállításához az első dián egy meglévő prezentációban a Sheet1!A1:B4 tartományra. A diagram munkafüzetének tartalmaznia kell azt a munkalapot és egy feltöltött tartományt, ahol az első sor a sorozatfejlécek, az A oszlop a kategóriacímkék, a B oszlop három érték.
#include <system/shared_ptr.h>
#include <DOM/Chart/ChartType.h>
#include <DOM/Chart/IChartCategoryCollection.h>
#include <DOM/Chart/IChartData.h>
#include <DOM/Chart/IChartSeriesCollection.h>
#include <DOM/Chart/IFormat.h>
#include <DOM/IChart.h>
#include <DOM/IColorFormat.h>
#include <DOM/IFillFormat.h>
#include <DOM/ILineFillFormat.h>
#include <DOM/ILineFormat.h>
#include <DOM/IShape.h>
#include <DOM/IShapeCollection.h>
#include <DOM/ISlide.h>
#include <DOM/Presentation.h>
#include <Export/SaveFormat.h>

using namespace System;
using namespace Aspose::Slides;
using namespace Aspose::Slides::Charts;
using namespace Aspose::Slides::Export;

const String chartName = u"My chart";

auto presentation = MakeObject<Presentation>(u"ExistingChart.pptx");
auto slide = presentation->get_Slide(0);

for (auto shape : slide->get_Shapes())
{
    auto chart = System::DynamicCast<IChart>(shape);
    if (chart != nullptr && chart->get_Name() == chartName)
    {
        chart->get_ChartData()->SetRange(u"Sheet1!A1:B4");
    }
}

presentation->Save(u"SetDataRange.pptx", SaveFormat::Pptx);
Alapértelmezett jelzők használata diagramokban
Alapértelmezett jelzők használatakor a diagram sorozatai automatikusan különböző alapértelmezett jelzőszimbólumot kapnak.
Ez a példa a AddChart metódust használja egy diagram létrehozásához két vonal sorozattal és egy jelmagyarázattal. A get_Marker beállítások megtartják az automatikusan hozzárendelt jelzőszimbólumokat. Az első sorozat negatív értéket és hiányzó értéket tartalmaz (nullptr), míg a második minden kategóriához értéket ad.
#include <system/shared_ptr.h>
#include <system/object_ext.h>
#include <system/string.h>
#include <DOM/Chart/ChartType.h>
#include <DOM/Chart/IChartCategoryCollection.h>
#include <DOM/Chart/IChartData.h>
#include <DOM/Chart/IChartDataCell.h>
#include <DOM/Chart/IChartDataPoint.h>
#include <DOM/Chart/IChartDataPointCollection.h>
#include <DOM/Chart/IChartDataWorkbook.h>
#include <DOM/Chart/IChartSeries.h>
#include <DOM/Chart/IChartSeriesCollection.h>
#include <DOM/Chart/IChartTextFormat.h>
#include <DOM/Chart/IFormat.h>
#include <DOM/Chart/ILegend.h>
#include <DOM/Chart/IMarker.h>
#include <DOM/IChart.h>
#include <DOM/IColorFormat.h>
#include <DOM/IFillFormat.h>
#include <DOM/ILineFillFormat.h>
#include <DOM/ILineFormat.h>
#include <DOM/IPortionFormat.h>
#include <DOM/IShapeCollection.h>
#include <DOM/ISlide.h>
#include <DOM/Presentation.h>
#include <Export/SaveFormat.h>

using namespace System;
using namespace Aspose::Slides;
using namespace Aspose::Slides::Charts;
using namespace Aspose::Slides::Export;

auto presentation = MakeObject<Presentation>();
auto slide = presentation->get_Slide(0);

auto chart = slide->get_Shapes()->AddChart(ChartType::LineWithMarkers, 10, 10, 400, 400);

chart->get_ChartData()->get_Series()->Clear();
chart->get_ChartData()->get_Categories()->Clear();

auto workbook = chart->get_ChartData()->get_ChartDataWorkbook();

auto seriesNameCell = workbook->GetCell(0, 0, 1, ObjectExt::Box(String(u"Series 1")));
auto series = chart->get_ChartData()->get_Series()->Add(seriesNameCell, chart->get_Type());

auto categoryCell = workbook->GetCell(0, 1, 0, ObjectExt::Box(String(u"C1")));
chart->get_ChartData()->get_Categories()->Add(categoryCell);
auto valueCell = workbook->GetCell(0, 1, 1, ObjectExt::Box(24));
series->get_DataPoints()->AddDataPointForLineSeries(valueCell);

categoryCell = workbook->GetCell(0, 2, 0, ObjectExt::Box(String(u"C2")));
chart->get_ChartData()->get_Categories()->Add(categoryCell);
valueCell = workbook->GetCell(0, 2, 1, ObjectExt::Box(23));
series->get_DataPoints()->AddDataPointForLineSeries(valueCell);

categoryCell = workbook->GetCell(0, 3, 0, ObjectExt::Box(String(u"C3")));
chart->get_ChartData()->get_Categories()->Add(categoryCell);
valueCell = workbook->GetCell(0, 3, 1, ObjectExt::Box(-10));
series->get_DataPoints()->AddDataPointForLineSeries(valueCell);

categoryCell = workbook->GetCell(0, 4, 0, ObjectExt::Box(String(u"C4")));
chart->get_ChartData()->get_Categories()->Add(categoryCell);
valueCell = workbook->GetCell(0, 4, 1, nullptr);
series->get_DataPoints()->AddDataPointForLineSeries(valueCell);

seriesNameCell = workbook->GetCell(0, 0, 2, ObjectExt::Box(String(u"Series 2")));
auto secondSeries = chart->get_ChartData()->get_Series()->Add(seriesNameCell, chart->get_Type());

valueCell = workbook->GetCell(0, 1, 2, ObjectExt::Box(30));
secondSeries->get_DataPoints()->AddDataPointForLineSeries(valueCell);
valueCell = workbook->GetCell(0, 2, 2, ObjectExt::Box(10));
secondSeries->get_DataPoints()->AddDataPointForLineSeries(valueCell);
valueCell = workbook->GetCell(0, 3, 2, ObjectExt::Box(60));
secondSeries->get_DataPoints()->AddDataPointForLineSeries(valueCell);
valueCell = workbook->GetCell(0, 4, 2, ObjectExt::Box(40));
secondSeries->get_DataPoints()->AddDataPointForLineSeries(valueCell);

chart->set_HasLegend(true);
chart->get_Legend()->set_Overlay(false);

presentation->Save(u"DefaultMarkersInChart.pptx", SaveFormat::Pptx);
GYIK
Milyen diagramtípusok támogatottak az Aspose.Slides for C++‑ban?
Az Aspose.Slides for C++ számos diagramtípust támogat, köztük oszlop, vonal, kör, terület, pont, hisztogram, radar és sok más. Ez a rugalmasság lehetővé teszi, hogy az adatvizualizációs igényeinek legmegfelelőbb diagramtípust válassza.
Hogyan adhatok új diagramot egy diához?
Új diagram hozzáadásához először hozza létre a Presentation osztály egy példányát, szerezze meg a kívánt diát az indexe alapján, majd hívja meg a diagram hozzáadásához szükséges metódust, megadva a diagramtípust és a kezdeti adatokat. Ez a folyamat közvetlenül integrálja a diagramot a prezentációba.
Hogyan frissíthetem a diagramban megjelenített adatokat?
A diagram adatait a IChartDataWorkbook elérésével, az alapértelmezett sorozatokat és kategóriákat törölve, majd saját adatait hozzáadva frissítheti. Ez lehetővé teszi, hogy programozottan frissítse a diagramot a legújabb adatokkal.
Lehívható-e a diagram megjelenésének testéről testre szabása?
Igen, az Aspose.Slides for C++ kiterjedt testreszabási lehetőségeket biztosít. Módosíthatja a színeket, betűtípusokat, címkéket, jelmagyarázatokat és egyéb formázási elemeket, hogy a diagram megjelenését az Ön konkrét tervezési követelményeihez igazítsa.