
C++ में PowerPoint प्रस्तुति चार्ट बनाएं या अपडेट करें
अवलोकन
यह लेख Aspose.Slides for C++ का उपयोग करके चार्ट बनाने और अनुकूलित करने के लिए एक व्यापक गाइड प्रदान करता है। आप सीखेंगे कि प्रोग्रामmatically एक स्लाइड में चार्ट कैसे जोड़ें, उसे डेटा से भरें, और आपके विशिष्ट डिज़ाइन आवश्यकताओं को पूरा करने के लिए विभिन्न फ़ॉर्मेटिंग विकल्प कैसे लागू करें। पूरे लेख में विस्तृत कोड उदाहरण प्रत्येक चरण को स्पष्ट करते हैं, प्रस्तुति और चार्ट ऑब्जेक्ट को आरंभ करने से लेकर सीरीज़, एक्सिस, और लेजेंड को कॉन्फ़िगर करने तक। इस गाइड का पालन करके आप अपने C++ एप्लिकेशन में डायनेमिक चार्ट जेनरेशन को एकीकृत करने की ठोस समझ प्राप्त करेंगे, जिससे डेटा‑ड्रिवन प्रस्तुतियों का निर्माण सरल हो जाएगा।
चार्ट बनाएं
चार्ट लोगों को डेटा को तेज़ी से विज़ुअलाइज़ करने और उन अंतर्दृष्टियों को प्राप्त करने में मदद करते हैं जो तालिका या स्प्रेडशीट से तुरंत स्पष्ट नहीं होते।
क्यों चार्ट बनाएं?
- प्रस्तुति में एक स्लाइड पर बड़े मात्रा में डेटा को एकत्रित, सघन या सारांशित करना;
- डेटा में पैटर्न और रुझानों को उजागर करना;
- समय के साथ या विशिष्ट माप इकाई के संबंध में डेटा की दिशा और गति का अनुमान लगाना;
- असामान्य मान, विकृति, विचलन, त्रुटियों और अव्यवस्थित डेटा को पहचानना;
- जटिल डेटा को संप्रेषित या प्रस्तुत करना।
PowerPoint में, आप Insert फ़ंक्शन के माध्यम से चार्ट बना सकते हैं, जो कई प्रकार के चार्ट डिज़ाइन करने के लिए टेम्प्लेट प्रदान करता है। Aspose.Slides का उपयोग करके आप नियमित चार्ट (लोकप्रिय चार्ट प्रकारों पर आधारित) और कस्टम चार्ट दोनों बना सकते हैं।
Note
ChartType enumeration को Aspose::Slides::Charts नामस्थान के तहत उपयोग करें। इस enumeration में मान विभिन्न चार्ट प्रकारों से मेल खाते हैं।क्लस्टर्ड कॉलम चार्ट बनाएं
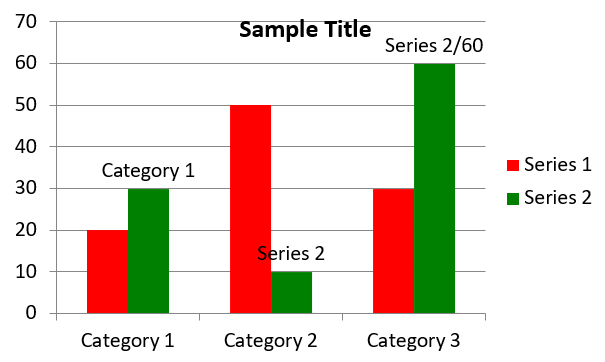
यह उदाहरण दो सीरीज़ को तीन श्रेणियों में तुलना करने वाला क्लस्टर्ड कॉलम चार्ट बनाता है, जिसके लिए आप AddChart का उपयोग करते हैं। सीरीज़ लाल और हरे रंग से भरते हैं, और व्यक्तिगत लेबल श्रेणी नाम, सीरीज़ नाम, और मान दर्शाते हैं। वर्कशीट इंडेक्स 0 एम्बेडेड चार्ट वर्कबुक की पहली शीट को संदर्भित करता है।
#include <system/shared_ptr.h>
#include <system/object_ext.h>
#include <system/string.h>
#include <drawing/color.h>
#include <DOM/Chart/ChartType.h>
#include <DOM/Chart/IChartCategoryCollection.h>
#include <DOM/Chart/IChartData.h>
#include <DOM/Chart/IChartDataCell.h>
#include <DOM/Chart/IChartDataPoint.h>
#include <DOM/Chart/IChartDataPointCollection.h>
#include <DOM/Chart/IChartDataWorkbook.h>
#include <DOM/Chart/IChartSeries.h>
#include <DOM/Chart/IChartSeriesCollection.h>
#include <DOM/Chart/IChartTitle.h>
#include <DOM/Chart/IDataLabel.h>
#include <DOM/Chart/IDataLabelCollection.h>
#include <DOM/Chart/IDataLabelFormat.h>
#include <DOM/Chart/IDoubleChartValue.h>
#include <DOM/Chart/IFormat.h>
#include <DOM/FillType.h>
#include <DOM/IChart.h>
#include <DOM/IColorFormat.h>
#include <DOM/IFillFormat.h>
#include <DOM/ILineFillFormat.h>
#include <DOM/ILineFormat.h>
#include <DOM/IShapeCollection.h>
#include <DOM/ISlide.h>
#include <DOM/ITextFrame.h>
#include <DOM/ITextFrameFormat.h>
#include <DOM/NullableBool.h>
#include <DOM/Presentation.h>
#include <Export/SaveFormat.h>

using namespace System;
using namespace System::Drawing;
using namespace Aspose::Slides;
using namespace Aspose::Slides::Charts;
using namespace Aspose::Slides::Export;

auto presentation = MakeObject<Presentation>();
auto slide = presentation->get_Slide(0);

auto chart = slide->get_Shapes()->AddChart(ChartType::ClusteredColumn, 20, 20, 500, 300);

chart->get_ChartTitle()->AddTextFrameForOverriding(u"Sample Title");
chart->get_ChartTitle()->get_TextFrameForOverriding()->get_TextFrameFormat()->set_CenterText(NullableBool::True);
chart->get_ChartTitle()->set_Height(20);
chart->set_HasTitle(true);

auto workbook = chart->get_ChartData()->get_ChartDataWorkbook();
auto worksheetIndex = 0;

chart->get_ChartData()->get_Series()->Clear();
chart->get_ChartData()->get_Categories()->Clear();

auto seriesNameCell = workbook->GetCell(worksheetIndex, 0, 1, ObjectExt::Box(String(u"Series 1")));
chart->get_ChartData()->get_Series()->Add(seriesNameCell, chart->get_Type());
seriesNameCell = workbook->GetCell(worksheetIndex, 0, 2, ObjectExt::Box(String(u"Series 2")));
chart->get_ChartData()->get_Series()->Add(seriesNameCell, chart->get_Type());

auto categoryCell = workbook->GetCell(worksheetIndex, 1, 0, ObjectExt::Box(String(u"Category 1")));
chart->get_ChartData()->get_Categories()->Add(categoryCell);
categoryCell = workbook->GetCell(worksheetIndex, 2, 0, ObjectExt::Box(String(u"Category 2")));
chart->get_ChartData()->get_Categories()->Add(categoryCell);
categoryCell = workbook->GetCell(worksheetIndex, 3, 0, ObjectExt::Box(String(u"Category 3")));
chart->get_ChartData()->get_Categories()->Add(categoryCell);

auto series = chart->get_ChartData()->get_Series()->idx_get(0);

auto valueCell = workbook->GetCell(worksheetIndex, 1, 1, ObjectExt::Box(20));
series->get_DataPoints()->AddDataPointForBarSeries(valueCell);
valueCell = workbook->GetCell(worksheetIndex, 2, 1, ObjectExt::Box(50));
series->get_DataPoints()->AddDataPointForBarSeries(valueCell);
valueCell = workbook->GetCell(worksheetIndex, 3, 1, ObjectExt::Box(30));
series->get_DataPoints()->AddDataPointForBarSeries(valueCell);

series->get_Format()->get_Fill()->set_FillType(FillType::Solid);
series->get_Format()->get_Fill()->get_SolidFillColor()->set_Color(Color::get_Red());

series = chart->get_ChartData()->get_Series()->idx_get(1);

valueCell = workbook->GetCell(worksheetIndex, 1, 2, ObjectExt::Box(30));
series->get_DataPoints()->AddDataPointForBarSeries(valueCell);
valueCell = workbook->GetCell(worksheetIndex, 2, 2, ObjectExt::Box(10));
series->get_DataPoints()->AddDataPointForBarSeries(valueCell);
valueCell = workbook->GetCell(worksheetIndex, 3, 2, ObjectExt::Box(60));
series->get_DataPoints()->AddDataPointForBarSeries(valueCell);

series->get_Format()->get_Fill()->set_FillType(FillType::Solid);
series->get_Format()->get_Fill()->get_SolidFillColor()->set_Color(Color::get_Green());

auto label = series->get_DataPoints()->idx_get(0)->get_Label();
label->get_DataLabelFormat()->set_ShowCategoryName(true);

label = series->get_DataPoints()->idx_get(1)->get_Label();
label->get_DataLabelFormat()->set_ShowSeriesName(true);

label = series->get_DataPoints()->idx_get(2)->get_Label();
label->get_DataLabelFormat()->set_ShowValue(true);
label->get_DataLabelFormat()->set_ShowSeriesName(true);
label->get_DataLabelFormat()->set_Separator(u"/");

presentation->Save(u"AsposeChart.pptx", SaveFormat::Pptx);
परिणाम:
स्कैटर चार्ट बनाएं
स्कैटर चार्ट (जिन्हें स्कैटर प्लॉट या X‑Y ग्राफ़ भी कहा जाता है) अक्सर दो चर के बीच पैटर्न या सहसम्बंध जांचने के लिए उपयोग किए जाते हैं।
स्कैटर चार्ट तब उपयोग करें जब:
- आपके पास युग्मित संख्यात्मक डेटा है।
- आपके पास दो चर हैं जो एक साथ अच्छी तरह से जुड़े होते हैं।
- आप यह निर्धारित करना चाहते हैं कि दो चर संबंधित हैं या नहीं।
- आपके पास एक स्वतंत्र चर है जिसका कई मान आश्रित चर के लिए हैं।
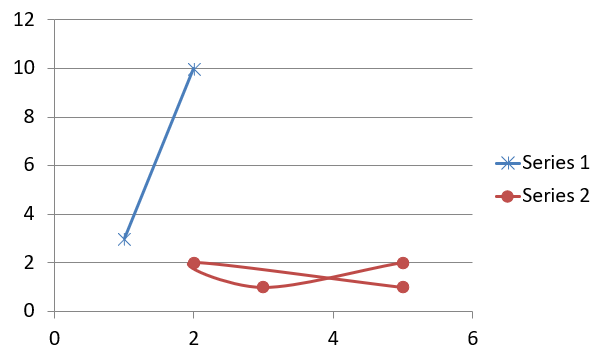
यह उदाहरण दो सेट के X‑Y मान प्लॉट करता है। पहली सीरीज़ तारांकन मार्कर वाले सीधी रेखाओं का उपयोग करती है, जबकि दूसरी स्मूथ रेखाओं के साथ वृत्ताकार मार्कर का; दोनों में मार्कर आकार 10 है, जिसे आप set_Size से सेट करते हैं। set_Symbol विधि मार्कर आकार नियंत्रित करती है।
#include <system/shared_ptr.h>
#include <system/object_ext.h>
#include <system/string.h>
#include <DOM/Chart/ChartType.h>
#include <DOM/Chart/IChartCategoryCollection.h>
#include <DOM/Chart/IChartData.h>
#include <DOM/Chart/IChartDataCell.h>
#include <DOM/Chart/IChartDataPoint.h>
#include <DOM/Chart/IChartDataPointCollection.h>
#include <DOM/Chart/IChartDataWorkbook.h>
#include <DOM/Chart/IChartSeries.h>
#include <DOM/Chart/IChartSeriesCollection.h>
#include <DOM/Chart/IDoubleChartValue.h>
#include <DOM/Chart/IFormat.h>
#include <DOM/Chart/IMarker.h>
#include <DOM/Chart/MarkerStyleType.h>
#include <DOM/IChart.h>
#include <DOM/IColorFormat.h>
#include <DOM/IFillFormat.h>
#include <DOM/ILineFillFormat.h>
#include <DOM/ILineFormat.h>
#include <DOM/IShapeCollection.h>
#include <DOM/ISlide.h>
#include <DOM/Presentation.h>
#include <Export/SaveFormat.h>

using namespace System;
using namespace Aspose::Slides;
using namespace Aspose::Slides::Charts;
using namespace Aspose::Slides::Export;

auto presentation = MakeObject<Presentation>();
auto slide = presentation->get_Slide(0);

auto chart = slide->get_Shapes()->AddChart(ChartType::ScatterWithSmoothLines, 20, 20, 500, 300);

auto workbook = chart->get_ChartData()->get_ChartDataWorkbook();
auto worksheetIndex = 0;

chart->get_ChartData()->get_Series()->Clear();

auto seriesNameCell = workbook->GetCell(worksheetIndex, 1, 1, ObjectExt::Box(String(u"Series 1")));
chart->get_ChartData()->get_Series()->Add(seriesNameCell, chart->get_Type());
seriesNameCell = workbook->GetCell(worksheetIndex, 1, 3, ObjectExt::Box(String(u"Series 2")));
chart->get_ChartData()->get_Series()->Add(seriesNameCell, chart->get_Type());

auto series = chart->get_ChartData()->get_Series()->idx_get(0);

auto xValueCell = workbook->GetCell(worksheetIndex, 2, 1, ObjectExt::Box(1));
auto yValueCell = workbook->GetCell(worksheetIndex, 2, 2, ObjectExt::Box(3));
series->get_DataPoints()->AddDataPointForScatterSeries(xValueCell, yValueCell);

xValueCell = workbook->GetCell(worksheetIndex, 3, 1, ObjectExt::Box(2));
yValueCell = workbook->GetCell(worksheetIndex, 3, 2, ObjectExt::Box(10));
series->get_DataPoints()->AddDataPointForScatterSeries(xValueCell, yValueCell);

series->set_Type(ChartType::ScatterWithStraightLinesAndMarkers);

series->get_Marker()->set_Size(10);
series->get_Marker()->set_Symbol(MarkerStyleType::Star);

series = chart->get_ChartData()->get_Series()->idx_get(1);

xValueCell = workbook->GetCell(worksheetIndex, 2, 3, ObjectExt::Box(5));
yValueCell = workbook->GetCell(worksheetIndex, 2, 4, ObjectExt::Box(2));
series->get_DataPoints()->AddDataPointForScatterSeries(xValueCell, yValueCell);

xValueCell = workbook->GetCell(worksheetIndex, 3, 3, ObjectExt::Box(3));
yValueCell = workbook->GetCell(worksheetIndex, 3, 4, ObjectExt::Box(1));
series->get_DataPoints()->AddDataPointForScatterSeries(xValueCell, yValueCell);

xValueCell = workbook->GetCell(worksheetIndex, 4, 3, ObjectExt::Box(2));
yValueCell = workbook->GetCell(worksheetIndex, 4, 4, ObjectExt::Box(2));
series->get_DataPoints()->AddDataPointForScatterSeries(xValueCell, yValueCell);

xValueCell = workbook->GetCell(worksheetIndex, 5, 3, ObjectExt::Box(5));
yValueCell = workbook->GetCell(worksheetIndex, 5, 4, ObjectExt::Box(1));
series->get_DataPoints()->AddDataPointForScatterSeries(xValueCell, yValueCell);

series->get_Marker()->set_Size(10);
series->get_Marker()->set_Symbol(MarkerStyleType::Circle);

presentation->Save(u"AsposeChart.pptx", SaveFormat::Pptx);
परिणाम:
पाई चार्ट बनाएं
पाई चार्ट डेटा में भाग‑से‑संपूर्ण संबंध दिखाने के लिए सबसे उपयुक्त होते हैं, विशेषकर जब डेटा में श्रेणी लेबल के साथ संख्यात्मक मान होते हैं। हालांकि, यदि आपके डेटा में कई भाग या लेबल हैं, तो आप बार चार्ट का उपयोग करने पर विचार कर सकते हैं।
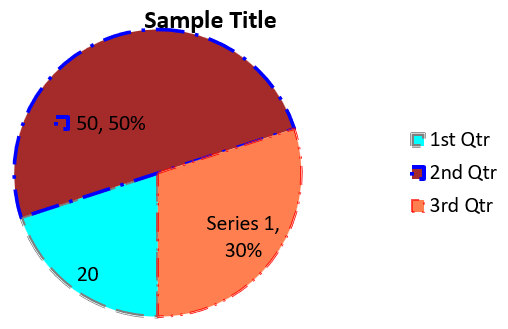
यह उदाहरण तीन त्रैमासिक मानों के साथ एक पाई चार्ट बनाता है। प्रत्येक स्लाइस का कस्टम भराव और बॉर्डर है, और लेबल विभिन्न संयोजनों में मान, प्रतिशत, और सीरीज़ जानकारी दिखाते हैं। set_FirstSliceAngle विधि पहला स्लाइस 180 डिग्री पर शुरू करती है।
#include <system/shared_ptr.h>
#include <system/object_ext.h>
#include <system/string.h>
#include <drawing/color.h>
#include <DOM/Chart/ChartType.h>
#include <DOM/Chart/IChartCategoryCollection.h>
#include <DOM/Chart/IChartData.h>
#include <DOM/Chart/IChartDataCell.h>
#include <DOM/Chart/IChartDataPoint.h>
#include <DOM/Chart/IChartDataPointCollection.h>
#include <DOM/Chart/IChartDataWorkbook.h>
#include <DOM/Chart/IChartSeries.h>
#include <DOM/Chart/IChartSeriesCollection.h>
#include <DOM/Chart/IChartSeriesGroup.h>
#include <DOM/Chart/IChartSeriesGroupCollection.h>
#include <DOM/Chart/IChartTextFormat.h>
#include <DOM/Chart/IChartTitle.h>
#include <DOM/Chart/IDataLabel.h>
#include <DOM/Chart/IDataLabelCollection.h>
#include <DOM/Chart/IDataLabelFormat.h>
#include <DOM/Chart/IDoubleChartValue.h>
#include <DOM/Chart/IFormat.h>
#include <DOM/Chart/ILegend.h>
#include <DOM/FillType.h>
#include <DOM/IChart.h>
#include <DOM/IColorFormat.h>
#include <DOM/IFillFormat.h>
#include <DOM/ILineFillFormat.h>
#include <DOM/ILineFormat.h>
#include <DOM/IPortionFormat.h>
#include <DOM/IShapeCollection.h>
#include <DOM/ISlide.h>
#include <DOM/ITextFrame.h>
#include <DOM/ITextFrameFormat.h>
#include <DOM/LineDashStyle.h>
#include <DOM/LineStyle.h>
#include <DOM/NullableBool.h>
#include <DOM/Presentation.h>
#include <Export/SaveFormat.h>

using namespace System;
using namespace System::Drawing;
using namespace Aspose::Slides;
using namespace Aspose::Slides::Charts;
using namespace Aspose::Slides::Export;

auto presentation = MakeObject<Presentation>();
auto slide = presentation->get_Slide(0);

auto chart = slide->get_Shapes()->AddChart(ChartType::Pie, 20, 20, 500, 300);

chart->get_ChartTitle()->AddTextFrameForOverriding(u"Sample Title");
chart->get_ChartTitle()->get_TextFrameForOverriding()->get_TextFrameFormat()->set_CenterText(NullableBool::True);
chart->get_ChartTitle()->set_Height(20);
chart->set_HasTitle(true);

chart->get_ChartData()->get_Series()->idx_get(0)->get_Labels()->get_DefaultDataLabelFormat()->set_ShowValue(true);

auto workbook = chart->get_ChartData()->get_ChartDataWorkbook();
auto worksheetIndex = 0;

chart->get_ChartData()->get_Series()->Clear();
chart->get_ChartData()->get_Categories()->Clear();

auto categoryCell = workbook->GetCell(0, 1, 0, ObjectExt::Box(String(u"1st Qtr")));
chart->get_ChartData()->get_Categories()->Add(categoryCell);
categoryCell = workbook->GetCell(0, 2, 0, ObjectExt::Box(String(u"2nd Qtr")));
chart->get_ChartData()->get_Categories()->Add(categoryCell);
categoryCell = workbook->GetCell(0, 3, 0, ObjectExt::Box(String(u"3rd Qtr")));
chart->get_ChartData()->get_Categories()->Add(categoryCell);

auto seriesNameCell = workbook->GetCell(0, 0, 1, ObjectExt::Box(String(u"Series 1")));
auto series = chart->get_ChartData()->get_Series()->Add(seriesNameCell, chart->get_Type());

auto valueCell = workbook->GetCell(worksheetIndex, 1, 1, ObjectExt::Box(20));
series->get_DataPoints()->AddDataPointForPieSeries(valueCell);
valueCell = workbook->GetCell(worksheetIndex, 2, 1, ObjectExt::Box(50));
series->get_DataPoints()->AddDataPointForPieSeries(valueCell);
valueCell = workbook->GetCell(worksheetIndex, 3, 1, ObjectExt::Box(30));
series->get_DataPoints()->AddDataPointForPieSeries(valueCell);

chart->get_ChartData()->get_SeriesGroups()->idx_get(0)->set_IsColorVaried(true);

auto firstSlice = series->get_DataPoints()->idx_get(0);
firstSlice->get_Format()->get_Fill()->set_FillType(FillType::Solid);
firstSlice->get_Format()->get_Fill()->get_SolidFillColor()->set_Color(Color::get_Cyan());

firstSlice->get_Format()->get_Line()->get_FillFormat()->set_FillType(FillType::Solid);
firstSlice->get_Format()->get_Line()->get_FillFormat()->get_SolidFillColor()->set_Color(Color::get_Gray());
firstSlice->get_Format()->get_Line()->set_Width(3.0);
firstSlice->get_Format()->get_Line()->set_Style(LineStyle::ThinThick);
firstSlice->get_Format()->get_Line()->set_DashStyle(LineDashStyle::LargeDash);

auto secondSlice = series->get_DataPoints()->idx_get(1);
secondSlice->get_Format()->get_Fill()->set_FillType(FillType::Solid);
secondSlice->get_Format()->get_Fill()->get_SolidFillColor()->set_Color(Color::get_Brown());

secondSlice->get_Format()->get_Line()->get_FillFormat()->set_FillType(FillType::Solid);
secondSlice->get_Format()->get_Line()->get_FillFormat()->get_SolidFillColor()->set_Color(Color::get_Blue());
secondSlice->get_Format()->get_Line()->set_Width(3.0);
secondSlice->get_Format()->get_Line()->set_Style(LineStyle::Single);
secondSlice->get_Format()->get_Line()->set_DashStyle(LineDashStyle::LargeDashDot);

auto thirdSlice = series->get_DataPoints()->idx_get(2);
thirdSlice->get_Format()->get_Fill()->set_FillType(FillType::Solid);
thirdSlice->get_Format()->get_Fill()->get_SolidFillColor()->set_Color(Color::get_Coral());

thirdSlice->get_Format()->get_Line()->get_FillFormat()->set_FillType(FillType::Solid);
thirdSlice->get_Format()->get_Line()->get_FillFormat()->get_SolidFillColor()->set_Color(Color::get_Red());
thirdSlice->get_Format()->get_Line()->set_Width(2.0);
thirdSlice->get_Format()->get_Line()->set_Style(LineStyle::ThinThin);
thirdSlice->get_Format()->get_Line()->set_DashStyle(LineDashStyle::LargeDashDotDot);

auto firstLabel = series->get_DataPoints()->idx_get(0)->get_Label();
firstLabel->get_DataLabelFormat()->set_ShowValue(true);

auto secondLabel = series->get_DataPoints()->idx_get(1)->get_Label();
secondLabel->get_DataLabelFormat()->set_ShowValue(true);
secondLabel->get_DataLabelFormat()->set_ShowLegendKey(true);
secondLabel->get_DataLabelFormat()->set_ShowPercentage(true);

auto thirdLabel = series->get_DataPoints()->idx_get(2)->get_Label();
thirdLabel->get_DataLabelFormat()->set_ShowSeriesName(true);
thirdLabel->get_DataLabelFormat()->set_ShowPercentage(true);

series->get_Labels()->get_DefaultDataLabelFormat()->set_ShowLeaderLines(true);

chart->get_ChartData()->get_SeriesGroups()->idx_get(0)->set_FirstSliceAngle(180);

presentation->Save(u"PieChart.pptx", SaveFormat::Pptx);
परिणाम:
लाइन चार्ट बनाएं
लाइन चार्ट (जिन्हें लाइन ग्राफ़ भी कहा जाता है) उन स्थितियों में सबसे उपयुक्त होते हैं जहाँ आप समय के साथ मानों में परिवर्तन दिखाना चाहते हैं। लाइन चार्ट का उपयोग करके आप एक साथ बड़ी मात्रा में डेटा की तुलना कर सकते हैं, समय के साथ परिवर्तन और रुझानों को ट्रैक कर सकते हैं, डेटा सीरीज़ में विसंगतियों को उजागर कर सकते हैं, आदि।
यह उदाहरण डिफ़ॉल्ट सीरीज़ और श्रेणियों के साथ एक लाइन चार्ट बनाता है, जिसके लिए आप AddChart का उपयोग करते हैं, फिर प्रस्तुति को PPTX के रूप में सहेजते हैं।
#include <system/shared_ptr.h>
#include <DOM/Chart/ChartType.h>
#include <DOM/Chart/IChartCategoryCollection.h>
#include <DOM/Chart/IChartData.h>
#include <DOM/Chart/IChartSeriesCollection.h>
#include <DOM/Chart/IFormat.h>
#include <DOM/IChart.h>
#include <DOM/IColorFormat.h>
#include <DOM/IFillFormat.h>
#include <DOM/ILineFillFormat.h>
#include <DOM/ILineFormat.h>
#include <DOM/IShapeCollection.h>
#include <DOM/ISlide.h>
#include <DOM/Presentation.h>
#include <Export/SaveFormat.h>

using namespace System;
using namespace Aspose::Slides;
using namespace Aspose::Slides::Charts;
using namespace Aspose::Slides::Export;

auto presentation = MakeObject<Presentation>();
auto slide = presentation->get_Slide(0);

auto lineChart = slide->get_Shapes()->AddChart(ChartType::Line, 20, 20, 500, 300);

presentation->Save(u"lineChart.pptx", SaveFormat::Pptx);
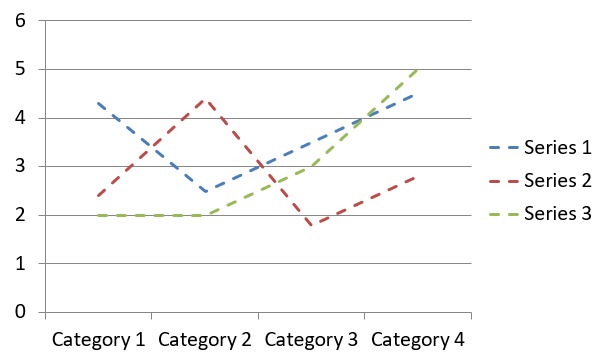
डिफ़ॉल्ट रूप से, लाइन चार्ट के बिंदु सीधे निरंतर रेखाओं से जुड़े होते हैं। यदि आप बिंदुओं को डैश द्वारा जोड़ना चाहते हैं, तो आप set_DashStyle को LineDashStyle के किसी मान के साथ कॉल करें:
#include <system/shared_ptr.h>
#include <DOM/Chart/ChartType.h>
#include <DOM/Chart/IChartCategoryCollection.h>
#include <DOM/Chart/IChartData.h>
#include <DOM/Chart/IChartSeries.h>
#include <DOM/Chart/IChartSeriesCollection.h>
#include <DOM/Chart/IFormat.h>
#include <DOM/IChart.h>
#include <DOM/IColorFormat.h>
#include <DOM/IFillFormat.h>
#include <DOM/ILineFillFormat.h>
#include <DOM/ILineFormat.h>
#include <DOM/IShapeCollection.h>
#include <DOM/ISlide.h>
#include <DOM/LineDashStyle.h>
#include <DOM/Presentation.h>

using namespace System;
using namespace Aspose::Slides;
using namespace Aspose::Slides::Charts;

auto presentation = MakeObject<Presentation>();
auto slide = presentation->get_Slide(0);

auto lineChart = slide->get_Shapes()->AddChart(ChartType::Line, 20, 20, 500, 300);

for (auto series : lineChart->get_ChartData()->get_Series())
{
    series->get_Format()->get_Line()->set_DashStyle(LineDashStyle::Dash);
}
परिणाम:
ट्री मैप चार्ट बनाएं
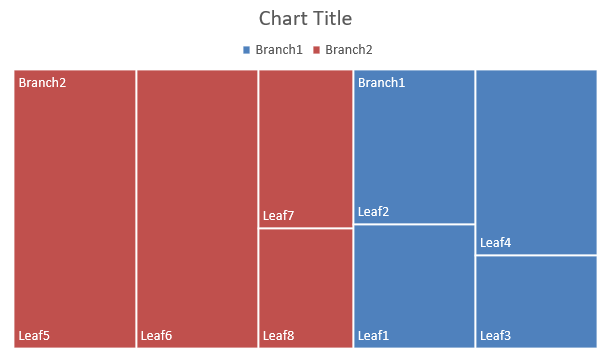
ट्री मैप चार्ट बिक्री डेटा के लिए उपयुक्त होते हैं जब आप डेटा श्रेणियों के सापेक्ष आकार दिखाना चाहते हैं और प्रत्येक श्रेणी में बड़े योगदानकर्ता आइटम पर जल्दी ध्यान आकर्षित करना चाहते हैं।
यह उदाहरण आठ पत्तियों को चार स्तंभों और दो शाखाओं में समूहित करके एक ट्री मैप बनाता है। SetGroupingItem विधि स्तर 1 पर स्तंभ और स्तर 2 पर शाखाएँ निर्धारित करती है। मान सापेक्ष आयत आकार निर्धारित करते हैं, जबकि श्रेणी लेबल और ओवरलैपिंग पैरेंट लेबल पदानुक्रम पहचानते हैं।
#include <system/shared_ptr.h>
#include <system/object_ext.h>
#include <system/string.h>
#include <DOM/Chart/ChartType.h>
#include <DOM/Chart/IChartCategory.h>
#include <DOM/Chart/IChartCategoryCollection.h>
#include <DOM/Chart/IChartCategoryLevelsManager.h>
#include <DOM/Chart/IChartData.h>
#include <DOM/Chart/IChartDataCell.h>
#include <DOM/Chart/IChartDataPoint.h>
#include <DOM/Chart/IChartDataPointCollection.h>
#include <DOM/Chart/IChartDataWorkbook.h>
#include <DOM/Chart/IChartSeries.h>
#include <DOM/Chart/IChartSeriesCollection.h>
#include <DOM/Chart/IDataLabel.h>
#include <DOM/Chart/IDataLabelCollection.h>
#include <DOM/Chart/IDataLabelFormat.h>
#include <DOM/Chart/IFormat.h>
#include <DOM/Chart/ParentLabelLayoutType.h>
#include <DOM/IChart.h>
#include <DOM/IColorFormat.h>
#include <DOM/IFillFormat.h>
#include <DOM/ILineFillFormat.h>
#include <DOM/ILineFormat.h>
#include <DOM/IShapeCollection.h>
#include <DOM/ISlide.h>
#include <DOM/Presentation.h>
#include <Export/SaveFormat.h>

using namespace System;
using namespace Aspose::Slides;
using namespace Aspose::Slides::Charts;
using namespace Aspose::Slides::Export;

auto presentation = MakeObject<Presentation>();
auto slide = presentation->get_Slide(0);

auto chart = slide->get_Shapes()->AddChart(ChartType::Treemap, 20, 20, 500, 300);

chart->get_ChartData()->get_Categories()->Clear();
chart->get_ChartData()->get_Series()->Clear();

auto workbook = chart->get_ChartData()->get_ChartDataWorkbook();
workbook->Clear(0);

// शाखा 1
auto categoryCell = workbook->GetCell(0, u"C1", ObjectExt::Box(String(u"Leaf1")));
auto leaf = chart->get_ChartData()->get_Categories()->Add(categoryCell);
leaf->get_GroupingLevels()->SetGroupingItem(1, ObjectExt::Box(String(u"Stem1")));
leaf->get_GroupingLevels()->SetGroupingItem(2, ObjectExt::Box(String(u"Branch1")));

categoryCell = workbook->GetCell(0, u"C2", ObjectExt::Box(String(u"Leaf2")));
chart->get_ChartData()->get_Categories()->Add(categoryCell);

categoryCell = workbook->GetCell(0, u"C3", ObjectExt::Box(String(u"Leaf3")));
leaf = chart->get_ChartData()->get_Categories()->Add(categoryCell);
leaf->get_GroupingLevels()->SetGroupingItem(1, ObjectExt::Box(String(u"Stem2")));

categoryCell = workbook->GetCell(0, u"C4", ObjectExt::Box(String(u"Leaf4")));
chart->get_ChartData()->get_Categories()->Add(categoryCell);

// शाखा 2
categoryCell = workbook->GetCell(0, u"C5", ObjectExt::Box(String(u"Leaf5")));
leaf = chart->get_ChartData()->get_Categories()->Add(categoryCell);
leaf->get_GroupingLevels()->SetGroupingItem(1, ObjectExt::Box(String(u"Stem3")));
leaf->get_GroupingLevels()->SetGroupingItem(2, ObjectExt::Box(String(u"Branch2")));

categoryCell = workbook->GetCell(0, u"C6", ObjectExt::Box(String(u"Leaf6")));
chart->get_ChartData()->get_Categories()->Add(categoryCell);

categoryCell = workbook->GetCell(0, u"C7", ObjectExt::Box(String(u"Leaf7")));
leaf = chart->get_ChartData()->get_Categories()->Add(categoryCell);
leaf->get_GroupingLevels()->SetGroupingItem(1, ObjectExt::Box(String(u"Stem4")));

categoryCell = workbook->GetCell(0, u"C8", ObjectExt::Box(String(u"Leaf8")));
chart->get_ChartData()->get_Categories()->Add(categoryCell);

auto series = chart->get_ChartData()->get_Series()->Add(ChartType::Treemap);
series->get_Labels()->get_DefaultDataLabelFormat()->set_ShowCategoryName(true);
auto valueCell = workbook->GetCell(0, u"D1", ObjectExt::Box(4));
series->get_DataPoints()->AddDataPointForTreemapSeries(valueCell);
valueCell = workbook->GetCell(0, u"D2", ObjectExt::Box(5));
series->get_DataPoints()->AddDataPointForTreemapSeries(valueCell);
valueCell = workbook->GetCell(0, u"D3", ObjectExt::Box(3));
series->get_DataPoints()->AddDataPointForTreemapSeries(valueCell);
valueCell = workbook->GetCell(0, u"D4", ObjectExt::Box(6));
series->get_DataPoints()->AddDataPointForTreemapSeries(valueCell);
valueCell = workbook->GetCell(0, u"D5", ObjectExt::Box(9));
series->get_DataPoints()->AddDataPointForTreemapSeries(valueCell);
valueCell = workbook->GetCell(0, u"D6", ObjectExt::Box(9));
series->get_DataPoints()->AddDataPointForTreemapSeries(valueCell);
valueCell = workbook->GetCell(0, u"D7", ObjectExt::Box(4));
series->get_DataPoints()->AddDataPointForTreemapSeries(valueCell);
valueCell = workbook->GetCell(0, u"D8", ObjectExt::Box(3));
series->get_DataPoints()->AddDataPointForTreemapSeries(valueCell);

series->set_ParentLabelLayout(ParentLabelLayoutType::Overlapping);

presentation->Save(u"Treemap.pptx", SaveFormat::Pptx);
परिणाम:
वॉटरफ़ॉल चार्ट बनाएं
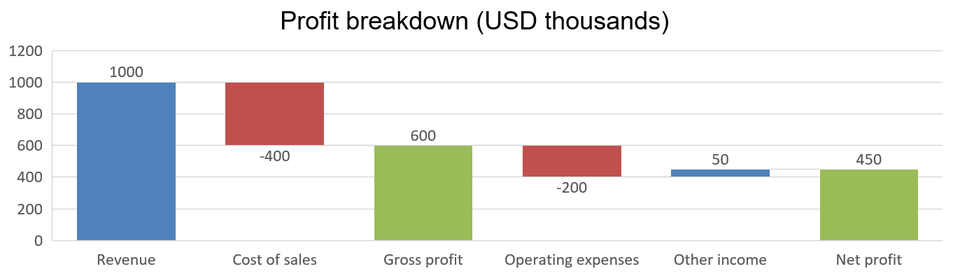
वॉटरफ़ॉल चार्ट यह दिखाता है कि सकारात्मक और नकारात्मक परिवर्तन अंतिम मान में कैसे योगदान देते हैं। उदाहरण के लिए, लाभ विभाजन राजस्व से शुरू हो सकता है, लागत घटाने, और अन्य आय जोड़ने से। परिवर्तन कॉलम पिछले और नए चल रहे मान के बीच फ़्लोट करते हैं, जबकि कुल कॉलम शून्य से संचयी मान तक विस्तारित होते हैं।
निम्न उदाहरण में हजारों अमेरिकी डॉलर की राशियों का उपयोग किया गया है:
| श्रेणी | वर्कबुक मान | कॉलम प्रकार |
|---|---|---|
| राजस्व | 1000 | वृद्धि |
| बिक्री की लागत | -400 | कमी |
| सकल लाभ | 600 | मध्यवर्ती कुल |
| परिचालन खर्च | -200 | कमी |
| अन्य आय | 50 | वृद्धि |
| शुद्ध लाभ | 450 | अंतिम कुल |
किसी बिंदु को मध्यवर्ती या अंतिम कुल के रूप में चिह्नित करने के लिए, आप उसके set_SetAsTotal को true के साथ कॉल करते हैं। उस बिंदु के वर्कबुक सेल में वास्तविक संचयी राशि प्रदान करें: सकल लाभ के लिए 600 (1000 - 400) और शुद्ध लाभ के लिए 450 (600 - 200 + 50)। विधि कॉलम को कुल के रूप में चिह्नित करती है; यह सेल मान की गणना या भराव नहीं करती। शून्य को प्लेसहोल्डर के रूप में उपयोग न करें या कुल बिंदु के लिए कोई अन्य परिवर्तन न दें। कुल कॉलम संचयी मान दिखाता है बिना उसे फिर से चल रहे मान में जोड़ते।
यह पूर्ण C++ उदाहरण ChartType के Waterfall सदस्य का उपयोग करके एक चार्ट बनाता है, डिफ़ॉल्ट डेटा साफ़ करता है, और एम्बेडेड वर्कबुक को भरता है। वर्कशीट इंडेक्स 0 पहली वर्कशीट को चुनता है; कॉलम A श्रेणी नाम रखती है और कॉलम B मान। प्रत्येक मान सेल को आप AddDataPointForWaterfallSeries से जोड़ते हैं। शून्य‑आधारित बिंदु इंडेक्स 2 और 5 क्रमशः मध्यवर्ती और अंतिम कुल को पहचानते हैं। set_ShowValue को true देकर आप कॉलम पर राशि दिखा सकते हैं। इनपुट प्रस्तुति या वर्कबुक आवश्यक नहीं है।
#include <system/shared_ptr.h>
#include <system/object_ext.h>
#include <system/string.h>
#include <system/array.h>
#include <DOM/Chart/ChartType.h>
#include <DOM/Chart/IChartCategoryCollection.h>
#include <DOM/Chart/IChartData.h>
#include <DOM/Chart/IChartDataCell.h>
#include <DOM/Chart/IChartDataPoint.h>
#include <DOM/Chart/IChartDataPointCollection.h>
#include <DOM/Chart/IChartDataWorkbook.h>
#include <DOM/Chart/IChartSeries.h>
#include <DOM/Chart/IChartSeriesCollection.h>
#include <DOM/Chart/IChartTextFormat.h>
#include <DOM/Chart/IChartTitle.h>
#include <DOM/Chart/IDataLabel.h>
#include <DOM/Chart/IDataLabelCollection.h>
#include <DOM/Chart/IDataLabelFormat.h>
#include <DOM/Chart/IDoubleChartValue.h>
#include <DOM/Chart/IFormat.h>
#include <DOM/Chart/ILegend.h>
#include <DOM/IChart.h>
#include <DOM/IColorFormat.h>
#include <DOM/IFillFormat.h>
#include <DOM/ILineFillFormat.h>
#include <DOM/ILineFormat.h>
#include <DOM/IPortionFormat.h>
#include <DOM/IShapeCollection.h>
#include <DOM/ISlide.h>
#include <DOM/ITextFrame.h>
#include <DOM/ITextFrameFormat.h>
#include <DOM/NullableBool.h>
#include <DOM/Presentation.h>
#include <Export/SaveFormat.h>

using namespace System;
using namespace Aspose::Slides;
using namespace Aspose::Slides::Charts;
using namespace Aspose::Slides::Export;

auto presentation = MakeObject<Presentation>();
auto slide = presentation->get_Slide(0);

auto chart = slide->get_Shapes()->AddChart(ChartType::Waterfall, 20, 20, 680, 200);

chart->set_HasTitle(true);
chart->get_ChartTitle()->AddTextFrameForOverriding(u"Profit breakdown (USD thousands)");
chart->get_ChartTitle()->set_Overlay(false);
chart->set_HasLegend(false);

chart->get_ChartData()->get_Series()->Clear();
chart->get_ChartData()->get_Categories()->Clear();

auto workbook = chart->get_ChartData()->get_ChartDataWorkbook();
auto worksheetIndex = 0;

workbook->Clear(worksheetIndex);

auto seriesNameCell = workbook->GetCell(worksheetIndex, 0, 1, ObjectExt::Box(String(u"Profit")));
auto series = chart->get_ChartData()->get_Series()->Add(seriesNameCell, ChartType::Waterfall);
auto categories = MakeArray<String>({ u"Revenue", u"Cost of sales", u"Gross profit", u"Operating expenses", u"Other income", u"Net profit" });
auto values = MakeArray<double>({ 1000, -400, 600, -200, 50, 450 });

for (auto i = 0; i < categories->get_Length(); i++)
{
    auto categoryCell = workbook->GetCell(worksheetIndex, i + 1, 0, ObjectExt::Box(categories->idx_get(i)));
    chart->get_ChartData()->get_Categories()->Add(categoryCell);
    auto valueCell = workbook->GetCell(worksheetIndex, i + 1, 1, ObjectExt::Box(values->idx_get(i)));
    series->get_DataPoints()->AddDataPointForWaterfallSeries(valueCell);
}

// तीसरा और छठा बिंदु कुल को दर्शाते हैं, अतिरिक्त बदलाव नहीं.
series->get_DataPoints()->idx_get(2)->set_SetAsTotal(true);
series->get_DataPoints()->idx_get(5)->set_SetAsTotal(true);
series->set_ShowConnectorLines(true);
series->get_Labels()->get_DefaultDataLabelFormat()->set_ShowValue(true);

presentation->Save(u"WaterfallChart.pptx", SaveFormat::Pptx);
सीरीज़‑लेवल पर आप set_ShowConnectorLines को true करके क्रमागत कॉलमों को जोड़ने वाली रेखाएँ दिखा सकते हैं, जिससे चल रही राशि को फॉलो करना आसान हो जाता है। इन रेखाओं को छिपाने के लिए, उदाहरण में असाइनमेंट को series->set_ShowConnectorLines(false); में बदलें और फिर सहेजें। यह केवल रेखा की दृश्यता बदलता है, डेटा या कुल को नहीं।
परिणाम:
स्टॉक चार्ट बनाएं
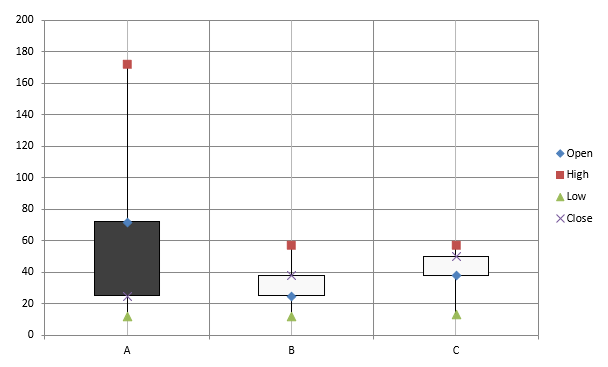
स्टॉक चार्ट खुले, उच्च, निम्न, और बंद कीमतों जैसे वित्तीय डेटा को प्रदर्शित करने के लिए उपयोग किए जाते हैं, जिससे बाजार रुझान और अस्थिरता का विश्लेषण किया जा सके। ये स्टॉक प्रदर्शन पर महत्त्वपूर्ण अंतर्दृष्टि प्रदान करते हैं, जिससे निवेशकों और विश्लेषकों को सूचित निर्णय लेने में सहायता मिलती है।
यह उदाहरण चार श्रृंखलाओं के साथ एक ओपन‑हाई‑लो‑क्लोज़ चार्ट बनाता है और तीन श्रेणियों को परिभाषित करता है। set_HasUpDownBars विधि अप/डाउन बार को सक्षम करती है, और get_HiLowLinesFormat उच्च‑निम्न रेखाओं को नियंत्रित करती है जो मूल्य रेंज दिखाती हैं, जबकि व्यक्तिगत श्रृंखला रेखाएँ और छोटे क्षैतिज ग्रिडलाइन छिपी रहती हैं।
#include <DOM/Chart/IChartLinesFormat.h>
#include <system/shared_ptr.h>
#include <system/object_ext.h>
#include <system/string.h>
#include <DOM/Chart/ChartType.h>
#include <DOM/Chart/IAxesManager.h>
#include <DOM/Chart/IAxis.h>
#include <DOM/Chart/IChartCategoryCollection.h>
#include <DOM/Chart/IChartData.h>
#include <DOM/Chart/IChartDataCell.h>
#include <DOM/Chart/IChartDataPoint.h>
#include <DOM/Chart/IChartDataPointCollection.h>
#include <DOM/Chart/IChartDataWorkbook.h>
#include <DOM/Chart/IChartSeries.h>
#include <DOM/Chart/IChartSeriesCollection.h>
#include <DOM/Chart/IChartSeriesGroup.h>
#include <DOM/Chart/IChartSeriesGroupCollection.h>
#include <DOM/Chart/IFormat.h>
#include <DOM/Chart/IUpDownBarsManager.h>
#include <DOM/FillType.h>
#include <DOM/IChart.h>
#include <DOM/IColorFormat.h>
#include <DOM/IFillFormat.h>
#include <DOM/ILineFillFormat.h>
#include <DOM/ILineFormat.h>
#include <DOM/IShapeCollection.h>
#include <DOM/ISlide.h>
#include <DOM/Presentation.h>
#include <Export/SaveFormat.h>

using namespace System;
using namespace Aspose::Slides;
using namespace Aspose::Slides::Charts;
using namespace Aspose::Slides::Export;

auto presentation = MakeObject<Presentation>();
auto slide = presentation->get_Slide(0);

auto chart = slide->get_Shapes()->AddChart(ChartType::OpenHighLowClose, 20, 20, 500, 300, false);

auto workbook = chart->get_ChartData()->get_ChartDataWorkbook();

auto categoryCell = workbook->GetCell(0, 1, 0, ObjectExt::Box(String(u"A")));
chart->get_ChartData()->get_Categories()->Add(categoryCell);
categoryCell = workbook->GetCell(0, 2, 0, ObjectExt::Box(String(u"B")));
chart->get_ChartData()->get_Categories()->Add(categoryCell);
categoryCell = workbook->GetCell(0, 3, 0, ObjectExt::Box(String(u"C")));
chart->get_ChartData()->get_Categories()->Add(categoryCell);

auto seriesNameCell = workbook->GetCell(0, 0, 1, ObjectExt::Box(String(u"Open")));
chart->get_ChartData()->get_Series()->Add(seriesNameCell, ChartType::OpenHighLowClose);
seriesNameCell = workbook->GetCell(0, 0, 2, ObjectExt::Box(String(u"High")));
chart->get_ChartData()->get_Series()->Add(seriesNameCell, ChartType::OpenHighLowClose);
seriesNameCell = workbook->GetCell(0, 0, 3, ObjectExt::Box(String(u"Low")));
chart->get_ChartData()->get_Series()->Add(seriesNameCell, ChartType::OpenHighLowClose);
seriesNameCell = workbook->GetCell(0, 0, 4, ObjectExt::Box(String(u"Close")));
chart->get_ChartData()->get_Series()->Add(seriesNameCell, ChartType::OpenHighLowClose);

auto series = chart->get_ChartData()->get_Series()->idx_get(0);
auto valueCell = workbook->GetCell(0, 1, 1, ObjectExt::Box(72));
series->get_DataPoints()->AddDataPointForStockSeries(valueCell);
valueCell = workbook->GetCell(0, 2, 1, ObjectExt::Box(25));
series->get_DataPoints()->AddDataPointForStockSeries(valueCell);
valueCell = workbook->GetCell(0, 3, 1, ObjectExt::Box(38));
series->get_DataPoints()->AddDataPointForStockSeries(valueCell);

series = chart->get_ChartData()->get_Series()->idx_get(1);
valueCell = workbook->GetCell(0, 1, 2, ObjectExt::Box(172));
series->get_DataPoints()->AddDataPointForStockSeries(valueCell);
valueCell = workbook->GetCell(0, 2, 2, ObjectExt::Box(57));
series->get_DataPoints()->AddDataPointForStockSeries(valueCell);
valueCell = workbook->GetCell(0, 3, 2, ObjectExt::Box(57));
series->get_DataPoints()->AddDataPointForStockSeries(valueCell);

series = chart->get_ChartData()->get_Series()->idx_get(2);
valueCell = workbook->GetCell(0, 1, 3, ObjectExt::Box(12));
series->get_DataPoints()->AddDataPointForStockSeries(valueCell);
valueCell = workbook->GetCell(0, 2, 3, ObjectExt::Box(12));
series->get_DataPoints()->AddDataPointForStockSeries(valueCell);
valueCell = workbook->GetCell(0, 3, 3, ObjectExt::Box(13));
series->get_DataPoints()->AddDataPointForStockSeries(valueCell);

series = chart->get_ChartData()->get_Series()->idx_get(3);
valueCell = workbook->GetCell(0, 1, 4, ObjectExt::Box(25));
series->get_DataPoints()->AddDataPointForStockSeries(valueCell);
valueCell = workbook->GetCell(0, 2, 4, ObjectExt::Box(38));
series->get_DataPoints()->AddDataPointForStockSeries(valueCell);
valueCell = workbook->GetCell(0, 3, 4, ObjectExt::Box(50));
series->get_DataPoints()->AddDataPointForStockSeries(valueCell);

chart->get_ChartData()->get_SeriesGroups()->idx_get(0)->get_UpDownBars()->set_HasUpDownBars(true);
chart->get_ChartData()->get_SeriesGroups()->idx_get(0)->get_HiLowLinesFormat()->get_Line()->get_FillFormat()->set_FillType(FillType::Solid);

for (auto stockSeries : chart->get_ChartData()->get_Series())
{
    stockSeries->get_Format()->get_Line()->get_FillFormat()->set_FillType(FillType::NoFill);
}

chart->get_Axes()->get_VerticalAxis()->get_MinorGridLinesFormat()->get_Line()->get_FillFormat()->set_FillType(FillType::NoFill);

presentation->Save(u"Stock-chart.pptx", SaveFormat::Pptx);
परिणाम:
बॉक्स और व्हिस्कर चार्ट बनाएं
बॉक्स और व्हिस्कर चार्ट डेटा के वितरण को दिखाने के लिए उपयोग किए जाते हैं, जिसमें मध्यक, चतुर्थांश, और संभावित अपवाद शामिल होते हैं। ये अन्वेषणात्मक डेटा विश्लेषण और सांख्यिकीय अध्ययनों में डेटा परिवर्तनशीलता को तेजी से समझने और किसी भी विसंगति की पहचान करने में सहायक होते हैं।
यह उदाहरण छह मानों से एक बॉक्स और व्हिस्कर चार्ट बनाता है। set_QuartileMethod विधि विशेष चतुर्थांश गणना का चयन करती है। उदाहरण में औसत रेखाएँ, औसत मार्कर, आंतरिक बिंदु, और अपवाद बिंदु भी सक्षम किए गए हैं।
#include <system/shared_ptr.h>
#include <system/object_ext.h>
#include <system/string.h>
#include <DOM/Chart/ChartType.h>
#include <DOM/Chart/IChartCategoryCollection.h>
#include <DOM/Chart/IChartData.h>
#include <DOM/Chart/IChartDataCell.h>
#include <DOM/Chart/IChartDataPoint.h>
#include <DOM/Chart/IChartDataPointCollection.h>
#include <DOM/Chart/IChartDataWorkbook.h>
#include <DOM/Chart/IChartSeries.h>
#include <DOM/Chart/IChartSeriesCollection.h>
#include <DOM/Chart/IFormat.h>
#include <DOM/Chart/IMarker.h>
#include <DOM/Chart/QuartileMethodType.h>
#include <DOM/IChart.h>
#include <DOM/IColorFormat.h>
#include <DOM/IFillFormat.h>
#include <DOM/ILineFillFormat.h>
#include <DOM/ILineFormat.h>
#include <DOM/IShapeCollection.h>
#include <DOM/ISlide.h>
#include <DOM/Presentation.h>
#include <Export/SaveFormat.h>

using namespace System;
using namespace Aspose::Slides;
using namespace Aspose::Slides::Charts;
using namespace Aspose::Slides::Export;

auto presentation = MakeObject<Presentation>();
auto slide = presentation->get_Slide(0);

auto chart = slide->get_Shapes()->AddChart(ChartType::BoxAndWhisker, 20, 20, 500, 300);

chart->get_ChartData()->get_Categories()->Clear();
chart->get_ChartData()->get_Series()->Clear();

auto workbook = chart->get_ChartData()->get_ChartDataWorkbook();
workbook->Clear(0);

auto categoryCell = workbook->GetCell(0, u"A1", ObjectExt::Box(String(u"Category 1")));
chart->get_ChartData()->get_Categories()->Add(categoryCell);
categoryCell = workbook->GetCell(0, u"A2", ObjectExt::Box(String(u"Category 2")));
chart->get_ChartData()->get_Categories()->Add(categoryCell);
categoryCell = workbook->GetCell(0, u"A3", ObjectExt::Box(String(u"Category 3")));
chart->get_ChartData()->get_Categories()->Add(categoryCell);
categoryCell = workbook->GetCell(0, u"A4", ObjectExt::Box(String(u"Category 4")));
chart->get_ChartData()->get_Categories()->Add(categoryCell);
categoryCell = workbook->GetCell(0, u"A5", ObjectExt::Box(String(u"Category 5")));
chart->get_ChartData()->get_Categories()->Add(categoryCell);
categoryCell = workbook->GetCell(0, u"A6", ObjectExt::Box(String(u"Category 6")));
chart->get_ChartData()->get_Categories()->Add(categoryCell);

auto series = chart->get_ChartData()->get_Series()->Add(ChartType::BoxAndWhisker);

series->set_QuartileMethod(QuartileMethodType::Exclusive);
series->set_ShowMeanLine(true);
series->set_ShowMeanMarkers(true);
series->set_ShowInnerPoints(true);
series->set_ShowOutlierPoints(true);

auto valueCell = workbook->GetCell(0, u"B1", ObjectExt::Box(15));
series->get_DataPoints()->AddDataPointForBoxAndWhiskerSeries(valueCell);
valueCell = workbook->GetCell(0, u"B2", ObjectExt::Box(41));
series->get_DataPoints()->AddDataPointForBoxAndWhiskerSeries(valueCell);
valueCell = workbook->GetCell(0, u"B3", ObjectExt::Box(16));
series->get_DataPoints()->AddDataPointForBoxAndWhiskerSeries(valueCell);
valueCell = workbook->GetCell(0, u"B4", ObjectExt::Box(10));
series->get_DataPoints()->AddDataPointForBoxAndWhiskerSeries(valueCell);
valueCell = workbook->GetCell(0, u"B5", ObjectExt::Box(23));
series->get_DataPoints()->AddDataPointForBoxAndWhiskerSeries(valueCell);
valueCell = workbook->GetCell(0, u"B6", ObjectExt::Box(16));
series->get_DataPoints()->AddDataPointForBoxAndWhiskerSeries(valueCell);

presentation->Save(u"BoxAndWhisker.pptx", SaveFormat::Pptx);
फ़नल चार्ट बनाएं
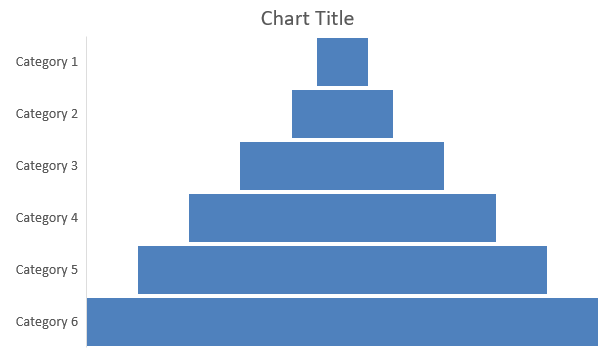
फ़नल चार्ट उन प्रक्रियाओं को दृश्य रूप देने के लिए उपयोग किए जाते हैं जिनमें क्रमिक चरण होते हैं, जहाँ डेटा की मात्रा प्रत्येक चरण के साथ घटती जाती है। ये रूपांतरण दरों का विश्लेषण करने, बाधाएँ पहचानने, और बिक्री या मार्केटिंग प्रक्रिया की दक्षता को ट्रैक करने में विशेष रूप से उपयोगी होते हैं।
यह उदाहरण मौजूदा प्रस्तुति की पहली स्लाइड में एक फ़नल चार्ट जोड़ने के लिए AddChart का उपयोग करता है। यह डिफ़ॉल्ट डेटा को छह श्रेणियों और 50 से 500 तक के मानों से बदलता है, फिर अद्यतन प्रस्तुति को सहेजता है। इनपुट प्रस्तुति में कम से कम एक स्लाइड होनी चाहिए।
#include <system/shared_ptr.h>
#include <system/object_ext.h>
#include <system/string.h>
#include <DOM/Chart/ChartType.h>
#include <DOM/Chart/IChartCategoryCollection.h>
#include <DOM/Chart/IChartData.h>
#include <DOM/Chart/IChartDataCell.h>
#include <DOM/Chart/IChartDataPoint.h>
#include <DOM/Chart/IChartDataPointCollection.h>
#include <DOM/Chart/IChartDataWorkbook.h>
#include <DOM/Chart/IChartSeries.h>
#include <DOM/Chart/IChartSeriesCollection.h>
#include <DOM/Chart/IFormat.h>
#include <DOM/IChart.h>
#include <DOM/IColorFormat.h>
#include <DOM/IFillFormat.h>
#include <DOM/ILineFillFormat.h>
#include <DOM/ILineFormat.h>
#include <DOM/IShapeCollection.h>
#include <DOM/ISlide.h>
#include <DOM/Presentation.h>
#include <Export/SaveFormat.h>

using namespace System;
using namespace Aspose::Slides;
using namespace Aspose::Slides::Charts;
using namespace Aspose::Slides::Export;

auto presentation = MakeObject<Presentation>(u"test.pptx");
auto slide = presentation->get_Slide(0);

auto chart = slide->get_Shapes()->AddChart(ChartType::Funnel, 50, 50, 500, 400);

chart->get_ChartData()->get_Categories()->Clear();
chart->get_ChartData()->get_Series()->Clear();

auto workbook = chart->get_ChartData()->get_ChartDataWorkbook();
workbook->Clear(0);

auto categoryCell = workbook->GetCell(0, u"A1", ObjectExt::Box(String(u"Category 1")));
chart->get_ChartData()->get_Categories()->Add(categoryCell);
categoryCell = workbook->GetCell(0, u"A2", ObjectExt::Box(String(u"Category 2")));
chart->get_ChartData()->get_Categories()->Add(categoryCell);
categoryCell = workbook->GetCell(0, u"A3", ObjectExt::Box(String(u"Category 3")));
chart->get_ChartData()->get_Categories()->Add(categoryCell);
categoryCell = workbook->GetCell(0, u"A4", ObjectExt::Box(String(u"Category 4")));
chart->get_ChartData()->get_Categories()->Add(categoryCell);
categoryCell = workbook->GetCell(0, u"A5", ObjectExt::Box(String(u"Category 5")));
chart->get_ChartData()->get_Categories()->Add(categoryCell);
categoryCell = workbook->GetCell(0, u"A6", ObjectExt::Box(String(u"Category 6")));
chart->get_ChartData()->get_Categories()->Add(categoryCell);

auto series = chart->get_ChartData()->get_Series()->Add(ChartType::Funnel);

auto valueCell = workbook->GetCell(0, u"B1", ObjectExt::Box(50));
series->get_DataPoints()->AddDataPointForFunnelSeries(valueCell);
valueCell = workbook->GetCell(0, u"B2", ObjectExt::Box(100));
series->get_DataPoints()->AddDataPointForFunnelSeries(valueCell);
valueCell = workbook->GetCell(0, u"B3", ObjectExt::Box(200));
series->get_DataPoints()->AddDataPointForFunnelSeries(valueCell);
valueCell = workbook->GetCell(0, u"B4", ObjectExt::Box(300));
series->get_DataPoints()->AddDataPointForFunnelSeries(valueCell);
valueCell = workbook->GetCell(0, u"B5", ObjectExt::Box(400));
series->get_DataPoints()->AddDataPointForFunnelSeries(valueCell);
valueCell = workbook->GetCell(0, u"B6", ObjectExt::Box(500));
series->get_DataPoints()->AddDataPointForFunnelSeries(valueCell);

presentation->Save(u"Funnel.pptx", SaveFormat::Pptx);
परिणाम:
सनबर्स्ट चार्ट बनाएं
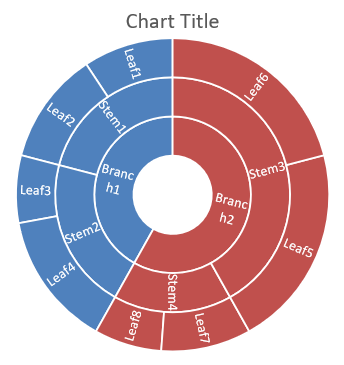
सनबर्स्ट चार्ट पद‑से‑पुत्र संबंधों को सम्मिलित रिंग्स के रूप में दर्शाकर श्रेणीबद्ध डेटा को दृश्य रूप देते हैं। ये भाग‑से‑संपूर्ण संबंधों को स्पष्ट रूप से दिखाते हैं और नेस्टेड श्रेणियों और उप‑श्रेणियों को कॉम्पैक्ट फ़ॉर्मेट में प्रदर्शित करने के लिए आदर्श होते हैं।
यह उदाहरण आठ पत्तियों को चार स्तंभों और दो शाखाओं में समूहित करके एक सनबर्स्ट चार्ट बनाता है। SetGroupingItem विधि स्तर 1 पर स्तंभ और स्तर 2 पर शाखाएँ निर्धारित करती है। श्रेणी लेबल खंडों की पहचान करते हैं, और मान उनके सापेक्ष आकार निर्धारित करते हैं।
#include <system/shared_ptr.h>
#include <system/object_ext.h>
#include <system/string.h>
#include <DOM/Chart/ChartType.h>
#include <DOM/Chart/IChartCategory.h>
#include <DOM/Chart/IChartCategoryCollection.h>
#include <DOM/Chart/IChartCategoryLevelsManager.h>
#include <DOM/Chart/IChartData.h>
#include <DOM/Chart/IChartDataCell.h>
#include <DOM/Chart/IChartDataPoint.h>
#include <DOM/Chart/IChartDataPointCollection.h>
#include <DOM/Chart/IChartDataWorkbook.h>
#include <DOM/Chart/IChartSeries.h>
#include <DOM/Chart/IChartSeriesCollection.h>
#include <DOM/Chart/IDataLabel.h>
#include <DOM/Chart/IDataLabelCollection.h>
#include <DOM/Chart/IDataLabelFormat.h>
#include <DOM/Chart/IFormat.h>
#include <DOM/IChart.h>
#include <DOM/IColorFormat.h>
#include <DOM/IFillFormat.h>
#include <DOM/ILineFillFormat.h>
#include <DOM/ILineFormat.h>
#include <DOM/IShapeCollection.h>
#include <DOM/ISlide.h>
#include <DOM/Presentation.h>
#include <Export/SaveFormat.h>

using namespace System;
using namespace Aspose::Slides;
using namespace Aspose::Slides::Charts;
using namespace Aspose::Slides::Export;

auto presentation = MakeObject<Presentation>();
auto slide = presentation->get_Slide(0);

auto chart = slide->get_Shapes()->AddChart(ChartType::Sunburst, 20, 20, 500, 300);

chart->get_ChartData()->get_Categories()->Clear();
chart->get_ChartData()->get_Series()->Clear();

auto workbook = chart->get_ChartData()->get_ChartDataWorkbook();
workbook->Clear(0);

// शाखा 1
auto categoryCell = workbook->GetCell(0, u"C1", ObjectExt::Box(String(u"Leaf1")));
auto leaf = chart->get_ChartData()->get_Categories()->Add(categoryCell);
leaf->get_GroupingLevels()->SetGroupingItem(1, ObjectExt::Box(String(u"Stem1")));
leaf->get_GroupingLevels()->SetGroupingItem(2, ObjectExt::Box(String(u"Branch1")));

categoryCell = workbook->GetCell(0, u"C2", ObjectExt::Box(String(u"Leaf2")));
chart->get_ChartData()->get_Categories()->Add(categoryCell);

categoryCell = workbook->GetCell(0, u"C3", ObjectExt::Box(String(u"Leaf3")));
leaf = chart->get_ChartData()->get_Categories()->Add(categoryCell);
leaf->get_GroupingLevels()->SetGroupingItem(1, ObjectExt::Box(String(u"Stem2")));

categoryCell = workbook->GetCell(0, u"C4", ObjectExt::Box(String(u"Leaf4")));
chart->get_ChartData()->get_Categories()->Add(categoryCell);

// शाखा 2
categoryCell = workbook->GetCell(0, u"C5", ObjectExt::Box(String(u"Leaf5")));
leaf = chart->get_ChartData()->get_Categories()->Add(categoryCell);
leaf->get_GroupingLevels()->SetGroupingItem(1, ObjectExt::Box(String(u"Stem3")));
leaf->get_GroupingLevels()->SetGroupingItem(2, ObjectExt::Box(String(u"Branch2")));

categoryCell = workbook->GetCell(0, u"C6", ObjectExt::Box(String(u"Leaf6")));
chart->get_ChartData()->get_Categories()->Add(categoryCell);

categoryCell = workbook->GetCell(0, u"C7", ObjectExt::Box(String(u"Leaf7")));
leaf = chart->get_ChartData()->get_Categories()->Add(categoryCell);
leaf->get_GroupingLevels()->SetGroupingItem(1, ObjectExt::Box(String(u"Stem4")));

categoryCell = workbook->GetCell(0, u"C8", ObjectExt::Box(String(u"Leaf8")));
chart->get_ChartData()->get_Categories()->Add(categoryCell);

auto series = chart->get_ChartData()->get_Series()->Add(ChartType::Sunburst);
series->get_Labels()->get_DefaultDataLabelFormat()->set_ShowCategoryName(true);
auto valueCell = workbook->GetCell(0, u"D1", ObjectExt::Box(4));
series->get_DataPoints()->AddDataPointForSunburstSeries(valueCell);
valueCell = workbook->GetCell(0, u"D2", ObjectExt::Box(5));
series->get_DataPoints()->AddDataPointForSunburstSeries(valueCell);
valueCell = workbook->GetCell(0, u"D3", ObjectExt::Box(3));
series->get_DataPoints()->AddDataPointForSunburstSeries(valueCell);
valueCell = workbook->GetCell(0, u"D4", ObjectExt::Box(6));
series->get_DataPoints()->AddDataPointForSunburstSeries(valueCell);
valueCell = workbook->GetCell(0, u"D5", ObjectExt::Box(9));
series->get_DataPoints()->AddDataPointForSunburstSeries(valueCell);
valueCell = workbook->GetCell(0, u"D6", ObjectExt::Box(9));
series->get_DataPoints()->AddDataPointForSunburstSeries(valueCell);
valueCell = workbook->GetCell(0, u"D7", ObjectExt::Box(4));
series->get_DataPoints()->AddDataPointForSunburstSeries(valueCell);
valueCell = workbook->GetCell(0, u"D8", ObjectExt::Box(3));
series->get_DataPoints()->AddDataPointForSunburstSeries(valueCell);

presentation->Save(u"Sunburst.pptx", SaveFormat::Pptx);
परिणाम:
हिस्टोग्राम चार्ट बनाएं
हिस्टोग्राम चार्ट यह दिखाते हैं कि संख्यात्मक मान अंतराल (bins) में कैसे वितरित होते हैं। मासिक रिपोर्ट में ऑर्डर प्रोसेसिंग समय के लिए एक समान बिन चौड़ाई और थ्रेशोल्ड का उपयोग करें ताकि अंतराल स्थिर रहें और वितरण की तुलना आसान हो।
हॉरिज़ॉन्टल एक्सिस पर आप set_AggregationType को AxisAggregationType के किसी मोड के साथ सेट कर सकते हैं। set_BinWidth केवल ByBinWidth के लिए लागू होता है; set_NumberOfBins केवल ByNumberOfBins के लिए। Automatic का उपयोग करके चार्ट को बिन चुनने दें।
स्थिर बिन चौड़ाई का उपयोग करें
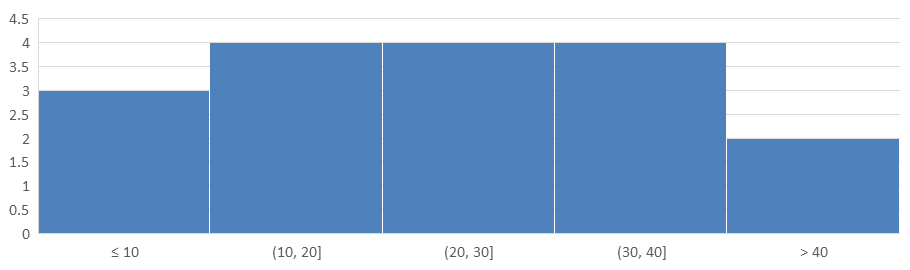
यह उदाहरण प्रोसेसिंग समय को 10‑मिनट अंतराल में समूहित करता है, जहाँ 10 मिनट या उससे कम और 40 मिनट से अधिक समय के लिए अलग बिन होते हैं। आप इन बिनों को set_IsUnderflowBin और set_IsOverflowBin से सक्षम कर सकते हैं। जब आप स्पष्ट थ्रेशोल्ड को set_UnderflowBin और set_OverflowBin से प्रदान करते हैं, तो आप set_IsAutomaticUnderflowBin और set_IsAutomaticOverflowBin को false कर दें।
#include <system/array.h>
#include <system/shared_ptr.h>
#include <system/object_ext.h>
#include <system/string.h>
#include <DOM/Chart/AxisAggregationType.h>
#include <DOM/Chart/ChartType.h>
#include <DOM/Chart/IAxesManager.h>
#include <DOM/Chart/IAxis.h>
#include <DOM/Chart/IChartCategoryCollection.h>
#include <DOM/Chart/IChartData.h>
#include <DOM/Chart/IChartDataCell.h>
#include <DOM/Chart/IChartDataPoint.h>
#include <DOM/Chart/IChartDataPointCollection.h>
#include <DOM/Chart/IChartDataWorkbook.h>
#include <DOM/Chart/IChartSeries.h>
#include <DOM/Chart/IChartSeriesCollection.h>
#include <DOM/Chart/IFormat.h>
#include <DOM/IChart.h>
#include <DOM/IColorFormat.h>
#include <DOM/IFillFormat.h>
#include <DOM/ILineFillFormat.h>
#include <DOM/ILineFormat.h>
#include <DOM/IShapeCollection.h>
#include <DOM/ISlide.h>
#include <DOM/Presentation.h>
#include <Export/SaveFormat.h>

using namespace System;
using namespace Aspose::Slides;
using namespace Aspose::Slides::Charts;
using namespace Aspose::Slides::Export;

auto presentation = MakeObject<Presentation>();
auto slide = presentation->get_Slide(0);

auto chart = slide->get_Shapes()->AddChart(ChartType::Histogram, 20, 20, 680, 200);

chart->set_HasLegend(false);
chart->set_HasTitle(false);

chart->get_ChartData()->get_Categories()->Clear();
chart->get_ChartData()->get_Series()->Clear();

auto workbook = chart->get_ChartData()->get_ChartDataWorkbook();
workbook->Clear(0);

auto series = chart->get_ChartData()->get_Series()->Add(ChartType::Histogram);
auto values = MakeArray<double>({ 5, 10, 10, 11, 15, 20, 20, 21, 25, 30, 30, 31, 35, 40, 40, 41, 50 });
for (auto i = 0; i < values->get_Length(); i++)
{
    auto valueCell = workbook->GetCell(0, i, 0, ObjectExt::Box(values[i]));
    series->get_DataPoints()->AddDataPointForHistogramSeries(valueCell);
}

auto axis = chart->get_Axes()->get_HorizontalAxis();
axis->set_AggregationType(AxisAggregationType::ByBinWidth);
axis->set_BinWidth(10);
axis->set_IsUnderflowBin(true);
axis->set_IsAutomaticUnderflowBin(false);
axis->set_UnderflowBin(10);
axis->set_IsOverflowBin(true);
axis->set_IsAutomaticOverflowBin(false);
axis->set_OverflowBin(40);

presentation->Save(u"Histogram-bin-width.pptx", SaveFormat::Pptx);
PowerPoint में प्रदर्शित प्रस्तुति बिन गिनती 3, 4, 4, 4, और 2 दिखाती है। अंडरफ़्लो बिन में 5, 10, 10 शामिल हैं, इसलिए इसका थ्रेशोल्ड समावेशी है। ओवरफ़्लो बिन में केवल 41, 50 शामिल हैं, इसलिए इसका थ्रेशोल्ड बहिष्करणीय है; दोनों मान 40 पूर्ववर्ती अंतराल में रहते हैं। आंतरिक बिन केवल अपने नीचे की सीमा से बड़े और ऊपर की सीमा से कम या बराबर मान रखती हैं।
बिन की संख्या निर्दिष्ट करें
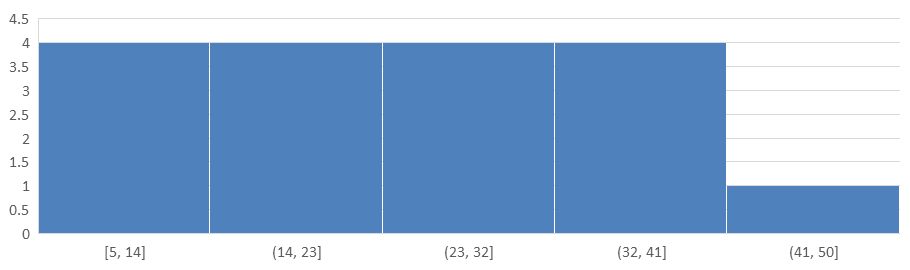
स्थिर अंतराल के बजाय स्थिर विवरण स्तर चाहते हैं, तो उसी डेटा के लिए पाँच बिन अनुरोध करें। यह उदाहरण अंडरफ़्लो और ओवरफ़्लो बिन को निष्क्रिय छोड़ता है। चार्ट डेटा रेंज से चौड़ाई निर्धारित करता है, इसलिए सीमाएँ रिपोर्टों के बीच बदल सकती हैं।
#include <system/array.h>
#include <system/shared_ptr.h>
#include <system/object_ext.h>
#include <system/string.h>
#include <DOM/Chart/AxisAggregationType.h>
#include <DOM/Chart/ChartType.h>
#include <DOM/Chart/IAxesManager.h>
#include <DOM/Chart/IAxis.h>
#include <DOM/Chart/IChartCategoryCollection.h>
#include <DOM/Chart/IChartData.h>
#include <DOM/Chart/IChartDataCell.h>
#include <DOM/Chart/IChartDataPoint.h>
#include <DOM/Chart/IChartDataPointCollection.h>
#include <DOM/Chart/IChartDataWorkbook.h>
#include <DOM/Chart/IChartSeries.h>
#include <DOM/Chart/IChartSeriesCollection.h>
#include <DOM/Chart/IFormat.h>
#include <DOM/IChart.h>
#include <DOM/IColorFormat.h>
#include <DOM/IFillFormat.h>
#include <DOM/ILineFillFormat.h>
#include <DOM/ILineFormat.h>
#include <DOM/IShapeCollection.h>
#include <DOM/ISlide.h>
#include <DOM/Presentation.h>
#include <Export/SaveFormat.h>

using namespace System;
using namespace Aspose::Slides;
using namespace Aspose::Slides::Charts;
using namespace Aspose::Slides::Export;

auto presentation = MakeObject<Presentation>();
auto slide = presentation->get_Slide(0);

auto chart = slide->get_Shapes()->AddChart(ChartType::Histogram, 20, 20, 680, 200);

chart->set_HasLegend(false);
chart->set_HasTitle(false);

chart->get_ChartData()->get_Categories()->Clear();
chart->get_ChartData()->get_Series()->Clear();

auto workbook = chart->get_ChartData()->get_ChartDataWorkbook();
workbook->Clear(0);

auto series = chart->get_ChartData()->get_Series()->Add(ChartType::Histogram);
auto values = MakeArray<double>({ 5, 10, 10, 11, 15, 20, 20, 21, 25, 30, 30, 31, 35, 40, 40, 41, 50 });
for (auto i = 0; i < values->get_Length(); i++)
{
    auto valueCell = workbook->GetCell(0, i, 0, ObjectExt::Box(values[i]));
    series->get_DataPoints()->AddDataPointForHistogramSeries(valueCell);
}

auto axis = chart->get_Axes()->get_HorizontalAxis();
axis->set_AggregationType(AxisAggregationType::ByNumberOfBins);
axis->set_NumberOfBins(5);

presentation->Save(u"Histogram-bin-count.pptx", SaveFormat::Pptx);
पाँच बिन की गिनती 4, 4, 4, 4, और 1 है। ऊपर के स्थिर‑चौड़ाई परिणाम से इस वितरण की तुलना करें: इनपुट मान समान हैं, लेकिन सीमाएँ अलग हैं।
रेडार चार्ट बनाएं
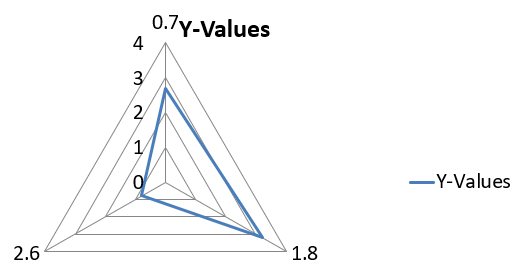
रेडार चार्ट बहु‑चर डेटा को दो‑आयामी फ़ॉर्मेट में दिखाते हैं, जिससे कई चरों की एक साथ आसान तुलना संभव होती है। ये कई प्रदर्शन मेट्रिक्स या गुणों में पैटर्न, ताकत, और कमजोरियों की पहचान करने में विशेष रूप से उपयोगी होते हैं।
यह उदाहरण डिफ़ॉल्ट सीरीज़ और श्रेणियों के साथ एक रेडार चार्ट बनाता है, जिसके लिए आप AddChart का उपयोग करते हैं, फिर प्रस्तुति को PPTX के रूप में सहेजते हैं।
#include <system/shared_ptr.h>
#include <DOM/Chart/ChartType.h>
#include <DOM/Chart/IChartCategoryCollection.h>
#include <DOM/Chart/IChartData.h>
#include <DOM/Chart/IChartSeriesCollection.h>
#include <DOM/Chart/IFormat.h>
#include <DOM/IChart.h>
#include <DOM/IColorFormat.h>
#include <DOM/IFillFormat.h>
#include <DOM/ILineFillFormat.h>
#include <DOM/ILineFormat.h>
#include <DOM/IShapeCollection.h>
#include <DOM/ISlide.h>
#include <DOM/Presentation.h>
#include <Export/SaveFormat.h>

using namespace System;
using namespace Aspose::Slides;
using namespace Aspose::Slides::Charts;
using namespace Aspose::Slides::Export;

auto presentation = MakeObject<Presentation>();
auto slide = presentation->get_Slide(0);

slide->get_Shapes()->AddChart(ChartType::Radar, 20, 20, 500, 300);

presentation->Save(u"Radar-chart.pptx", SaveFormat::Pptx);
परिणाम:
मल्टी‑कैटेगरी चार्ट बनाएं
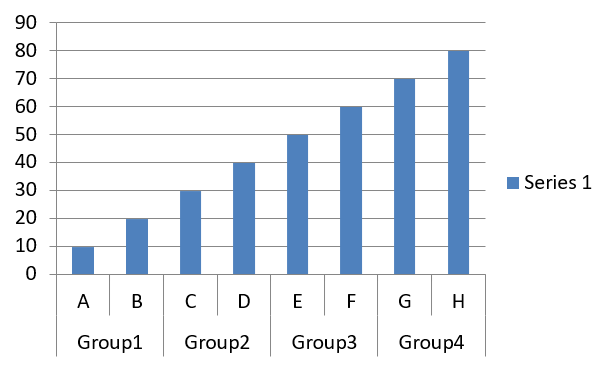
मल्टी‑कैटेगरी चार्ट उन डेटा को प्रदर्शित करने के लिए उपयोग किए जाते हैं जिनमें एक से अधिक श्रेणी समूह होते हैं, जिससे आप कई आयामों में मानों की तुलना एक साथ कर सकते हैं। ये जटिल, बहु‑स्तरीय डेटा सेट में रुझानों और रिश्तों का विश्लेषण करने में विशेष रूप से सहायक होते हैं।
यह उदाहरण चार जोड़े में व्यवस्थित आठ श्रेणियों के साथ एक क्लस्टर्ड कॉलम चार्ट बनाता है। SetGroupingItem विधि प्रत्येक जोड़े को स्तर 1 पर साझा लेबल देती है, जिससे व्यक्तिगत और समूह लेबल दोनों वाली एक श्रेणी एक्सिस बनती है।
#include <system/shared_ptr.h>
#include <system/object_ext.h>
#include <system/string.h>
#include <DOM/Chart/ChartType.h>
#include <DOM/Chart/IChartCategory.h>
#include <DOM/Chart/IChartCategoryCollection.h>
#include <DOM/Chart/IChartCategoryLevelsManager.h>
#include <DOM/Chart/IChartData.h>
#include <DOM/Chart/IChartDataCell.h>
#include <DOM/Chart/IChartDataPoint.h>
#include <DOM/Chart/IChartDataPointCollection.h>
#include <DOM/Chart/IChartDataWorkbook.h>
#include <DOM/Chart/IChartSeries.h>
#include <DOM/Chart/IChartSeriesCollection.h>
#include <DOM/Chart/IFormat.h>
#include <DOM/IChart.h>
#include <DOM/IColorFormat.h>
#include <DOM/IFillFormat.h>
#include <DOM/ILineFillFormat.h>
#include <DOM/ILineFormat.h>
#include <DOM/IShapeCollection.h>
#include <DOM/ISlide.h>
#include <DOM/Presentation.h>
#include <Export/SaveFormat.h>

using namespace System;
using namespace Aspose::Slides;
using namespace Aspose::Slides::Charts;
using namespace Aspose::Slides::Export;

auto presentation = MakeObject<Presentation>();
auto slide = presentation->get_Slide(0);

auto chart = slide->get_Shapes()->AddChart(ChartType::ClusteredColumn, 20, 20, 500, 300);

chart->get_ChartData()->get_Series()->Clear();
chart->get_ChartData()->get_Categories()->Clear();

auto workbook = chart->get_ChartData()->get_ChartDataWorkbook();
workbook->Clear(0);

auto worksheetIndex = 0;

auto categoryCell = workbook->GetCell(0, u"c2", ObjectExt::Box(String(u"A")));
auto category = chart->get_ChartData()->get_Categories()->Add(categoryCell);
category->get_GroupingLevels()->SetGroupingItem(1, ObjectExt::Box(String(u"Group1")));
categoryCell = workbook->GetCell(0, u"c3", ObjectExt::Box(String(u"B")));
category = chart->get_ChartData()->get_Categories()->Add(categoryCell);

categoryCell = workbook->GetCell(0, u"c4", ObjectExt::Box(String(u"C")));
category = chart->get_ChartData()->get_Categories()->Add(categoryCell);
category->get_GroupingLevels()->SetGroupingItem(1, ObjectExt::Box(String(u"Group2")));
categoryCell = workbook->GetCell(0, u"c5", ObjectExt::Box(String(u"D")));
category = chart->get_ChartData()->get_Categories()->Add(categoryCell);

categoryCell = workbook->GetCell(0, u"c6", ObjectExt::Box(String(u"E")));
category = chart->get_ChartData()->get_Categories()->Add(categoryCell);
category->get_GroupingLevels()->SetGroupingItem(1, ObjectExt::Box(String(u"Group3")));
categoryCell = workbook->GetCell(0, u"c7", ObjectExt::Box(String(u"F")));
category = chart->get_ChartData()->get_Categories()->Add(categoryCell);

categoryCell = workbook->GetCell(0, u"c8", ObjectExt::Box(String(u"G")));
category = chart->get_ChartData()->get_Categories()->Add(categoryCell);
category->get_GroupingLevels()->SetGroupingItem(1, ObjectExt::Box(String(u"Group4")));
categoryCell = workbook->GetCell(0, u"c9", ObjectExt::Box(String(u"H")));
category = chart->get_ChartData()->get_Categories()->Add(categoryCell);

auto seriesNameCell = workbook->GetCell(0, u"D1", ObjectExt::Box(String(u"Series 1")));
auto series = chart->get_ChartData()->get_Series()->Add(seriesNameCell, ChartType::ClusteredColumn);

auto valueCell = workbook->GetCell(worksheetIndex, u"D2", ObjectExt::Box(10));
series->get_DataPoints()->AddDataPointForBarSeries(valueCell);
valueCell = workbook->GetCell(worksheetIndex, u"D3", ObjectExt::Box(20));
series->get_DataPoints()->AddDataPointForBarSeries(valueCell);
valueCell = workbook->GetCell(worksheetIndex, u"D4", ObjectExt::Box(30));
series->get_DataPoints()->AddDataPointForBarSeries(valueCell);
valueCell = workbook->GetCell(worksheetIndex, u"D5", ObjectExt::Box(40));
series->get_DataPoints()->AddDataPointForBarSeries(valueCell);
valueCell = workbook->GetCell(worksheetIndex, u"D6", ObjectExt::Box(50));
series->get_DataPoints()->AddDataPointForBarSeries(valueCell);
valueCell = workbook->GetCell(worksheetIndex, u"D7", ObjectExt::Box(60));
series->get_DataPoints()->AddDataPointForBarSeries(valueCell);
valueCell = workbook->GetCell(worksheetIndex, u"D8", ObjectExt::Box(70));
series->get_DataPoints()->AddDataPointForBarSeries(valueCell);
valueCell = workbook->GetCell(worksheetIndex, u"D9", ObjectExt::Box(80));
series->get_DataPoints()->AddDataPointForBarSeries(valueCell);

presentation->Save(u"AsposeChart.pptx", SaveFormat::Pptx);
परिणाम:
मैप चार्ट बनाएं
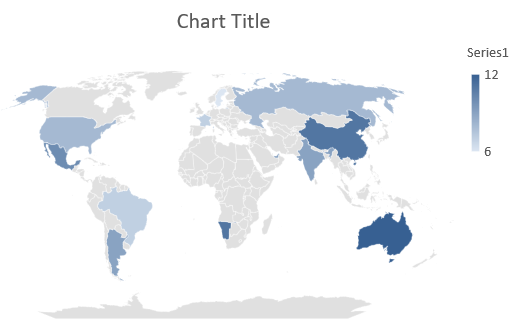
मैप चार्ट भौगोलिक डेटा को विशिष्ट स्थानों जैसे देशों, राज्यों, या शहरों पर मानचित्रित करके विज़ुअलाइज़ करने के लिए उपयोग किए जाते हैं। ये क्षेत्रीय रुझानों, जनसांख्यिकीय डेटा, और स्थानिक वितरण का स्पष्ट, दृश्य आकर्षक तरीके से विश्लेषण करने में मदद करते हैं।
यह उदाहरण AddChart का उपयोग करके डिफ़ॉल्ट भौगोलिक डेटा के साथ एक मैप चार्ट बनाता है और इसे PowerPoint में देखने के लिए सहेजता है।
#include <system/shared_ptr.h>
#include <DOM/Chart/ChartType.h>
#include <DOM/Chart/IChartCategoryCollection.h>
#include <DOM/Chart/IChartData.h>
#include <DOM/Chart/IChartSeriesCollection.h>
#include <DOM/Chart/IFormat.h>
#include <DOM/IChart.h>
#include <DOM/IColorFormat.h>
#include <DOM/IFillFormat.h>
#include <DOM/ILineFillFormat.h>
#include <DOM/ILineFormat.h>
#include <DOM/IShapeCollection.h>
#include <DOM/ISlide.h>
#include <DOM/Presentation.h>
#include <Export/SaveFormat.h>

using namespace System;
using namespace Aspose::Slides;
using namespace Aspose::Slides::Charts;
using namespace Aspose::Slides::Export;

auto presentation = MakeObject<Presentation>();
auto slide = presentation->get_Slide(0);

auto chart = slide->get_Shapes()->AddChart(ChartType::Map, 20, 20, 500, 300);

presentation->Save(u"mapChart.pptx", SaveFormat::Pptx);
परिणाम:
Note
ऊपर की तस्वीर में सहेजे गए प्रस्तुति को PowerPoint में खोला गया दिखाया गया है। Aspose.Slides मानचित्र चार्ट और उसका डेटा सही तरीके से लिखता है, लेकिन स्वयं मानचित्र चार्ट नहीं बनाता: जब किसी स्लाइड को जिसमें मानचित्र चार्ट हो, छवि में रेंडर किया जाता है या PDF या SVG में परिवर्तित किया जाता है, तो चार्ट क्षेत्र खाली निकलता है। उसी स्लाइड के अन्य आकार अप्रभावित रहते हैं।कंबिनेशन चार्ट बनाएं
कंबिनेशन चार्ट (या कॉम्बो चार्ट) एक ही ग्राफ़ में दो या अधिक चार्ट प्रकारों को जोड़ता है। यह चार्ट कई डेटा सेटों के बीच अंतर को उजागर, तुलना, या परीक्षण करने में मदद करता है, जिससे उनके बीच संबंधों की पहचान आसान हो जाती है।
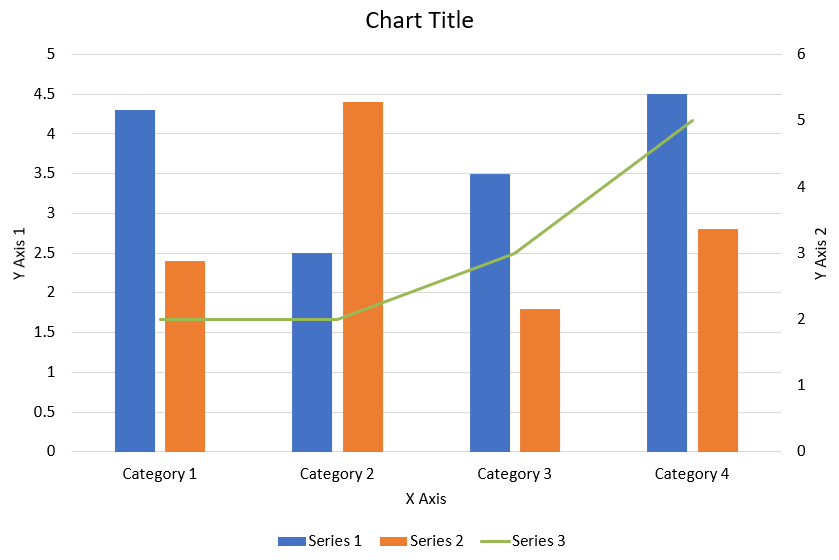
यह उदाहरण चार श्रेणियों में दो क्लस्टर्ड कॉलम सीरीज़ को एक लाइन सीरीज़ के साथ जोड़ता है। कॉलम प्राथमिक वर्टिकल एक्सिस का उपयोग करते हैं, जबकि set_PlotOnSecondAxis लाइन को दाईं ओर एक द्वितीयक वर्टिकल एक्सिस पर रखता है। हेल्पर फंक्शन शीर्षक, लेजेंड, एक्सिस लेबल, और ग्रिडलाइन को कॉन्फ़िगर करते हैं।
#include <DOM/Chart/IChartLinesFormat.h>
#include <DOM/Chart/IChartPortionFormat.h>
#include <DOM/Chart/IAxisFormat.h>
#include <system/shared_ptr.h>
#include <system/object_ext.h>
#include <system/string.h>
#include <drawing/color.h>
#include <DOM/Chart/AxisPositionType.h>
#include <DOM/Chart/ChartType.h>
#include <DOM/Chart/CrossesType.h>
#include <DOM/Chart/IAxesManager.h>
#include <DOM/Chart/IAxis.h>
#include <DOM/Chart/IChartCategoryCollection.h>
#include <DOM/Chart/IChartData.h>
#include <DOM/Chart/IChartDataCell.h>
#include <DOM/Chart/IChartDataPoint.h>
#include <DOM/Chart/IChartDataPointCollection.h>
#include <DOM/Chart/IChartDataWorkbook.h>
#include <DOM/Chart/IChartSeries.h>
#include <DOM/Chart/IChartSeriesCollection.h>
#include <DOM/Chart/IChartSeriesGroup.h>
#include <DOM/Chart/IChartSeriesGroupCollection.h>
#include <DOM/Chart/IChartTextFormat.h>
#include <DOM/Chart/IChartTitle.h>
#include <DOM/Chart/IFormat.h>
#include <DOM/Chart/ILegend.h>
#include <DOM/Chart/LegendPositionType.h>
#include <DOM/FillType.h>
#include <DOM/IChart.h>
#include <DOM/IColorFormat.h>
#include <DOM/IFillFormat.h>
#include <DOM/ILineFillFormat.h>
#include <DOM/ILineFormat.h>
#include <DOM/IParagraph.h>
#include <DOM/IParagraphCollection.h>
#include <DOM/IParagraphFormat.h>
#include <DOM/IPortionFormat.h>
#include <DOM/IShapeCollection.h>
#include <DOM/ISlide.h>
#include <DOM/ITextFrame.h>
#include <DOM/ITextFrameFormat.h>
#include <DOM/NullableBool.h>
#include <DOM/Presentation.h>
#include <Export/SaveFormat.h>

using namespace System;
using namespace System::Drawing;
using namespace Aspose::Slides;
using namespace Aspose::Slides::Charts;
using namespace Aspose::Slides::Export;

struct ComboChartExample
{
    static void CreateComboChart()
    {
        auto presentation = MakeObject<Presentation>();
        auto chart = CreateChartWithFirstSeries(presentation->get_Slide(0));

        AddSecondSeriesToChart(chart);
        AddThirdSeriesToChart(chart);

        SetPrimaryAxesFormat(chart);
        SetSecondaryAxesFormat(chart);

        presentation->Save(u"combo-chart.pptx", SaveFormat::Pptx);
    }

    static SharedPtr<IChart> CreateChartWithFirstSeries(SharedPtr<ISlide> slide)
    {
        auto chart = slide->get_Shapes()->AddChart(ChartType::ClusteredColumn, 50, 50, 600, 400);

        chart->set_HasTitle(true);
        chart->get_ChartTitle()->AddTextFrameForOverriding(u"Chart Title");
        chart->get_ChartTitle()->set_Overlay(false);
        auto portionFormat = chart->get_ChartTitle()->get_TextFrameForOverriding()->get_Paragraphs()->idx_get(0)->get_ParagraphFormat()->get_DefaultPortionFormat();
        portionFormat->set_FontBold(NullableBool::False);
        portionFormat->set_FontHeight(18.0f);

        chart->get_Legend()->set_Position(LegendPositionType::Bottom);
        chart->get_Legend()->get_TextFormat()->get_PortionFormat()->set_FontHeight(12.0f);

        chart->get_ChartData()->get_Series()->Clear();
        chart->get_ChartData()->get_Categories()->Clear();

        auto workbook = chart->get_ChartData()->get_ChartDataWorkbook();
        auto worksheetIndex = 0;

        auto categoryCell = workbook->GetCell(worksheetIndex, 1, 0, ObjectExt::Box(String(u"Category 1")));
        chart->get_ChartData()->get_Categories()->Add(categoryCell);
        categoryCell = workbook->GetCell(worksheetIndex, 2, 0, ObjectExt::Box(String(u"Category 2")));
        chart->get_ChartData()->get_Categories()->Add(categoryCell);
        categoryCell = workbook->GetCell(worksheetIndex, 3, 0, ObjectExt::Box(String(u"Category 3")));
        chart->get_ChartData()->get_Categories()->Add(categoryCell);
        categoryCell = workbook->GetCell(worksheetIndex, 4, 0, ObjectExt::Box(String(u"Category 4")));
        chart->get_ChartData()->get_Categories()->Add(categoryCell);

        auto seriesNameCell = workbook->GetCell(worksheetIndex, 0, 1, ObjectExt::Box(String(u"Series 1")));
        auto series = chart->get_ChartData()->get_Series()->Add(seriesNameCell, chart->get_Type());

        series->get_ParentSeriesGroup()->set_Overlap(-25);
        series->get_ParentSeriesGroup()->set_GapWidth(220);

        auto valueCell = workbook->GetCell(worksheetIndex, 1, 1, ObjectExt::Box(4.3));
        series->get_DataPoints()->AddDataPointForBarSeries(valueCell);
        valueCell = workbook->GetCell(worksheetIndex, 2, 1, ObjectExt::Box(2.5));
        series->get_DataPoints()->AddDataPointForBarSeries(valueCell);
        valueCell = workbook->GetCell(worksheetIndex, 3, 1, ObjectExt::Box(3.5));
        series->get_DataPoints()->AddDataPointForBarSeries(valueCell);
        valueCell = workbook->GetCell(worksheetIndex, 4, 1, ObjectExt::Box(4.5));
        series->get_DataPoints()->AddDataPointForBarSeries(valueCell);

        return chart;
    }

    static void AddSecondSeriesToChart(SharedPtr<IChart> chart)
    {
        auto workbook = chart->get_ChartData()->get_ChartDataWorkbook();
        const int worksheetIndex = 0;

        auto seriesNameCell = workbook->GetCell(worksheetIndex, 0, 2, ObjectExt::Box(String(u"Series 2")));
        auto series = chart->get_ChartData()->get_Series()->Add(seriesNameCell, ChartType::ClusteredColumn);

        series->get_ParentSeriesGroup()->set_Overlap(-25);
        series->get_ParentSeriesGroup()->set_GapWidth(220);

        auto valueCell = workbook->GetCell(worksheetIndex, 1, 2, ObjectExt::Box(2.4));
        series->get_DataPoints()->AddDataPointForBarSeries(valueCell);
        valueCell = workbook->GetCell(worksheetIndex, 2, 2, ObjectExt::Box(4.4));
        series->get_DataPoints()->AddDataPointForBarSeries(valueCell);
        valueCell = workbook->GetCell(worksheetIndex, 3, 2, ObjectExt::Box(1.8));
        series->get_DataPoints()->AddDataPointForBarSeries(valueCell);
        valueCell = workbook->GetCell(worksheetIndex, 4, 2, ObjectExt::Box(2.8));
        series->get_DataPoints()->AddDataPointForBarSeries(valueCell);
    }

    static void AddThirdSeriesToChart(SharedPtr<IChart> chart)
    {
        auto workbook = chart->get_ChartData()->get_ChartDataWorkbook();
        const int worksheetIndex = 0;

        auto seriesNameCell = workbook->GetCell(worksheetIndex, 0, 3, ObjectExt::Box(String(u"Series 3")));
        auto series = chart->get_ChartData()->get_Series()->Add(seriesNameCell, ChartType::Line);

        auto valueCell = workbook->GetCell(worksheetIndex, 1, 3, ObjectExt::Box(2.0));
        series->get_DataPoints()->AddDataPointForLineSeries(valueCell);
        valueCell = workbook->GetCell(worksheetIndex, 2, 3, ObjectExt::Box(2.0));
        series->get_DataPoints()->AddDataPointForLineSeries(valueCell);
        valueCell = workbook->GetCell(worksheetIndex, 3, 3, ObjectExt::Box(3.0));
        series->get_DataPoints()->AddDataPointForLineSeries(valueCell);
        valueCell = workbook->GetCell(worksheetIndex, 4, 3, ObjectExt::Box(5.0));
        series->get_DataPoints()->AddDataPointForLineSeries(valueCell);

        series->set_PlotOnSecondAxis(true);
    }

    static void SetPrimaryAxesFormat(SharedPtr<IChart> chart)
    {
        auto horizontalAxis = chart->get_Axes()->get_HorizontalAxis();
        horizontalAxis->get_TextFormat()->get_PortionFormat()->set_FontHeight(12.0f);
        horizontalAxis->get_Format()->get_Line()->get_FillFormat()->set_FillType(FillType::NoFill);

        SetAxisTitle(horizontalAxis, u"X Axis");

        auto verticalAxis = chart->get_Axes()->get_VerticalAxis();
        verticalAxis->get_TextFormat()->get_PortionFormat()->set_FontHeight(12.0f);
        verticalAxis->get_Format()->get_Line()->get_FillFormat()->set_FillType(FillType::NoFill);

        SetAxisTitle(verticalAxis, u"Y Axis 1");

        auto majorGridLinesFormat = verticalAxis->get_MajorGridLinesFormat()->get_Line()->get_FillFormat();
        majorGridLinesFormat->set_FillType(FillType::Solid);
        majorGridLinesFormat->get_SolidFillColor()->set_Color(Color::FromArgb(217, 217, 217));
    }

    static void SetSecondaryAxesFormat(SharedPtr<IChart> chart)
    {
        auto secondaryHorizontalAxis = chart->get_Axes()->get_SecondaryHorizontalAxis();
        secondaryHorizontalAxis->set_Position(AxisPositionType::Bottom);
        secondaryHorizontalAxis->set_CrossType(CrossesType::Maximum);
        secondaryHorizontalAxis->set_IsVisible(false);
        secondaryHorizontalAxis->get_MajorGridLinesFormat()->get_Line()->get_FillFormat()->set_FillType(FillType::NoFill);
        secondaryHorizontalAxis->get_MinorGridLinesFormat()->get_Line()->get_FillFormat()->set_FillType(FillType::NoFill);

        auto secondaryVerticalAxis = chart->get_Axes()->get_SecondaryVerticalAxis();
        secondaryVerticalAxis->set_Position(AxisPositionType::Right);
        secondaryVerticalAxis->get_TextFormat()->get_PortionFormat()->set_FontHeight(12.0f);
        secondaryVerticalAxis->get_Format()->get_Line()->get_FillFormat()->set_FillType(FillType::NoFill);
        secondaryVerticalAxis->get_MajorGridLinesFormat()->get_Line()->get_FillFormat()->set_FillType(FillType::NoFill);
        secondaryVerticalAxis->get_MinorGridLinesFormat()->get_Line()->get_FillFormat()->set_FillType(FillType::NoFill);

        SetAxisTitle(secondaryVerticalAxis, u"Y Axis 2");
    }

    static void SetAxisTitle(SharedPtr<IAxis> axis, String axisTitle)
    {
        axis->set_HasTitle(true);
        axis->get_Title()->set_Overlay(false);
        auto titlePortionFormat = axis->get_Title()->AddTextFrameForOverriding(axisTitle)->get_Paragraphs()->idx_get(0)->get_ParagraphFormat()->get_DefaultPortionFormat();
        titlePortionFormat->set_FontBold(NullableBool::False);
        titlePortionFormat->set_FontHeight(12.0f);
    }
};

ComboChartExample::CreateComboChart();
चार्ट अपडेट करें
Aspose.Slides for C++ आपको चार्ट डेटा, फ़ॉर्मेटिंग, और स्टाइलिंग को संशोधित करके PowerPoint चार्ट अपडेट करने में सक्षम बनाता है। यह कार्यक्षमता गतिशील सामग्री के साथ प्रस्तुतियों को अद्यतन रखने की प्रक्रिया को सरल बनाती है और यह सुनिश्चित करती है कि चार्ट वर्तमान डेटा और दृश्य मानकों को सटीक रूप से दर्शाएँ।
यह उदाहरण मौजूदा प्रस्तुति की पहली स्लाइड पर “My chart” नामक चार्ट को अपडेट करता है। इसमें प्रत्येक में तीन डेटा पॉइंट वाली दो कॉलम सीरीज़ की आवश्यकता होती है, जहाँ श्रेणी लेबल कॉलम A में होते हैं और श्रृंखला नाम पहले शीट की पहली पंक्ति में होते हैं। उदाहरण GetCell का उपयोग करके वर्कबुक सेल को बदलता है, सीरीज़ मान अपडेट करता है, तीसरी सीरीज़ जोड़ता है, और set_Type के माध्यम से चार्ट को क्लस्टर्ड सिलिंडर में बदलता है।
#include <system/shared_ptr.h>
#include <system/object_ext.h>
#include <system/string.h>
#include <DOM/Chart/ChartType.h>
#include <DOM/Chart/IChartCategoryCollection.h>
#include <DOM/Chart/IChartData.h>
#include <DOM/Chart/IChartDataCell.h>
#include <DOM/Chart/IChartDataPoint.h>
#include <DOM/Chart/IChartDataPointCollection.h>
#include <DOM/Chart/IChartDataWorkbook.h>
#include <DOM/Chart/IChartSeries.h>
#include <DOM/Chart/IChartSeriesCollection.h>
#include <DOM/Chart/IDoubleChartValue.h>
#include <DOM/Chart/IFormat.h>
#include <DOM/IChart.h>
#include <DOM/IColorFormat.h>
#include <DOM/IFillFormat.h>
#include <DOM/ILineFillFormat.h>
#include <DOM/ILineFormat.h>
#include <DOM/IShape.h>
#include <DOM/IShapeCollection.h>
#include <DOM/ISlide.h>
#include <DOM/Presentation.h>
#include <Export/SaveFormat.h>

using namespace System;
using namespace Aspose::Slides;
using namespace Aspose::Slides::Charts;
using namespace Aspose::Slides::Export;

const String chartName = u"My chart";

auto presentation = MakeObject<Presentation>(u"ExistingChart.pptx");
auto slide = presentation->get_Slide(0);

for (auto shape : slide->get_Shapes())
{
    auto chart = System::DynamicCast<IChart>(shape);
    if (chart != nullptr && chart->get_Name() == chartName)
    {
        auto worksheetIndex = 0;

        auto workbook = chart->get_ChartData()->get_ChartDataWorkbook();

        workbook->GetCell(worksheetIndex, 1, 0, ObjectExt::Box(String(u"Modified Category 1")));
        workbook->GetCell(worksheetIndex, 2, 0, ObjectExt::Box(String(u"Modified Category 2")));

        auto series = chart->get_ChartData()->get_Series()->idx_get(0);

        workbook->GetCell(worksheetIndex, 0, 1, ObjectExt::Box(String(u"New_Series 1")));
        series->get_DataPoints()->idx_get(0)->get_Value()->set_Data(ObjectExt::Box(90));
        series->get_DataPoints()->idx_get(1)->get_Value()->set_Data(ObjectExt::Box(123));
        series->get_DataPoints()->idx_get(2)->get_Value()->set_Data(ObjectExt::Box(44));

        series = chart->get_ChartData()->get_Series()->idx_get(1);

        workbook->GetCell(worksheetIndex, 0, 2, ObjectExt::Box(String(u"New_Series 2")));
        series->get_DataPoints()->idx_get(0)->get_Value()->set_Data(ObjectExt::Box(23));
        series->get_DataPoints()->idx_get(1)->get_Value()->set_Data(ObjectExt::Box(67));
        series->get_DataPoints()->idx_get(2)->get_Value()->set_Data(ObjectExt::Box(99));

        auto seriesNameCell = workbook->GetCell(worksheetIndex, 0, 3, ObjectExt::Box(String(u"Series 3")));
        series = chart->get_ChartData()->get_Series()->Add(seriesNameCell, chart->get_Type());

        auto valueCell = workbook->GetCell(worksheetIndex, 1, 3, ObjectExt::Box(20));
        series->get_DataPoints()->AddDataPointForBarSeries(valueCell);
        valueCell = workbook->GetCell(worksheetIndex, 2, 3, ObjectExt::Box(50));
        series->get_DataPoints()->AddDataPointForBarSeries(valueCell);
        valueCell = workbook->GetCell(worksheetIndex, 3, 3, ObjectExt::Box(30));
        series->get_DataPoints()->AddDataPointForBarSeries(valueCell);

        chart->set_Type(ChartType::ClusteredCylinder);
    }
}

presentation->Save(u"AsposeChartModified.pptx", SaveFormat::Pptx);
चार्ट के लिए डेटा रेंज सेट करें
मौजूदा चार्ट द्वारा उपयोग किए गए रेंज को देखने के लिए देखें एक चार्ट की डेटा रेंज पुनः प्राप्त करें।
Aspose.Slides for C++ आपको वर्कशीट से एक विशिष्ट डेटा रेंज को चार्ट के डेटा स्रोत के रूप में परिभाषित करने की लचीलापन देता है। इसका अर्थ है कि आप सीधे अपनी वर्कशीट के एक भाग को चार्ट से मैप कर सकते हैं, जिससे आप नियंत्रित कर सकते हैं कि कौन‑से सेल्स चार्ट की सीरीज़ और श्रेणियों में योगदान देते हैं। परिणामस्वरूप, आप अपनी शीट में नवीनतम डेटा परिवर्तन के साथ अपने चार्ट को आसानी से अपडेट और सिंक्रनाइज़ कर सकते हैं, जिससे आपकी PowerPoint प्रस्तुतियाँ वर्तमान और सटीक जानकारी दर्शाएँ।
यह उदाहरण SetRange का उपयोग करके मौजूदा प्रस्तुति की पहली स्लाइड पर “My chart” नामक चार्ट के डेटा स्रोत को Sheet1!A1:B4 पर सेट करता है। चार्ट वर्कबुक में वह शीट और एक भरपूर रेंज होना आवश्यक है, जहाँ पहली पंक्ति में सीरीज़ हेडिंग, कॉलम A में श्रेणी लेबल, और कॉलम B में तीन मान हों।
#include <system/shared_ptr.h>
#include <DOM/Chart/ChartType.h>
#include <DOM/Chart/IChartCategoryCollection.h>
#include <DOM/Chart/IChartData.h>
#include <DOM/Chart/IChartSeriesCollection.h>
#include <DOM/Chart/IFormat.h>
#include <DOM/IChart.h>
#include <DOM/IColorFormat.h>
#include <DOM/IFillFormat.h>
#include <DOM/ILineFillFormat.h>
#include <DOM/ILineFormat.h>
#include <DOM/IShape.h>
#include <DOM/IShapeCollection.h>
#include <DOM/ISlide.h>
#include <DOM/Presentation.h>
#include <Export/SaveFormat.h>

using namespace System;
using namespace Aspose::Slides;
using namespace Aspose::Slides::Charts;
using namespace Aspose::Slides::Export;

const String chartName = u"My chart";

auto presentation = MakeObject<Presentation>(u"ExistingChart.pptx");
auto slide = presentation->get_Slide(0);

for (auto shape : slide->get_Shapes())
{
    auto chart = System::DynamicCast<IChart>(shape);
    if (chart != nullptr && chart->get_Name() == chartName)
    {
        chart->get_ChartData()->SetRange(u"Sheet1!A1:B4");
    }
}

presentation->Save(u"SetDataRange.pptx", SaveFormat::Pptx);
चार्ट में डिफ़ॉल्ट मार्कर का उपयोग करें
जब आप चार्ट में डिफ़ॉल्ट मार्कर का प्रयोग करते हैं, तो प्रत्येक चार्ट सीरीज़ को स्वचालित रूप से एक अलग डिफ़ॉल्ट मार्कर प्रतीक मिलता है।
यह उदाहरण दो लाइन सीरीज़ और एक लेजेंड के साथ एक चार्ट बनाता है, जिसके लिए आप AddChart का उपयोग करते हैं। get_Marker सेटिंग्स स्वचालित रूप से असाइन किए गए मार्कर प्रतीकों को बरकरार रखती हैं। पहली सीरीज़ में एक नकारात्मक मान और एक लापता मान (nullptr) है, जबकि दूसरी में प्रत्येक श्रेणी के लिए मान है।
#include <system/shared_ptr.h>
#include <system/object_ext.h>
#include <system/string.h>
#include <DOM/Chart/ChartType.h>
#include <DOM/Chart/IChartCategoryCollection.h>
#include <DOM/Chart/IChartData.h>
#include <DOM/Chart/IChartDataCell.h>
#include <DOM/Chart/IChartDataPoint.h>
#include <DOM/Chart/IChartDataPointCollection.h>
#include <DOM/Chart/IChartDataWorkbook.h>
#include <DOM/Chart/IChartSeries.h>
#include <DOM/Chart/IChartSeriesCollection.h>
#include <DOM/Chart/IChartTextFormat.h>
#include <DOM/Chart/IFormat.h>
#include <DOM/Chart/ILegend.h>
#include <DOM/Chart/IMarker.h>
#include <DOM/IChart.h>
#include <DOM/IColorFormat.h>
#include <DOM/IFillFormat.h>
#include <DOM/ILineFillFormat.h>
#include <DOM/ILineFormat.h>
#include <DOM/IPortionFormat.h>
#include <DOM/IShapeCollection.h>
#include <DOM/ISlide.h>
#include <DOM/Presentation.h>
#include <Export/SaveFormat.h>

using namespace System;
using namespace Aspose::Slides;
using namespace Aspose::Slides::Charts;
using namespace Aspose::Slides::Export;

auto presentation = MakeObject<Presentation>();
auto slide = presentation->get_Slide(0);

auto chart = slide->get_Shapes()->AddChart(ChartType::LineWithMarkers, 10, 10, 400, 400);

chart->get_ChartData()->get_Series()->Clear();
chart->get_ChartData()->get_Categories()->Clear();

auto workbook = chart->get_ChartData()->get_ChartDataWorkbook();

auto seriesNameCell = workbook->GetCell(0, 0, 1, ObjectExt::Box(String(u"Series 1")));
auto series = chart->get_ChartData()->get_Series()->Add(seriesNameCell, chart->get_Type());

auto categoryCell = workbook->GetCell(0, 1, 0, ObjectExt::Box(String(u"C1")));
chart->get_ChartData()->get_Categories()->Add(categoryCell);
auto valueCell = workbook->GetCell(0, 1, 1, ObjectExt::Box(24));
series->get_DataPoints()->AddDataPointForLineSeries(valueCell);

categoryCell = workbook->GetCell(0, 2, 0, ObjectExt::Box(String(u"C2")));
chart->get_ChartData()->get_Categories()->Add(categoryCell);
valueCell = workbook->GetCell(0, 2, 1, ObjectExt::Box(23));
series->get_DataPoints()->AddDataPointForLineSeries(valueCell);

categoryCell = workbook->GetCell(0, 3, 0, ObjectExt::Box(String(u"C3")));
chart->get_ChartData()->get_Categories()->Add(categoryCell);
valueCell = workbook->GetCell(0, 3, 1, ObjectExt::Box(-10));
series->get_DataPoints()->AddDataPointForLineSeries(valueCell);

categoryCell = workbook->GetCell(0, 4, 0, ObjectExt::Box(String(u"C4")));
chart->get_ChartData()->get_Categories()->Add(categoryCell);
valueCell = workbook->GetCell(0, 4, 1, nullptr);
series->get_DataPoints()->AddDataPointForLineSeries(valueCell);

seriesNameCell = workbook->GetCell(0, 0, 2, ObjectExt::Box(String(u"Series 2")));
auto secondSeries = chart->get_ChartData()->get_Series()->Add(seriesNameCell, chart->get_Type());

valueCell = workbook->GetCell(0, 1, 2, ObjectExt::Box(30));
secondSeries->get_DataPoints()->AddDataPointForLineSeries(valueCell);
valueCell = workbook->GetCell(0, 2, 2, ObjectExt::Box(10));
secondSeries->get_DataPoints()->AddDataPointForLineSeries(valueCell);
valueCell = workbook->GetCell(0, 3, 2, ObjectExt::Box(60));
secondSeries->get_DataPoints()->AddDataPointForLineSeries(valueCell);
valueCell = workbook->GetCell(0, 4, 2, ObjectExt::Box(40));
secondSeries->get_DataPoints()->AddDataPointForLineSeries(valueCell);

chart->set_HasLegend(true);
chart->get_Legend()->set_Overlay(false);

presentation->Save(u"DefaultMarkersInChart.pptx", SaveFormat::Pptx);
FAQ
Aspose.Slides for C++ द्वारा कौन‑से चार्ट प्रकार समर्थित हैं?
Aspose.Slides for C++ विभिन्न प्रकार के चार्ट को समर्थन देता है, जिसमें बार, लाइन, पाई, एरिया, स्कैटर, हिस्टोग्राम, रेडार, और कई अन्य शामिल हैं। यह लचीलापन आपको डेटा विज़ुअलाइज़ेशन की आवश्यकताओं के अनुसार सबसे उपयुक्त चार्ट प्रकार चुनने की अनुमति देता है।
मैं स्लाइड में नया चार्ट कैसे जोड़ूँ?
चार्ट जोड़ने के लिए, आप पहले Presentation क्लास की एक instance बनाते हैं, इच्छित स्लाइड को उसके इंडेक्स से प्राप्त करते हैं, और फिर चार्ट जोड़ने के मेथड को कॉल करके चार्ट प्रकार और प्रारंभिक डेटा निर्दिष्ट करते हैं। यह प्रक्रिया चार्ट को सीधे आपकी प्रस्तुति में एकीकृत करती है।
मैं चार्ट में प्रदर्शित डेटा को कैसे अपडेट करूँ?
आप चार्ट के डेटा वर्कबुक (IChartDataWorkbook) को एक्सेस करके, किसी भी डिफ़ॉल्ट सीरीज़ और श्रेणियों को साफ़ करके, और अपनी कस्टम डेटा जोड़कर चार्ट का डेटा अपडेट कर सकते हैं। यह आपको प्रोग्रामmatically चार्ट को नवीनतम डेटा के अनुसार रीफ़्रेश करने की अनुमति देता है।
क्या चार्ट की उपस्थिति को अनुकूलित करना संभव है?
हाँ, Aspose.Slides for C++ विस्तृत अनुकूलन विकल्प प्रदान करता है। आप रंग, फ़ॉन्ट, लेबल, लेजेंड, और अन्य फ़ॉर्मेटिंग तत्वों को संशोधित करके चार्ट की उपस्थिति को अपने विशिष्ट डिज़ाइन आवश्यकताओं के अनुसार ढाल सकते हैं।