
Skapa eller uppdatera PowerPoint‑presentationens diagram i C++
Översikt
Den här artikeln ger en omfattande guide om hur man skapar och anpassar diagram med Aspose.Slides för C++. Du kommer att lära dig hur du programatiskt lägger till ett diagram på en bild, fyller det med data och tillämpar olika formateringsalternativ för att matcha dina specifika designkrav. Genom hela artikeln illustrerar detaljerade kodexempel varje steg, från att initiera presentationen och diagramobjektet till att konfigurera serier, axlar och förklaringar. Genom att följa den här guiden får du en solid förståelse för hur du integrerar dynamisk diagramgenerering i dina C++‑program, vilket förenklar processen för att skapa datadrivna presentationer.
Skapa ett diagram
Diagram hjälper folk att snabbt visualisera data och få insikter som kanske inte är omedelbart uppenbara från en tabell eller kalkylblad.
Varför skapa diagram?
- Sammanfatta, komprimera eller summera stora mängder data på en enda bild i en presentation;
- Visa mönster och trender i data;
- Sluta sig på riktning och momentum för data över tid eller i förhållande till en specifik mätenhet;
- Upptäcka avvikare, avvikelser, fel och nonsensisk data;
- Kommunicera eller presentera komplex data.
I PowerPoint kan du skapa diagram via Insert-funktionen, som tillhandahåller mallar för att designa många diagramtyper. Med Aspose.Slides kan du skapa både vanliga diagram (baserade på populära diagramtyper) och anpassade diagram.
Note
Använd ChartType enumeration under namnrymden Aspose::Slides::Charts. Värdena i denna enumeration motsvarar olika diagramtyper.Skapa grupperade kolumn diagram
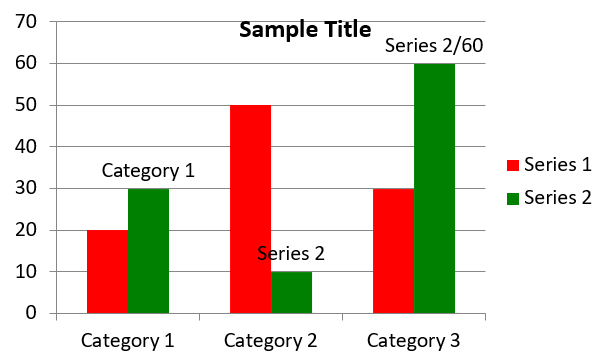
Detta exempel använder AddChart för att skapa ett grupperat kolumndiagram som jämför två serier över tre kategorier. Serierna använder röd och grön fyllning, och enskilda etiketter visar kategorinamn, serienamn och värden. Arbetsboksindex 0 hänvisar till det första bladet i den inbäddade diagramarboken.
#include <system/shared_ptr.h>
#include <system/object_ext.h>
#include <system/string.h>
#include <drawing/color.h>
#include <DOM/Chart/ChartType.h>
#include <DOM/Chart/IChartCategoryCollection.h>
#include <DOM/Chart/IChartData.h>
#include <DOM/Chart/IChartDataCell.h>
#include <DOM/Chart/IChartDataPoint.h>
#include <DOM/Chart/IChartDataPointCollection.h>
#include <DOM/Chart/IChartDataWorkbook.h>
#include <DOM/Chart/IChartSeries.h>
#include <DOM/Chart/IChartSeriesCollection.h>
#include <DOM/Chart/IChartTitle.h>
#include <DOM/Chart/IDataLabel.h>
#include <DOM/Chart/IDataLabelCollection.h>
#include <DOM/Chart/IDataLabelFormat.h>
#include <DOM/Chart/IDoubleChartValue.h>
#include <DOM/Chart/IFormat.h>
#include <DOM/FillType.h>
#include <DOM/IChart.h>
#include <DOM/IColorFormat.h>
#include <DOM/IFillFormat.h>
#include <DOM/ILineFillFormat.h>
#include <DOM/ILineFormat.h>
#include <DOM/IShapeCollection.h>
#include <DOM/ISlide.h>
#include <DOM/ITextFrame.h>
#include <DOM/ITextFrameFormat.h>
#include <DOM/NullableBool.h>
#include <DOM/Presentation.h>
#include <Export/SaveFormat.h>

using namespace System;
using namespace System::Drawing;
using namespace Aspose::Slides;
using namespace Aspose::Slides::Charts;
using namespace Aspose::Slides::Export;

auto presentation = MakeObject<Presentation>();
auto slide = presentation->get_Slide(0);

auto chart = slide->get_Shapes()->AddChart(ChartType::ClusteredColumn, 20, 20, 500, 300);

chart->get_ChartTitle()->AddTextFrameForOverriding(u"Sample Title");
chart->get_ChartTitle()->get_TextFrameForOverriding()->get_TextFrameFormat()->set_CenterText(NullableBool::True);
chart->get_ChartTitle()->set_Height(20);
chart->set_HasTitle(true);

auto workbook = chart->get_ChartData()->get_ChartDataWorkbook();
auto worksheetIndex = 0;

chart->get_ChartData()->get_Series()->Clear();
chart->get_ChartData()->get_Categories()->Clear();

auto seriesNameCell = workbook->GetCell(worksheetIndex, 0, 1, ObjectExt::Box(String(u"Series 1")));
chart->get_ChartData()->get_Series()->Add(seriesNameCell, chart->get_Type());
seriesNameCell = workbook->GetCell(worksheetIndex, 0, 2, ObjectExt::Box(String(u"Series 2")));
chart->get_ChartData()->get_Series()->Add(seriesNameCell, chart->get_Type());

auto categoryCell = workbook->GetCell(worksheetIndex, 1, 0, ObjectExt::Box(String(u"Category 1")));
chart->get_ChartData()->get_Categories()->Add(categoryCell);
categoryCell = workbook->GetCell(worksheetIndex, 2, 0, ObjectExt::Box(String(u"Category 2")));
chart->get_ChartData()->get_Categories()->Add(categoryCell);
categoryCell = workbook->GetCell(worksheetIndex, 3, 0, ObjectExt::Box(String(u"Category 3")));
chart->get_ChartData()->get_Categories()->Add(categoryCell);

auto series = chart->get_ChartData()->get_Series()->idx_get(0);

auto valueCell = workbook->GetCell(worksheetIndex, 1, 1, ObjectExt::Box(20));
series->get_DataPoints()->AddDataPointForBarSeries(valueCell);
valueCell = workbook->GetCell(worksheetIndex, 2, 1, ObjectExt::Box(50));
series->get_DataPoints()->AddDataPointForBarSeries(valueCell);
valueCell = workbook->GetCell(worksheetIndex, 3, 1, ObjectExt::Box(30));
series->get_DataPoints()->AddDataPointForBarSeries(valueCell);

series->get_Format()->get_Fill()->set_FillType(FillType::Solid);
series->get_Format()->get_Fill()->get_SolidFillColor()->set_Color(Color::get_Red());

series = chart->get_ChartData()->get_Series()->idx_get(1);

valueCell = workbook->GetCell(worksheetIndex, 1, 2, ObjectExt::Box(30));
series->get_DataPoints()->AddDataPointForBarSeries(valueCell);
valueCell = workbook->GetCell(worksheetIndex, 2, 2, ObjectExt::Box(10));
series->get_DataPoints()->AddDataPointForBarSeries(valueCell);
valueCell = workbook->GetCell(worksheetIndex, 3, 2, ObjectExt::Box(60));
series->get_DataPoints()->AddDataPointForBarSeries(valueCell);

series->get_Format()->get_Fill()->set_FillType(FillType::Solid);
series->get_Format()->get_Fill()->get_SolidFillColor()->set_Color(Color::get_Green());

auto label = series->get_DataPoints()->idx_get(0)->get_Label();
label->get_DataLabelFormat()->set_ShowCategoryName(true);

label = series->get_DataPoints()->idx_get(1)->get_Label();
label->get_DataLabelFormat()->set_ShowSeriesName(true);

label = series->get_DataPoints()->idx_get(2)->get_Label();
label->get_DataLabelFormat()->set_ShowValue(true);
label->get_DataLabelFormat()->set_ShowSeriesName(true);
label->get_DataLabelFormat()->set_Separator(u"/");

presentation->Save(u"AsposeChart.pptx", SaveFormat::Pptx);
Resultatet:
Skapa spridningsdiagram
Spridningsdiagram (även kända som spridningsplottar eller x‑y‑grafer) används ofta för att kontrollera mönster eller demonstrera korrelationer mellan två variabler.
Använd ett spridningsdiagram när:
- Du har parade numeriska data.
- Du har två variabler som passar bra ihop.
- Du vill avgöra om de två variablerna är relaterade.
- Du har en oberoende variabel som har flera värden för en beroende variabel.
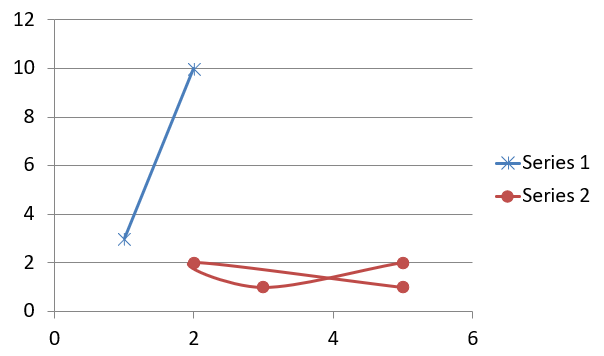
Detta exempel plottar två uppsättningar av x‑y‑värden. Den första serien använder raka linjer med stjärnmarkörer, medan den andra använder mjuka linjer med cirkelmarkörer; båda använder en markörstorlek på 10, inställd med set_Size. Metoden set_Symbol styr markörformen.
#include <system/shared_ptr.h>
#include <system/object_ext.h>
#include <system/string.h>
#include <DOM/Chart/ChartType.h>
#include <DOM/Chart/IChartCategoryCollection.h>
#include <DOM/Chart/IChartData.h>
#include <DOM/Chart/IChartDataCell.h>
#include <DOM/Chart/IChartDataPoint.h>
#include <DOM/Chart/IChartDataPointCollection.h>
#include <DOM/Chart/IChartDataWorkbook.h>
#include <DOM/Chart/IChartSeries.h>
#include <DOM/Chart/IChartSeriesCollection.h>
#include <DOM/Chart/IDoubleChartValue.h>
#include <DOM/Chart/IFormat.h>
#include <DOM/Chart/IMarker.h>
#include <DOM/Chart/MarkerStyleType.h>
#include <DOM/IChart.h>
#include <DOM/IColorFormat.h>
#include <DOM/IFillFormat.h>
#include <DOM/ILineFillFormat.h>
#include <DOM/ILineFormat.h>
#include <DOM/IShapeCollection.h>
#include <DOM/ISlide.h>
#include <DOM/Presentation.h>
#include <Export/SaveFormat.h>

using namespace System;
using namespace Aspose::Slides;
using namespace Aspose::Slides::Charts;
using namespace Aspose::Slides::Export;

auto presentation = MakeObject<Presentation>();
auto slide = presentation->get_Slide(0);

auto chart = slide->get_Shapes()->AddChart(ChartType::ScatterWithSmoothLines, 20, 20, 500, 300);

auto workbook = chart->get_ChartData()->get_ChartDataWorkbook();
auto worksheetIndex = 0;

chart->get_ChartData()->get_Series()->Clear();

auto seriesNameCell = workbook->GetCell(worksheetIndex, 1, 1, ObjectExt::Box(String(u"Series 1")));
chart->get_ChartData()->get_Series()->Add(seriesNameCell, chart->get_Type());
seriesNameCell = workbook->GetCell(worksheetIndex, 1, 3, ObjectExt::Box(String(u"Series 2")));
chart->get_ChartData()->get_Series()->Add(seriesNameCell, chart->get_Type());

auto series = chart->get_ChartData()->get_Series()->idx_get(0);

auto xValueCell = workbook->GetCell(worksheetIndex, 2, 1, ObjectExt::Box(1));
auto yValueCell = workbook->GetCell(worksheetIndex, 2, 2, ObjectExt::Box(3));
series->get_DataPoints()->AddDataPointForScatterSeries(xValueCell, yValueCell);

xValueCell = workbook->GetCell(worksheetIndex, 3, 1, ObjectExt::Box(2));
yValueCell = workbook->GetCell(worksheetIndex, 3, 2, ObjectExt::Box(10));
series->get_DataPoints()->AddDataPointForScatterSeries(xValueCell, yValueCell);

series->set_Type(ChartType::ScatterWithStraightLinesAndMarkers);

series->get_Marker()->set_Size(10);
series->get_Marker()->set_Symbol(MarkerStyleType::Star);

series = chart->get_ChartData()->get_Series()->idx_get(1);

xValueCell = workbook->GetCell(worksheetIndex, 2, 3, ObjectExt::Box(5));
yValueCell = workbook->GetCell(worksheetIndex, 2, 4, ObjectExt::Box(2));
series->get_DataPoints()->AddDataPointForScatterSeries(xValueCell, yValueCell);

xValueCell = workbook->GetCell(worksheetIndex, 3, 3, ObjectExt::Box(3));
yValueCell = workbook->GetCell(worksheetIndex, 3, 4, ObjectExt::Box(1));
series->get_DataPoints()->AddDataPointForScatterSeries(xValueCell, yValueCell);

xValueCell = workbook->GetCell(worksheetIndex, 4, 3, ObjectExt::Box(2));
yValueCell = workbook->GetCell(worksheetIndex, 4, 4, ObjectExt::Box(2));
series->get_DataPoints()->AddDataPointForScatterSeries(xValueCell, yValueCell);

xValueCell = workbook->GetCell(worksheetIndex, 5, 3, ObjectExt::Box(5));
yValueCell = workbook->GetCell(worksheetIndex, 5, 4, ObjectExt::Box(1));
series->get_DataPoints()->AddDataPointForScatterSeries(xValueCell, yValueCell);

series->get_Marker()->set_Size(10);
series->get_Marker()->set_Symbol(MarkerStyleType::Circle);

presentation->Save(u"AsposeChart.pptx", SaveFormat::Pptx);
Resultatet:
Skapa cirkeldiagram
Cirkeldiagram används bäst för att visa del‑till‑helhets‑förhållandet i data, särskilt när data innehåller kategoriska etiketter med numeriska värden. Om dina data innehåller många delar eller etiketter kan det vara bättre att använda ett stapeldiagram istället.
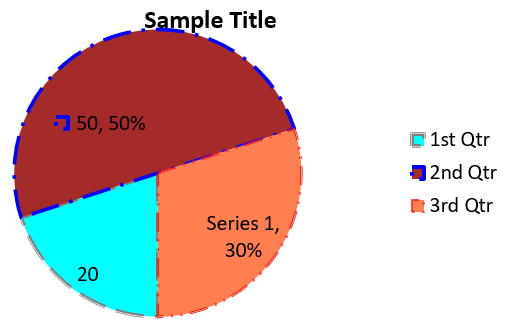
Detta exempel skapar ett cirkeldiagram med tre kvartalsvärden. Varje del har en anpassad fyllning och kant, och etiketterna visar olika kombinationer av värden, procentsatser och serieinformation. Metoden set_FirstSliceAngle sätter den första delen att starta vid 180 grader.
#include <system/shared_ptr.h>
#include <system/object_ext.h>
#include <system/string.h>
#include <drawing/color.h>
#include <DOM/Chart/ChartType.h>
#include <DOM/Chart/IChartCategoryCollection.h>
#include <DOM/Chart/IChartData.h>
#include <DOM/Chart/IChartDataCell.h>
#include <DOM/Chart/IChartDataPoint.h>
#include <DOM/Chart/IChartDataPointCollection.h>
#include <DOM/Chart/IChartDataWorkbook.h>
#include <DOM/Chart/IChartSeries.h>
#include <DOM/Chart/IChartSeriesCollection.h>
#include <DOM/Chart/IChartSeriesGroup.h>
#include <DOM/Chart/IChartSeriesGroupCollection.h>
#include <DOM/Chart/IChartTextFormat.h>
#include <DOM/Chart/IChartTitle.h>
#include <DOM/Chart/IDataLabel.h>
#include <DOM/Chart/IDataLabelCollection.h>
#include <DOM/Chart/IDataLabelFormat.h>
#include <DOM/Chart/IDoubleChartValue.h>
#include <DOM/Chart/IFormat.h>
#include <DOM/Chart/ILegend.h>
#include <DOM/FillType.h>
#include <DOM/IChart.h>
#include <DOM/IColorFormat.h>
#include <DOM/IFillFormat.h>
#include <DOM/ILineFillFormat.h>
#include <DOM/ILineFormat.h>
#include <DOM/IPortionFormat.h>
#include <DOM/IShapeCollection.h>
#include <DOM/ISlide.h>
#include <DOM/ITextFrame.h>
#include <DOM/ITextFrameFormat.h>
#include <DOM/LineDashStyle.h>
#include <DOM/LineStyle.h>
#include <DOM/NullableBool.h>
#include <DOM/Presentation.h>
#include <Export/SaveFormat.h>

using namespace System;
using namespace System::Drawing;
using namespace Aspose::Slides;
using namespace Aspose::Slides::Charts;
using namespace Aspose::Slides::Export;

auto presentation = MakeObject<Presentation>();
auto slide = presentation->get_Slide(0);

auto chart = slide->get_Shapes()->AddChart(ChartType::Pie, 20, 20, 500, 300);

chart->get_ChartTitle()->AddTextFrameForOverriding(u"Sample Title");
chart->get_ChartTitle()->get_TextFrameForOverriding()->get_TextFrameFormat()->set_CenterText(NullableBool::True);
chart->get_ChartTitle()->set_Height(20);
chart->set_HasTitle(true);

chart->get_ChartData()->get_Series()->idx_get(0)->get_Labels()->get_DefaultDataLabelFormat()->set_ShowValue(true);

auto workbook = chart->get_ChartData()->get_ChartDataWorkbook();
auto worksheetIndex = 0;

chart->get_ChartData()->get_Series()->Clear();
chart->get_ChartData()->get_Categories()->Clear();

auto categoryCell = workbook->GetCell(0, 1, 0, ObjectExt::Box(String(u"1st Qtr")));
chart->get_ChartData()->get_Categories()->Add(categoryCell);
categoryCell = workbook->GetCell(0, 2, 0, ObjectExt::Box(String(u"2nd Qtr")));
chart->get_ChartData()->get_Categories()->Add(categoryCell);
categoryCell = workbook->GetCell(0, 3, 0, ObjectExt::Box(String(u"3rd Qtr")));
chart->get_ChartData()->get_Categories()->Add(categoryCell);

auto seriesNameCell = workbook->GetCell(0, 0, 1, ObjectExt::Box(String(u"Series 1")));
auto series = chart->get_ChartData()->get_Series()->Add(seriesNameCell, chart->get_Type());

auto valueCell = workbook->GetCell(worksheetIndex, 1, 1, ObjectExt::Box(20));
series->get_DataPoints()->AddDataPointForPieSeries(valueCell);
valueCell = workbook->GetCell(worksheetIndex, 2, 1, ObjectExt::Box(50));
series->get_DataPoints()->AddDataPointForPieSeries(valueCell);
valueCell = workbook->GetCell(worksheetIndex, 3, 1, ObjectExt::Box(30));
series->get_DataPoints()->AddDataPointForPieSeries(valueCell);

chart->get_ChartData()->get_SeriesGroups()->idx_get(0)->set_IsColorVaried(true);

auto firstSlice = series->get_DataPoints()->idx_get(0);
firstSlice->get_Format()->get_Fill()->set_FillType(FillType::Solid);
firstSlice->get_Format()->get_Fill()->get_SolidFillColor()->set_Color(Color::get_Cyan());

firstSlice->get_Format()->get_Line()->get_FillFormat()->set_FillType(FillType::Solid);
firstSlice->get_Format()->get_Line()->get_FillFormat()->get_SolidFillColor()->set_Color(Color::get_Gray());
firstSlice->get_Format()->get_Line()->set_Width(3.0);
firstSlice->get_Format()->get_Line()->set_Style(LineStyle::ThinThick);
firstSlice->get_Format()->get_Line()->set_DashStyle(LineDashStyle::LargeDash);

auto secondSlice = series->get_DataPoints()->idx_get(1);
secondSlice->get_Format()->get_Fill()->set_FillType(FillType::Solid);
secondSlice->get_Format()->get_Fill()->get_SolidFillColor()->set_Color(Color::get_Brown());

secondSlice->get_Format()->get_Line()->get_FillFormat()->set_FillType(FillType::Solid);
secondSlice->get_Format()->get_Line()->get_FillFormat()->get_SolidFillColor()->set_Color(Color::get_Blue());
secondSlice->get_Format()->get_Line()->set_Width(3.0);
secondSlice->get_Format()->get_Line()->set_Style(LineStyle::Single);
secondSlice->get_Format()->get_Line()->set_DashStyle(LineDashStyle::LargeDashDot);

auto thirdSlice = series->get_DataPoints()->idx_get(2);
thirdSlice->get_Format()->get_Fill()->set_FillType(FillType::Solid);
thirdSlice->get_Format()->get_Fill()->get_SolidFillColor()->set_Color(Color::get_Coral());

thirdSlice->get_Format()->get_Line()->get_FillFormat()->set_FillType(FillType::Solid);
thirdSlice->get_Format()->get_Line()->get_FillFormat()->get_SolidFillColor()->set_Color(Color::get_Red());
thirdSlice->get_Format()->get_Line()->set_Width(2.0);
thirdSlice->get_Format()->get_Line()->set_Style(LineStyle::ThinThin);
thirdSlice->get_Format()->get_Line()->set_DashStyle(LineDashStyle::LargeDashDotDot);

auto firstLabel = series->get_DataPoints()->idx_get(0)->get_Label();
firstLabel->get_DataLabelFormat()->set_ShowValue(true);

auto secondLabel = series->get_DataPoints()->idx_get(1)->get_Label();
secondLabel->get_DataLabelFormat()->set_ShowValue(true);
secondLabel->get_DataLabelFormat()->set_ShowLegendKey(true);
secondLabel->get_DataLabelFormat()->set_ShowPercentage(true);

auto thirdLabel = series->get_DataPoints()->idx_get(2)->get_Label();
thirdLabel->get_DataLabelFormat()->set_ShowSeriesName(true);
thirdLabel->get_DataLabelFormat()->set_ShowPercentage(true);

series->get_Labels()->get_DefaultDataLabelFormat()->set_ShowLeaderLines(true);

chart->get_ChartData()->get_SeriesGroups()->idx_get(0)->set_FirstSliceAngle(180);

presentation->Save(u"PieChart.pptx", SaveFormat::Pptx);
Resultatet:
Skapa linjediagram
Linjediagram (även kända som linjediagram) används bäst i situationer där du vill demonstrera förändringar i värde över tid. Med ett linjediagram kan du jämföra en stor mängd data på en gång, följa förändringar och trender över tid, markera avvikelser i dataserier och mer.
Detta exempel använder AddChart för att skapa ett linjediagram med standardserier och -kategorier, och sparar sedan presentationen som PPTX.
#include <system/shared_ptr.h>
#include <DOM/Chart/ChartType.h>
#include <DOM/Chart/IChartCategoryCollection.h>
#include <DOM/Chart/IChartData.h>
#include <DOM/Chart/IChartSeriesCollection.h>
#include <DOM/Chart/IFormat.h>
#include <DOM/IChart.h>
#include <DOM/IColorFormat.h>
#include <DOM/IFillFormat.h>
#include <DOM/ILineFillFormat.h>
#include <DOM/ILineFormat.h>
#include <DOM/IShapeCollection.h>
#include <DOM/ISlide.h>
#include <DOM/Presentation.h>
#include <Export/SaveFormat.h>

using namespace System;
using namespace Aspose::Slides;
using namespace Aspose::Slides::Charts;
using namespace Aspose::Slides::Export;

auto presentation = MakeObject<Presentation>();
auto slide = presentation->get_Slide(0);

auto lineChart = slide->get_Shapes()->AddChart(ChartType::Line, 20, 20, 500, 300);

presentation->Save(u"lineChart.pptx", SaveFormat::Pptx);
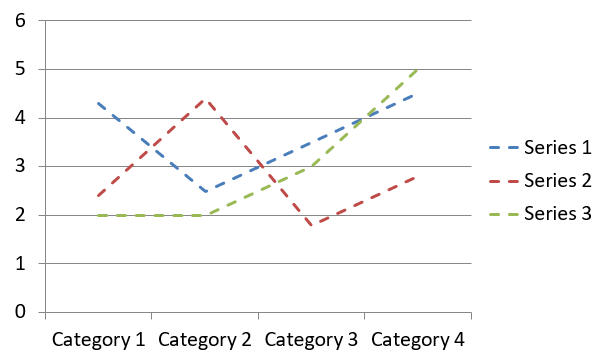
Som standard förenas punkter i ett linjediagram med raka, kontinuerliga linjer. Om du vill att punkterna ska förenas med streck istället, anropa set_DashStyle med ett värde från LineDashStyle:
#include <system/shared_ptr.h>
#include <DOM/Chart/ChartType.h>
#include <DOM/Chart/IChartCategoryCollection.h>
#include <DOM/Chart/IChartData.h>
#include <DOM/Chart/IChartSeries.h>
#include <DOM/Chart/IChartSeriesCollection.h>
#include <DOM/Chart/IFormat.h>
#include <DOM/IChart.h>
#include <DOM/IColorFormat.h>
#include <DOM/IFillFormat.h>
#include <DOM/ILineFillFormat.h>
#include <DOM/ILineFormat.h>
#include <DOM/IShapeCollection.h>
#include <DOM/ISlide.h>
#include <DOM/LineDashStyle.h>
#include <DOM/Presentation.h>

using namespace System;
using namespace Aspose::Slides;
using namespace Aspose::Slides::Charts;

auto presentation = MakeObject<Presentation>();
auto slide = presentation->get_Slide(0);

auto lineChart = slide->get_Shapes()->AddChart(ChartType::Line, 20, 20, 500, 300);

for (auto series : lineChart->get_ChartData()->get_Series())
{
    series->get_Format()->get_Line()->set_DashStyle(LineDashStyle::Dash);
}
Resultatet:
Skapa trädkartsdiagram
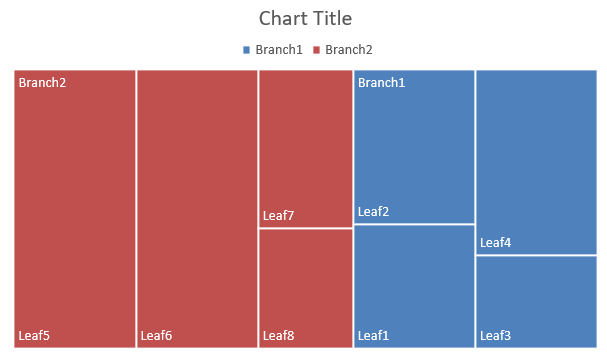
Trädkartsdiagram används bäst för försäljningsdata när du vill visa den relativa storleken på datakategorier och snabbt rikta uppmärksamheten mot poster som är stora bidragsgivare inom varje kategori.
Detta exempel skapar ett trädkarta med åtta löv grupperade i fyra stammar och två grenar. Metoden SetGroupingItem tilldelar stammar på gruppnivå 1 och grenar på nivå 2. Värdena bestämmer de relativa rektangelstorlekarna, medan kategorietiketter och överlappande föräldratiketter identifierar hierarkin.
#include <system/shared_ptr.h>
#include <system/object_ext.h>
#include <system/string.h>
#include <DOM/Chart/ChartType.h>
#include <DOM/Chart/IChartCategory.h>
#include <DOM/Chart/IChartCategoryCollection.h>
#include <DOM/Chart/IChartCategoryLevelsManager.h>
#include <DOM/Chart/IChartData.h>
#include <DOM/Chart/IChartDataCell.h>
#include <DOM/Chart/IChartDataPoint.h>
#include <DOM/Chart/IChartDataPointCollection.h>
#include <DOM/Chart/IChartDataWorkbook.h>
#include <DOM/Chart/IChartSeries.h>
#include <DOM/Chart/IChartSeriesCollection.h>
#include <DOM/Chart/IDataLabel.h>
#include <DOM/Chart/IDataLabelCollection.h>
#include <DOM/Chart/IDataLabelFormat.h>
#include <DOM/Chart/IFormat.h>
#include <DOM/Chart/ParentLabelLayoutType.h>
#include <DOM/IChart.h>
#include <DOM/IColorFormat.h>
#include <DOM/IFillFormat.h>
#include <DOM/ILineFillFormat.h>
#include <DOM/ILineFormat.h>
#include <DOM/IShapeCollection.h>
#include <DOM/ISlide.h>
#include <DOM/Presentation.h>
#include <Export/SaveFormat.h>

using namespace System;
using namespace Aspose::Slides;
using namespace Aspose::Slides::Charts;
using namespace Aspose::Slides::Export;

auto presentation = MakeObject<Presentation>();
auto slide = presentation->get_Slide(0);

auto chart = slide->get_Shapes()->AddChart(ChartType::Treemap, 20, 20, 500, 300);

chart->get_ChartData()->get_Categories()->Clear();
chart->get_ChartData()->get_Series()->Clear();

auto workbook = chart->get_ChartData()->get_ChartDataWorkbook();
workbook->Clear(0);

// Gren 1
auto categoryCell = workbook->GetCell(0, u"C1", ObjectExt::Box(String(u"Leaf1")));
auto leaf = chart->get_ChartData()->get_Categories()->Add(categoryCell);
leaf->get_GroupingLevels()->SetGroupingItem(1, ObjectExt::Box(String(u"Stem1")));
leaf->get_GroupingLevels()->SetGroupingItem(2, ObjectExt::Box(String(u"Branch1")));

categoryCell = workbook->GetCell(0, u"C2", ObjectExt::Box(String(u"Leaf2")));
chart->get_ChartData()->get_Categories()->Add(categoryCell);

categoryCell = workbook->GetCell(0, u"C3", ObjectExt::Box(String(u"Leaf3")));
leaf = chart->get_ChartData()->get_Categories()->Add(categoryCell);
leaf->get_GroupingLevels()->SetGroupingItem(1, ObjectExt::Box(String(u"Stem2")));

categoryCell = workbook->GetCell(0, u"C4", ObjectExt::Box(String(u"Leaf4")));
chart->get_ChartData()->get_Categories()->Add(categoryCell);

// Gren 2
categoryCell = workbook->GetCell(0, u"C5", ObjectExt::Box(String(u"Leaf5")));
leaf = chart->get_ChartData()->get_Categories()->Add(categoryCell);
leaf->get_GroupingLevels()->SetGroupingItem(1, ObjectExt::Box(String(u"Stem3")));
leaf->get_GroupingLevels()->SetGroupingItem(2, ObjectExt::Box(String(u"Branch2")));

categoryCell = workbook->GetCell(0, u"C6", ObjectExt::Box(String(u"Leaf6")));
chart->get_ChartData()->get_Categories()->Add(categoryCell);

categoryCell = workbook->GetCell(0, u"C7", ObjectExt::Box(String(u"Leaf7")));
leaf = chart->get_ChartData()->get_Categories()->Add(categoryCell);
leaf->get_GroupingLevels()->SetGroupingItem(1, ObjectExt::Box(String(u"Stem4")));

categoryCell = workbook->GetCell(0, u"C8", ObjectExt::Box(String(u"Leaf8")));
chart->get_ChartData()->get_Categories()->Add(categoryCell);

auto series = chart->get_ChartData()->get_Series()->Add(ChartType::Treemap);
series->get_Labels()->get_DefaultDataLabelFormat()->set_ShowCategoryName(true);
auto valueCell = workbook->GetCell(0, u"D1", ObjectExt::Box(4));
series->get_DataPoints()->AddDataPointForTreemapSeries(valueCell);
valueCell = workbook->GetCell(0, u"D2", ObjectExt::Box(5));
series->get_DataPoints()->AddDataPointForTreemapSeries(valueCell);
valueCell = workbook->GetCell(0, u"D3", ObjectExt::Box(3));
series->get_DataPoints()->AddDataPointForTreemapSeries(valueCell);
valueCell = workbook->GetCell(0, u"D4", ObjectExt::Box(6));
series->get_DataPoints()->AddDataPointForTreemapSeries(valueCell);
valueCell = workbook->GetCell(0, u"D5", ObjectExt::Box(9));
series->get_DataPoints()->AddDataPointForTreemapSeries(valueCell);
valueCell = workbook->GetCell(0, u"D6", ObjectExt::Box(9));
series->get_DataPoints()->AddDataPointForTreemapSeries(valueCell);
valueCell = workbook->GetCell(0, u"D7", ObjectExt::Box(4));
series->get_DataPoints()->AddDataPointForTreemapSeries(valueCell);
valueCell = workbook->GetCell(0, u"D8", ObjectExt::Box(3));
series->get_DataPoints()->AddDataPointForTreemapSeries(valueCell);

series->set_ParentLabelLayout(ParentLabelLayoutType::Overlapping);

presentation->Save(u"Treemap.pptx", SaveFormat::Pptx);
Resultatet:
Skapa vattenfallsdiagram
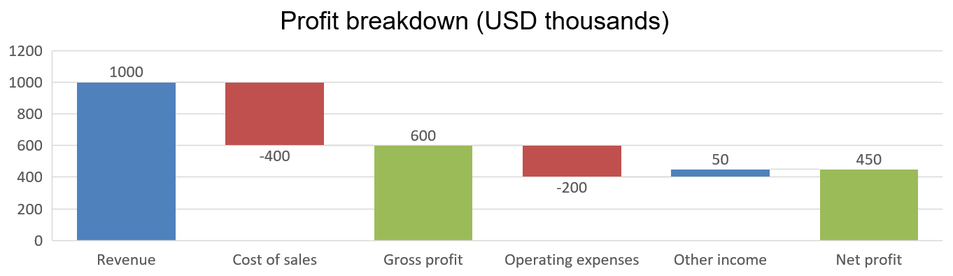
Ett vattenfallsdiagram visar hur positiva och negativa förändringar bidrar till ett slutvärde. Till exempel kan en vinstfördelning starta med intäkter, dra av kostnader och lägga till annan inkomst. Ändringskolumner svävar mellan föregående och nya löpande värden, medan totalkolumner sträcker sig från noll till det ackumulerade värdet.
| Kategori | Arbetsboksvärde | Kolumntyp |
|---|---|---|
| Intäkter | 1000 | Ökning |
| Försäljningskostnad | -400 | Minskning |
| Bruttoresultat | 600 | Mellanliggande total |
| Driftskostnader | -200 | Minskning |
| Övriga intäkter | 50 | Ökning |
| Nettovinst | 450 | Sluttotal |
För att markera en punkt som en mellanliggande eller slutlig total, anropa dess set_SetAsTotal metod med true. Ange det faktiska ackumulerade beloppet i punktens arbetsboks cell: 600 för bruttoresultat (1000 - 400) och 450 för nettovinst (600 - 200 + 50). Metoden markerar kolumnen som en total; den beräknar eller fyller inte i cellvärdet. Använd inte noll som platshållare eller ange en annan förändring för en totalpunkt. En totalkolumn visar det ackumulerade värdet utan att lägga till det igen till det löpande värdet.
Detta kompletta C++‑exempel skapar ett diagram med hjälp av Waterfall‑medlemmen i ChartType, rensar standarddata och fyller den inbäddade arbetsboken. Arbetsbladsindex 0 väljer det första arbetsbladet; kolumn A innehåller kategorinamnen och kolumn B innehåller värden. Varje värdecell läggs till med AddDataPointForWaterfallSeries. De nollbaserade punktindexen 2 och 5 identifierar de mellanliggande och slutliga totalerna. Att skicka true till set_ShowValue visar beloppen på kolumnerna. Ingen inmatningspresentation eller arbetsbok krävs.
#include <system/shared_ptr.h>
#include <system/object_ext.h>
#include <system/string.h>
#include <system/array.h>
#include <DOM/Chart/ChartType.h>
#include <DOM/Chart/IChartCategoryCollection.h>
#include <DOM/Chart/IChartData.h>
#include <DOM/Chart/IChartDataCell.h>
#include <DOM/Chart/IChartDataPoint.h>
#include <DOM/Chart/IChartDataPointCollection.h>
#include <DOM/Chart/IChartDataWorkbook.h>
#include <DOM/Chart/IChartSeries.h>
#include <DOM/Chart/IChartSeriesCollection.h>
#include <DOM/Chart/IChartTextFormat.h>
#include <DOM/Chart/IChartTitle.h>
#include <DOM/Chart/IDataLabel.h>
#include <DOM/Chart/IDataLabelCollection.h>
#include <DOM/Chart/IDataLabelFormat.h>
#include <DOM/Chart/IDoubleChartValue.h>
#include <DOM/Chart/IFormat.h>
#include <DOM/Chart/ILegend.h>
#include <DOM/IChart.h>
#include <DOM/IColorFormat.h>
#include <DOM/IFillFormat.h>
#include <DOM/ILineFillFormat.h>
#include <DOM/ILineFormat.h>
#include <DOM/IPortionFormat.h>
#include <DOM/IShapeCollection.h>
#include <DOM/ISlide.h>
#include <DOM/ITextFrame.h>
#include <DOM/ITextFrameFormat.h>
#include <DOM/NullableBool.h>
#include <DOM/Presentation.h>
#include <Export/SaveFormat.h>

using namespace System;
using namespace Aspose::Slides;
using namespace Aspose::Slides::Charts;
using namespace Aspose::Slides::Export;

auto presentation = MakeObject<Presentation>();
auto slide = presentation->get_Slide(0);

auto chart = slide->get_Shapes()->AddChart(ChartType::Waterfall, 20, 20, 680, 200);

chart->set_HasTitle(true);
chart->get_ChartTitle()->AddTextFrameForOverriding(u"Profit breakdown (USD thousands)");
chart->get_ChartTitle()->set_Overlay(false);
chart->set_HasLegend(false);

chart->get_ChartData()->get_Series()->Clear();
chart->get_ChartData()->get_Categories()->Clear();

auto workbook = chart->get_ChartData()->get_ChartDataWorkbook();
auto worksheetIndex = 0;

workbook->Clear(worksheetIndex);

auto seriesNameCell = workbook->GetCell(worksheetIndex, 0, 1, ObjectExt::Box(String(u"Profit")));
auto series = chart->get_ChartData()->get_Series()->Add(seriesNameCell, ChartType::Waterfall);
auto categories = MakeArray<String>({ u"Revenue", u"Cost of sales", u"Gross profit", u"Operating expenses", u"Other income", u"Net profit" });
auto values = MakeArray<double>({ 1000, -400, 600, -200, 50, 450 });

for (auto i = 0; i < categories->get_Length(); i++)
{
    auto categoryCell = workbook->GetCell(worksheetIndex, i + 1, 0, ObjectExt::Box(categories->idx_get(i)));
    chart->get_ChartData()->get_Categories()->Add(categoryCell);
    auto valueCell = workbook->GetCell(worksheetIndex, i + 1, 1, ObjectExt::Box(values->idx_get(i)));
    series->get_DataPoints()->AddDataPointForWaterfallSeries(valueCell);
}

// De tredje och sjätte punkterna representerar totaler, inte ytterligare förändringar.
series->get_DataPoints()->idx_get(2)->set_SetAsTotal(true);
series->get_DataPoints()->idx_get(5)->set_SetAsTotal(true);
series->set_ShowConnectorLines(true);
series->get_Labels()->get_DefaultDataLabelFormat()->set_ShowValue(true);

presentation->Save(u"WaterfallChart.pptx", SaveFormat::Pptx);
Anropa serie‑nivåmetoden set_ShowConnectorLines med true för att visa linjer som länkar ihop på varandra följande kolumner och göra det löpande värdet lättare att följa. För att dölja dessa linjer, ersätt tilldelningen i exemplet med series->set_ShowConnectorLines(false); innan du sparar. Detta ändrar endast linjens synlighet, inte data eller totaler.
Den sparade presentationen visar bruttoresultat på 600 och nettovinst på 450, med båda totalerna dragna från noll:
Skapa aktiediagram
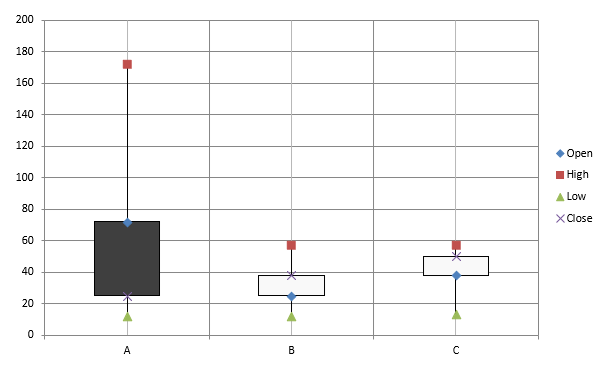
Aktiediagram används för att visa finansiella data såsom öppnings-, högsta-, lägsta- och stängningspriser, vilket hjälper till att analysera marknadstrender och volatilitet. De ger väsentliga insikter om aktieprestationer och stödjer investerare och analytiker i att fatta informerade beslut.
Detta exempel skapar ett öppnings‑höga‑låga‑stängnings‑diagram med fyra serier i den ordningen och tre kategorier. Metoden set_HasUpDownBars aktiverar upp/ner‑staplar, och get_HiLowLinesFormat styr hög‑låg‑linjerna som visar prisintervallen, medan de enskilda serielinjerna och mindre horisontella rutnätslinjer är dolda.
#include <DOM/Chart/IChartLinesFormat.h>
#include <system/shared_ptr.h>
#include <system/object_ext.h>
#include <system/string.h>
#include <DOM/Chart/ChartType.h>
#include <DOM/Chart/IAxesManager.h>
#include <DOM/Chart/IAxis.h>
#include <DOM/Chart/IChartCategoryCollection.h>
#include <DOM/Chart/IChartData.h>
#include <DOM/Chart/IChartDataCell.h>
#include <DOM/Chart/IChartDataPoint.h>
#include <DOM/Chart/IChartDataPointCollection.h>
#include <DOM/Chart/IChartDataWorkbook.h>
#include <DOM/Chart/IChartSeries.h>
#include <DOM/Chart/IChartSeriesCollection.h>
#include <DOM/Chart/IChartSeriesGroup.h>
#include <DOM/Chart/IChartSeriesGroupCollection.h>
#include <DOM/Chart/IFormat.h>
#include <DOM/Chart/IUpDownBarsManager.h>
#include <DOM/FillType.h>
#include <DOM/IChart.h>
#include <DOM/IColorFormat.h>
#include <DOM/IFillFormat.h>
#include <DOM/ILineFillFormat.h>
#include <DOM/ILineFormat.h>
#include <DOM/IShapeCollection.h>
#include <DOM/ISlide.h>
#include <DOM/Presentation.h>
#include <Export/SaveFormat.h>

using namespace System;
using namespace Aspose::Slides;
using namespace Aspose::Slides::Charts;
using namespace Aspose::Slides::Export;

auto presentation = MakeObject<Presentation>();
auto slide = presentation->get_Slide(0);

auto chart = slide->get_Shapes()->AddChart(ChartType::OpenHighLowClose, 20, 20, 500, 300, false);

auto workbook = chart->get_ChartData()->get_ChartDataWorkbook();

auto categoryCell = workbook->GetCell(0, 1, 0, ObjectExt::Box(String(u"A")));
chart->get_ChartData()->get_Categories()->Add(categoryCell);
categoryCell = workbook->GetCell(0, 2, 0, ObjectExt::Box(String(u"B")));
chart->get_ChartData()->get_Categories()->Add(categoryCell);
categoryCell = workbook->GetCell(0, 3, 0, ObjectExt::Box(String(u"C")));
chart->get_ChartData()->get_Categories()->Add(categoryCell);

auto seriesNameCell = workbook->GetCell(0, 0, 1, ObjectExt::Box(String(u"Open")));
chart->get_ChartData()->get_Series()->Add(seriesNameCell, ChartType::OpenHighLowClose);
seriesNameCell = workbook->GetCell(0, 0, 2, ObjectExt::Box(String(u"High")));
chart->get_ChartData()->get_Series()->Add(seriesNameCell, ChartType::OpenHighLowClose);
seriesNameCell = workbook->GetCell(0, 0, 3, ObjectExt::Box(String(u"Low")));
chart->get_ChartData()->get_Series()->Add(seriesNameCell, ChartType::OpenHighLowClose);
seriesNameCell = workbook->GetCell(0, 0, 4, ObjectExt::Box(String(u"Close")));
chart->get_ChartData()->get_Series()->Add(seriesNameCell, ChartType::OpenHighLowClose);

auto series = chart->get_ChartData()->get_Series()->idx_get(0);
auto valueCell = workbook->GetCell(0, 1, 1, ObjectExt::Box(72));
series->get_DataPoints()->AddDataPointForStockSeries(valueCell);
valueCell = workbook->GetCell(0, 2, 1, ObjectExt::Box(25));
series->get_DataPoints()->AddDataPointForStockSeries(valueCell);
valueCell = workbook->GetCell(0, 3, 1, ObjectExt::Box(38));
series->get_DataPoints()->AddDataPointForStockSeries(valueCell);

series = chart->get_ChartData()->get_Series()->idx_get(1);
valueCell = workbook->GetCell(0, 1, 2, ObjectExt::Box(172));
series->get_DataPoints()->AddDataPointForStockSeries(valueCell);
valueCell = workbook->GetCell(0, 2, 2, ObjectExt::Box(57));
series->get_DataPoints()->AddDataPointForStockSeries(valueCell);
valueCell = workbook->GetCell(0, 3, 2, ObjectExt::Box(57));
series->get_DataPoints()->AddDataPointForStockSeries(valueCell);

series = chart->get_ChartData()->get_Series()->idx_get(2);
valueCell = workbook->GetCell(0, 1, 3, ObjectExt::Box(12));
series->get_DataPoints()->AddDataPointForStockSeries(valueCell);
valueCell = workbook->GetCell(0, 2, 3, ObjectExt::Box(12));
series->get_DataPoints()->AddDataPointForStockSeries(valueCell);
valueCell = workbook->GetCell(0, 3, 3, ObjectExt::Box(13));
series->get_DataPoints()->AddDataPointForStockSeries(valueCell);

series = chart->get_ChartData()->get_Series()->idx_get(3);
valueCell = workbook->GetCell(0, 1, 4, ObjectExt::Box(25));
series->get_DataPoints()->AddDataPointForStockSeries(valueCell);
valueCell = workbook->GetCell(0, 2, 4, ObjectExt::Box(38));
series->get_DataPoints()->AddDataPointForStockSeries(valueCell);
valueCell = workbook->GetCell(0, 3, 4, ObjectExt::Box(50));
series->get_DataPoints()->AddDataPointForStockSeries(valueCell);

chart->get_ChartData()->get_SeriesGroups()->idx_get(0)->get_UpDownBars()->set_HasUpDownBars(true);
chart->get_ChartData()->get_SeriesGroups()->idx_get(0)->get_HiLowLinesFormat()->get_Line()->get_FillFormat()->set_FillType(FillType::Solid);

for (auto stockSeries : chart->get_ChartData()->get_Series())
{
    stockSeries->get_Format()->get_Line()->get_FillFormat()->set_FillType(FillType::NoFill);
}

chart->get_Axes()->get_VerticalAxis()->get_MinorGridLinesFormat()->get_Line()->get_FillFormat()->set_FillType(FillType::NoFill);

presentation->Save(u"Stock-chart.pptx", SaveFormat::Pptx);
Resultatet:
Skapa låd- och whisker-diagram
Låddiagram med whiskers används för att visa fördelningen av data genom att sammanfatta nyckelstatistiska mått, såsom median, kvartiler och möjliga avvikare. De är särskilt användbara i utforskande dataanalys och statistiska studier för att snabbt förstå datavariabilitet och identifiera eventuella avvikelser.
Detta exempel skapar ett låd- och whisker‑diagram från sex värden. Metoden set_QuartileMethod väljer den exklusiva kvartilsberäkningen. Exemplet aktiverar också medelvärdeslinjer, medelvärdesmarkörer, inre punkter och avvikarpunkter.
#include <system/shared_ptr.h>
#include <system/object_ext.h>
#include <system/string.h>
#include <DOM/Chart/ChartType.h>
#include <DOM/Chart/IChartCategoryCollection.h>
#include <DOM/Chart/IChartData.h>
#include <DOM/Chart/IChartDataCell.h>
#include <DOM/Chart/IChartDataPoint.h>
#include <DOM/Chart/IChartDataPointCollection.h>
#include <DOM/Chart/IChartDataWorkbook.h>
#include <DOM/Chart/IChartSeries.h>
#include <DOM/Chart/IChartSeriesCollection.h>
#include <DOM/Chart/IFormat.h>
#include <DOM/Chart/IMarker.h>
#include <DOM/Chart/QuartileMethodType.h>
#include <DOM/IChart.h>
#include <DOM/IColorFormat.h>
#include <DOM/IFillFormat.h>
#include <DOM/ILineFillFormat.h>
#include <DOM/ILineFormat.h>
#include <DOM/IShapeCollection.h>
#include <DOM/ISlide.h>
#include <DOM/Presentation.h>
#include <Export/SaveFormat.h>

using namespace System;
using namespace Aspose::Slides;
using namespace Aspose::Slides::Charts;
using namespace Aspose::Slides::Export;

auto presentation = MakeObject<Presentation>();
auto slide = presentation->get_Slide(0);

auto chart = slide->get_Shapes()->AddChart(ChartType::BoxAndWhisker, 20, 20, 500, 300);

chart->get_ChartData()->get_Categories()->Clear();
chart->get_ChartData()->get_Series()->Clear();

auto workbook = chart->get_ChartData()->get_ChartDataWorkbook();
workbook->Clear(0);

auto categoryCell = workbook->GetCell(0, u"A1", ObjectExt::Box(String(u"Category 1")));
chart->get_ChartData()->get_Categories()->Add(categoryCell);
categoryCell = workbook->GetCell(0, u"A2", ObjectExt::Box(String(u"Category 2")));
chart->get_ChartData()->get_Categories()->Add(categoryCell);
categoryCell = workbook->GetCell(0, u"A3", ObjectExt::Box(String(u"Category 3")));
chart->get_ChartData()->get_Categories()->Add(categoryCell);
categoryCell = workbook->GetCell(0, u"A4", ObjectExt::Box(String(u"Category 4")));
chart->get_ChartData()->get_Categories()->Add(categoryCell);
categoryCell = workbook->GetCell(0, u"A5", ObjectExt::Box(String(u"Category 5")));
chart->get_ChartData()->get_Categories()->Add(categoryCell);
categoryCell = workbook->GetCell(0, u"A6", ObjectExt::Box(String(u"Category 6")));
chart->get_ChartData()->get_Categories()->Add(categoryCell);

auto series = chart->get_ChartData()->get_Series()->Add(ChartType::BoxAndWhisker);

series->set_QuartileMethod(QuartileMethodType::Exclusive);
series->set_ShowMeanLine(true);
series->set_ShowMeanMarkers(true);
series->set_ShowInnerPoints(true);
series->set_ShowOutlierPoints(true);

auto valueCell = workbook->GetCell(0, u"B1", ObjectExt::Box(15));
series->get_DataPoints()->AddDataPointForBoxAndWhiskerSeries(valueCell);
valueCell = workbook->GetCell(0, u"B2", ObjectExt::Box(41));
series->get_DataPoints()->AddDataPointForBoxAndWhiskerSeries(valueCell);
valueCell = workbook->GetCell(0, u"B3", ObjectExt::Box(16));
series->get_DataPoints()->AddDataPointForBoxAndWhiskerSeries(valueCell);
valueCell = workbook->GetCell(0, u"B4", ObjectExt::Box(10));
series->get_DataPoints()->AddDataPointForBoxAndWhiskerSeries(valueCell);
valueCell = workbook->GetCell(0, u"B5", ObjectExt::Box(23));
series->get_DataPoints()->AddDataPointForBoxAndWhiskerSeries(valueCell);
valueCell = workbook->GetCell(0, u"B6", ObjectExt::Box(16));
series->get_DataPoints()->AddDataPointForBoxAndWhiskerSeries(valueCell);

presentation->Save(u"BoxAndWhisker.pptx", SaveFormat::Pptx);
Skapa trattdiagram
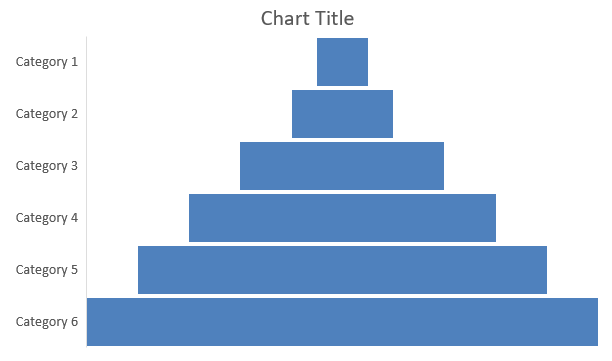
Trattdiagram används för att visualisera processer som involverar sekventiella steg, där datavolymen minskar när den går från ett steg till nästa. De är särskilt hjälpsamma för att analysera konverteringsgrader, identifiera flaskhalsar och följa effektiviteten i försäljnings- eller marknadsföringsprocesser.
Detta exempel använder AddChart för att lägga till ett trattdiagram på den första bilden i en befintlig presentation. Det ersätter standarddata med sex kategorier och värden som varierar från 50 till 500, och sparar sedan den uppdaterade presentationen. Inmatningspresentationen måste innehålla minst en bild.
#include <system/shared_ptr.h>
#include <system/object_ext.h>
#include <system/string.h>
#include <DOM/Chart/ChartType.h>
#include <DOM/Chart/IChartCategoryCollection.h>
#include <DOM/Chart/IChartData.h>
#include <DOM/Chart/IChartDataCell.h>
#include <DOM/Chart/IChartDataPoint.h>
#include <DOM/Chart/IChartDataPointCollection.h>
#include <DOM/Chart/IChartDataWorkbook.h>
#include <DOM/Chart/IChartSeries.h>
#include <DOM/Chart/IChartSeriesCollection.h>
#include <DOM/Chart/IFormat.h>
#include <DOM/IChart.h>
#include <DOM/IColorFormat.h>
#include <DOM/IFillFormat.h>
#include <DOM/ILineFillFormat.h>
#include <DOM/ILineFormat.h>
#include <DOM/IShapeCollection.h>
#include <DOM/ISlide.h>
#include <DOM/Presentation.h>
#include <Export/SaveFormat.h>

using namespace System;
using namespace Aspose::Slides;
using namespace Aspose::Slides::Charts;
using namespace Aspose::Slides::Export;

auto presentation = MakeObject<Presentation>(u"test.pptx");
auto slide = presentation->get_Slide(0);

auto chart = slide->get_Shapes()->AddChart(ChartType::Funnel, 50, 50, 500, 400);

chart->get_ChartData()->get_Categories()->Clear();
chart->get_ChartData()->get_Series()->Clear();

auto workbook = chart->get_ChartData()->get_ChartDataWorkbook();
workbook->Clear(0);

auto categoryCell = workbook->GetCell(0, u"A1", ObjectExt::Box(String(u"Category 1")));
chart->get_ChartData()->get_Categories()->Add(categoryCell);
categoryCell = workbook->GetCell(0, u"A2", ObjectExt::Box(String(u"Category 2")));
chart->get_ChartData()->get_Categories()->Add(categoryCell);
categoryCell = workbook->GetCell(0, u"A3", ObjectExt::Box(String(u"Category 3")));
chart->get_ChartData()->get_Categories()->Add(categoryCell);
categoryCell = workbook->GetCell(0, u"A4", ObjectExt::Box(String(u"Category 4")));
chart->get_ChartData()->get_Categories()->Add(categoryCell);
categoryCell = workbook->GetCell(0, u"A5", ObjectExt::Box(String(u"Category 5")));
chart->get_ChartData()->get_Categories()->Add(categoryCell);
categoryCell = workbook->GetCell(0, u"A6", ObjectExt::Box(String(u"Category 6")));
chart->get_ChartData()->get_Categories()->Add(categoryCell);

auto series = chart->get_ChartData()->get_Series()->Add(ChartType::Funnel);

auto valueCell = workbook->GetCell(0, u"B1", ObjectExt::Box(50));
series->get_DataPoints()->AddDataPointForFunnelSeries(valueCell);
valueCell = workbook->GetCell(0, u"B2", ObjectExt::Box(100));
series->get_DataPoints()->AddDataPointForFunnelSeries(valueCell);
valueCell = workbook->GetCell(0, u"B3", ObjectExt::Box(200));
series->get_DataPoints()->AddDataPointForFunnelSeries(valueCell);
valueCell = workbook->GetCell(0, u"B4", ObjectExt::Box(300));
series->get_DataPoints()->AddDataPointForFunnelSeries(valueCell);
valueCell = workbook->GetCell(0, u"B5", ObjectExt::Box(400));
series->get_DataPoints()->AddDataPointForFunnelSeries(valueCell);
valueCell = workbook->GetCell(0, u"B6", ObjectExt::Box(500));
series->get_DataPoints()->AddDataPointForFunnelSeries(valueCell);

presentation->Save(u"Funnel.pptx", SaveFormat::Pptx);
Resultatet:
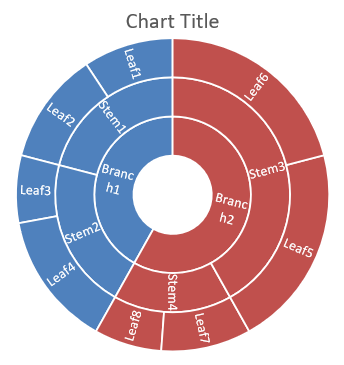
Skapa solstråle-diagram
Solstråle‑diagram används för att visualisera hierarkisk data, med nivåer som koncentriska ringar. De hjälper till att illustrera del‑till‑helhets‑relationer och är idealiska för att representera nästlade kategorier och underkategorier i ett tydligt, kompakt format.
Detta exempel skapar ett solstråle‑diagram med åtta löv grupperade i fyra stammar och två grenar. Metoden SetGroupingItem tilldelar stammar på gruppnivå 1 och grenar på nivå 2. Kategorietiketter identifierar segmenten, och värdena bestämmer deras relativa storlekar.
#include <system/shared_ptr.h>
#include <system/object_ext.h>
#include <system/string.h>
#include <DOM/Chart/ChartType.h>
#include <DOM/Chart/IChartCategory.h>
#include <DOM/Chart/IChartCategoryCollection.h>
#include <DOM/Chart/IChartCategoryLevelsManager.h>
#include <DOM/Chart/IChartData.h>
#include <DOM/Chart/IChartDataCell.h>
#include <DOM/Chart/IChartDataPoint.h>
#include <DOM/Chart/IChartDataPointCollection.h>
#include <DOM/Chart/IChartDataWorkbook.h>
#include <DOM/Chart/IChartSeries.h>
#include <DOM/Chart/IChartSeriesCollection.h>
#include <DOM/Chart/IDataLabel.h>
#include <DOM/Chart/IDataLabelCollection.h>
#include <DOM/Chart/IDataLabelFormat.h>
#include <DOM/Chart/IFormat.h>
#include <DOM/IChart.h>
#include <DOM/IColorFormat.h>
#include <DOM/IFillFormat.h>
#include <DOM/ILineFillFormat.h>
#include <DOM/ILineFormat.h>
#include <DOM/IShapeCollection.h>
#include <DOM/ISlide.h>
#include <DOM/Presentation.h>
#include <Export/SaveFormat.h>

using namespace System;
using namespace Aspose::Slides;
using namespace Aspose::Slides::Charts;
using namespace Aspose::Slides::Export;

auto presentation = MakeObject<Presentation>();
auto slide = presentation->get_Slide(0);

auto chart = slide->get_Shapes()->AddChart(ChartType::Sunburst, 20, 20, 500, 300);

chart->get_ChartData()->get_Categories()->Clear();
chart->get_ChartData()->get_Series()->Clear();

auto workbook = chart->get_ChartData()->get_ChartDataWorkbook();
workbook->Clear(0);

// Gren 1
auto categoryCell = workbook->GetCell(0, u"C1", ObjectExt::Box(String(u"Leaf1")));
auto leaf = chart->get_ChartData()->get_Categories()->Add(categoryCell);
leaf->get_GroupingLevels()->SetGroupingItem(1, ObjectExt::Box(String(u"Stem1")));
leaf->get_GroupingLevels()->SetGroupingItem(2, ObjectExt::Box(String(u"Branch1")));

categoryCell = workbook->GetCell(0, u"C2", ObjectExt::Box(String(u"Leaf2")));
chart->get_ChartData()->get_Categories()->Add(categoryCell);

categoryCell = workbook->GetCell(0, u"C3", ObjectExt::Box(String(u"Leaf3")));
leaf = chart->get_ChartData()->get_Categories()->Add(categoryCell);
leaf->get_GroupingLevels()->SetGroupingItem(1, ObjectExt::Box(String(u"Stem2")));

categoryCell = workbook->GetCell(0, u"C4", ObjectExt::Box(String(u"Leaf4")));
chart->get_ChartData()->get_Categories()->Add(categoryCell);

// Gren 2
categoryCell = workbook->GetCell(0, u"C5", ObjectExt::Box(String(u"Leaf5")));
leaf = chart->get_ChartData()->get_Categories()->Add(categoryCell);
leaf->get_GroupingLevels()->SetGroupingItem(1, ObjectExt::Box(String(u"Stem3")));
leaf->get_GroupingLevels()->SetGroupingItem(2, ObjectExt::Box(String(u"Branch2")));

categoryCell = workbook->GetCell(0, u"C6", ObjectExt::Box(String(u"Leaf6")));
chart->get_ChartData()->get_Categories()->Add(categoryCell);

categoryCell = workbook->GetCell(0, u"C7", ObjectExt::Box(String(u"Leaf7")));
leaf = chart->get_ChartData()->get_Categories()->Add(categoryCell);
leaf->get_GroupingLevels()->SetGroupingItem(1, ObjectExt::Box(String(u"Stem4")));

categoryCell = workbook->GetCell(0, u"C8", ObjectExt::Box(String(u"Leaf8")));
chart->get_ChartData()->get_Categories()->Add(categoryCell);

auto series = chart->get_ChartData()->get_Series()->Add(ChartType::Sunburst);
series->get_Labels()->get_DefaultDataLabelFormat()->set_ShowCategoryName(true);
auto valueCell = workbook->GetCell(0, u"D1", ObjectExt::Box(4));
series->get_DataPoints()->AddDataPointForSunburstSeries(valueCell);
valueCell = workbook->GetCell(0, u"D2", ObjectExt::Box(5));
series->get_DataPoints()->AddDataPointForSunburstSeries(valueCell);
valueCell = workbook->GetCell(0, u"D3", ObjectExt::Box(3));
series->get_DataPoints()->AddDataPointForSunburstSeries(valueCell);
valueCell = workbook->GetCell(0, u"D4", ObjectExt::Box(6));
series->get_DataPoints()->AddDataPointForSunburstSeries(valueCell);
valueCell = workbook->GetCell(0, u"D5", ObjectExt::Box(9));
series->get_DataPoints()->AddDataPointForSunburstSeries(valueCell);
valueCell = workbook->GetCell(0, u"D6", ObjectExt::Box(9));
series->get_DataPoints()->AddDataPointForSunburstSeries(valueCell);
valueCell = workbook->GetCell(0, u"D7", ObjectExt::Box(4));
series->get_DataPoints()->AddDataPointForSunburstSeries(valueCell);
valueCell = workbook->GetCell(0, u"D8", ObjectExt::Box(3));
series->get_DataPoints()->AddDataPointForSunburstSeries(valueCell);

presentation->Save(u"Sunburst.pptx", SaveFormat::Pptx);
Resultatet:
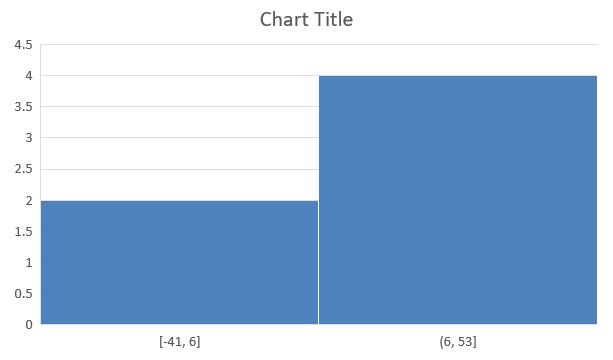
Skapa histogram‑diagram
Histogram‑diagram används för att representera fördelningen av numerisk data genom att gruppera värden i intervall eller fack. De är särskilt användbara för att identifiera datapattern som frekvens, skevhet och spridning, samt för att upptäcka avvikelser i en datamängd.
Detta exempel skapar ett histogram från sex numeriska värden, inklusive negativa värden. Genom att anropa set_AggregationType med det automatiska värdet låter diagrammet bestämma de fack som används för att visa fördelningen.
#include <system/shared_ptr.h>
#include <system/object_ext.h>
#include <system/string.h>
#include <DOM/Chart/AxisAggregationType.h>
#include <DOM/Chart/ChartType.h>
#include <DOM/Chart/IAxesManager.h>
#include <DOM/Chart/IAxis.h>
#include <DOM/Chart/IChartCategoryCollection.h>
#include <DOM/Chart/IChartData.h>
#include <DOM/Chart/IChartDataCell.h>
#include <DOM/Chart/IChartDataPoint.h>
#include <DOM/Chart/IChartDataPointCollection.h>
#include <DOM/Chart/IChartDataWorkbook.h>
#include <DOM/Chart/IChartSeries.h>
#include <DOM/Chart/IChartSeriesCollection.h>
#include <DOM/Chart/IFormat.h>
#include <DOM/IChart.h>
#include <DOM/IColorFormat.h>
#include <DOM/IFillFormat.h>
#include <DOM/ILineFillFormat.h>
#include <DOM/ILineFormat.h>
#include <DOM/IShapeCollection.h>
#include <DOM/ISlide.h>
#include <DOM/Presentation.h>
#include <Export/SaveFormat.h>

using namespace System;
using namespace Aspose::Slides;
using namespace Aspose::Slides::Charts;
using namespace Aspose::Slides::Export;

auto presentation = MakeObject<Presentation>();
auto slide = presentation->get_Slide(0);

auto chart = slide->get_Shapes()->AddChart(ChartType::Histogram, 20, 20, 500, 300);

chart->get_ChartData()->get_Categories()->Clear();
chart->get_ChartData()->get_Series()->Clear();

auto workbook = chart->get_ChartData()->get_ChartDataWorkbook();
workbook->Clear(0);

auto series = chart->get_ChartData()->get_Series()->Add(ChartType::Histogram);
auto valueCell = workbook->GetCell(0, u"A1", ObjectExt::Box(15));
series->get_DataPoints()->AddDataPointForHistogramSeries(valueCell);
valueCell = workbook->GetCell(0, u"A2", ObjectExt::Box(-41));
series->get_DataPoints()->AddDataPointForHistogramSeries(valueCell);
valueCell = workbook->GetCell(0, u"A3", ObjectExt::Box(16));
series->get_DataPoints()->AddDataPointForHistogramSeries(valueCell);
valueCell = workbook->GetCell(0, u"A4", ObjectExt::Box(10));
series->get_DataPoints()->AddDataPointForHistogramSeries(valueCell);
valueCell = workbook->GetCell(0, u"A5", ObjectExt::Box(-23));
series->get_DataPoints()->AddDataPointForHistogramSeries(valueCell);
valueCell = workbook->GetCell(0, u"A6", ObjectExt::Box(16));
series->get_DataPoints()->AddDataPointForHistogramSeries(valueCell);

chart->get_Axes()->get_HorizontalAxis()->set_AggregationType(AxisAggregationType::Automatic);

presentation->Save(u"Histogram.pptx", SaveFormat::Pptx);
Resultatet:
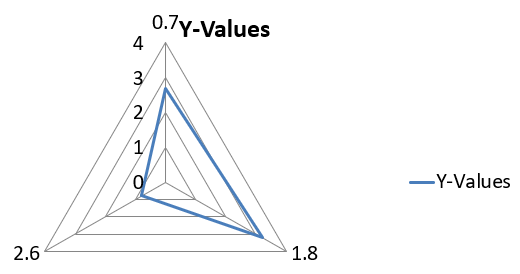
Skapa radardiagram
Radardiagram används för att visa multivariata data i ett tvådimensionellt format, vilket möjliggör enkel jämförelse av flera variabler samtidigt. De är särskilt användbara för att identifiera mönster, styrkor och svagheter över flera prestationsmått eller attribut.
Detta exempel använder AddChart för att skapa ett radardiagram med standardserier och -kategorier, och sparar sedan presentationen som PPTX.
#include <system/shared_ptr.h>
#include <DOM/Chart/ChartType.h>
#include <DOM/Chart/IChartCategoryCollection.h>
#include <DOM/Chart/IChartData.h>
#include <DOM/Chart/IChartSeriesCollection.h>
#include <DOM/Chart/IFormat.h>
#include <DOM/IChart.h>
#include <DOM/IColorFormat.h>
#include <DOM/IFillFormat.h>
#include <DOM/ILineFillFormat.h>
#include <DOM/ILineFormat.h>
#include <DOM/IShapeCollection.h>
#include <DOM/ISlide.h>
#include <DOM/Presentation.h>
#include <Export/SaveFormat.h>

using namespace System;
using namespace Aspose::Slides;
using namespace Aspose::Slides::Charts;
using namespace Aspose::Slides::Export;

auto presentation = MakeObject<Presentation>();
auto slide = presentation->get_Slide(0);

slide->get_Shapes()->AddChart(ChartType::Radar, 20, 20, 500, 300);

presentation->Save(u"Radar-chart.pptx", SaveFormat::Pptx);
Resultatet:
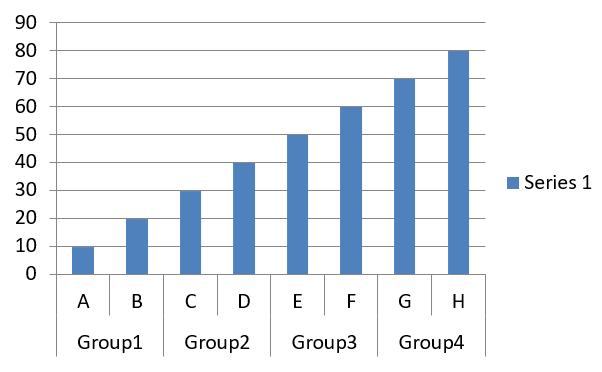
Skapa diagram med flera kategorier
Diagram med flera kategorier används för att visa data som innebär mer än en kategorisk gruppering, vilket låter dig jämföra värden över flera dimensioner simultant. De är särskilt hjälpsamma när du behöver analysera trender och relationer inom komplexa, flerskiktsdatamängder.
Detta exempel skapar ett gruppat kolumndiagram med åtta kategorier arrangerade i fyra par. Metoden SetGroupingItem ger varje par en gemensam etikett på gruppnivå 1, vilket ger en kategorialaxel med både individuella och gruppetiketter.
#include <system/shared_ptr.h>
#include <system/object_ext.h>
#include <system/string.h>
#include <DOM/Chart/ChartType.h>
#include <DOM/Chart/IChartCategory.h>
#include <DOM/Chart/IChartCategoryCollection.h>
#include <DOM/Chart/IChartCategoryLevelsManager.h>
#include <DOM/Chart/IChartData.h>
#include <DOM/Chart/IChartDataCell.h>
#include <DOM/Chart/IChartDataPoint.h>
#include <DOM/Chart/IChartDataPointCollection.h>
#include <DOM/Chart/IChartDataWorkbook.h>
#include <DOM/Chart/IChartSeries.h>
#include <DOM/Chart/IChartSeriesCollection.h>
#include <DOM/Chart/IFormat.h>
#include <DOM/IChart.h>
#include <DOM/IColorFormat.h>
#include <DOM/IFillFormat.h>
#include <DOM/ILineFillFormat.h>
#include <DOM/ILineFormat.h>
#include <DOM/IShapeCollection.h>
#include <DOM/ISlide.h>
#include <DOM/Presentation.h>
#include <Export/SaveFormat.h>

using namespace System;
using namespace Aspose::Slides;
using namespace Aspose::Slides::Charts;
using namespace Aspose::Slides::Export;

auto presentation = MakeObject<Presentation>();
auto slide = presentation->get_Slide(0);

auto chart = slide->get_Shapes()->AddChart(ChartType::ClusteredColumn, 20, 20, 500, 300);

chart->get_ChartData()->get_Series()->Clear();
chart->get_ChartData()->get_Categories()->Clear();

auto workbook = chart->get_ChartData()->get_ChartDataWorkbook();
workbook->Clear(0);

auto worksheetIndex = 0;

auto categoryCell = workbook->GetCell(0, u"c2", ObjectExt::Box(String(u"A")));
auto category = chart->get_ChartData()->get_Categories()->Add(categoryCell);
category->get_GroupingLevels()->SetGroupingItem(1, ObjectExt::Box(String(u"Group1")));
categoryCell = workbook->GetCell(0, u"c3", ObjectExt::Box(String(u"B")));
category = chart->get_ChartData()->get_Categories()->Add(categoryCell);

categoryCell = workbook->GetCell(0, u"c4", ObjectExt::Box(String(u"C")));
category = chart->get_ChartData()->get_Categories()->Add(categoryCell);
category->get_GroupingLevels()->SetGroupingItem(1, ObjectExt::Box(String(u"Group2")));
categoryCell = workbook->GetCell(0, u"c5", ObjectExt::Box(String(u"D")));
category = chart->get_ChartData()->get_Categories()->Add(categoryCell);

categoryCell = workbook->GetCell(0, u"c6", ObjectExt::Box(String(u"E")));
category = chart->get_ChartData()->get_Categories()->Add(categoryCell);
category->get_GroupingLevels()->SetGroupingItem(1, ObjectExt::Box(String(u"Group3")));
categoryCell = workbook->GetCell(0, u"c7", ObjectExt::Box(String(u"F")));
category = chart->get_ChartData()->get_Categories()->Add(categoryCell);

categoryCell = workbook->GetCell(0, u"c8", ObjectExt::Box(String(u"G")));
category = chart->get_ChartData()->get_Categories()->Add(categoryCell);
category->get_GroupingLevels()->SetGroupingItem(1, ObjectExt::Box(String(u"Group4")));
categoryCell = workbook->GetCell(0, u"c9", ObjectExt::Box(String(u"H")));
category = chart->get_ChartData()->get_Categories()->Add(categoryCell);

auto seriesNameCell = workbook->GetCell(0, u"D1", ObjectExt::Box(String(u"Series 1")));
auto series = chart->get_ChartData()->get_Series()->Add(seriesNameCell, ChartType::ClusteredColumn);

auto valueCell = workbook->GetCell(worksheetIndex, u"D2", ObjectExt::Box(10));
series->get_DataPoints()->AddDataPointForBarSeries(valueCell);
valueCell = workbook->GetCell(worksheetIndex, u"D3", ObjectExt::Box(20));
series->get_DataPoints()->AddDataPointForBarSeries(valueCell);
valueCell = workbook->GetCell(worksheetIndex, u"D4", ObjectExt::Box(30));
series->get_DataPoints()->AddDataPointForBarSeries(valueCell);
valueCell = workbook->GetCell(worksheetIndex, u"D5", ObjectExt::Box(40));
series->get_DataPoints()->AddDataPointForBarSeries(valueCell);
valueCell = workbook->GetCell(worksheetIndex, u"D6", ObjectExt::Box(50));
series->get_DataPoints()->AddDataPointForBarSeries(valueCell);
valueCell = workbook->GetCell(worksheetIndex, u"D7", ObjectExt::Box(60));
series->get_DataPoints()->AddDataPointForBarSeries(valueCell);
valueCell = workbook->GetCell(worksheetIndex, u"D8", ObjectExt::Box(70));
series->get_DataPoints()->AddDataPointForBarSeries(valueCell);
valueCell = workbook->GetCell(worksheetIndex, u"D9", ObjectExt::Box(80));
series->get_DataPoints()->AddDataPointForBarSeries(valueCell);

presentation->Save(u"AsposeChart.pptx", SaveFormat::Pptx);
Resultatet:
Skapa kartdiagram
Kartdiagram används för att visualisera geografisk data genom att kartlägga information till specifika platser såsom länder, delstater eller städer. De är särskilt användbara för att analysera regionala trender, demografisk data och rumsliga fördelningar på ett tydligt, visuellt tilltalande sätt.
Detta exempel använder AddChart för att skapa ett kartdiagram med standard geografisk data och sparar det för visning i PowerPoint.
#include <system/shared_ptr.h>
#include <DOM/Chart/ChartType.h>
#include <DOM/Chart/IChartCategoryCollection.h>
#include <DOM/Chart/IChartData.h>
#include <DOM/Chart/IChartSeriesCollection.h>
#include <DOM/Chart/IFormat.h>
#include <DOM/IChart.h>
#include <DOM/IColorFormat.h>
#include <DOM/IFillFormat.h>
#include <DOM/ILineFillFormat.h>
#include <DOM/ILineFormat.h>
#include <DOM/IShapeCollection.h>
#include <DOM/ISlide.h>
#include <DOM/Presentation.h>
#include <Export/SaveFormat.h>

using namespace System;
using namespace Aspose::Slides;
using namespace Aspose::Slides::Charts;
using namespace Aspose::Slides::Export;

auto presentation = MakeObject<Presentation>();
auto slide = presentation->get_Slide(0);

auto chart = slide->get_Shapes()->AddChart(ChartType::Map, 20, 20, 500, 300);

presentation->Save(u"mapChart.pptx", SaveFormat::Pptx);
Resultatet:
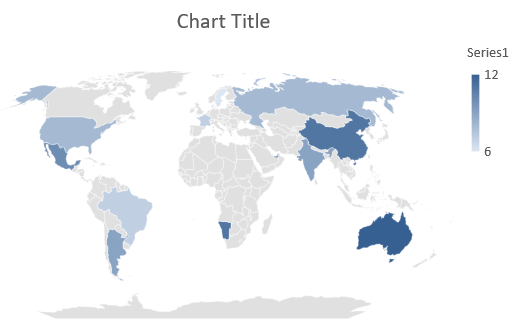
Note
Bilden ovan visar den sparade presentationen öppen i PowerPoint. Aspose.Slides skriver kartdiagrammet och dess data korrekt, men den ritar inte kartdiagram själv: när en bild som innehåller ett sådant renderas till en bild eller konverteras till PDF eller SVG blir diagramområdet tomt. Andra former på samma bild påverkas inte.Skapa kombinationsdiagram
Ett kombinationsdiagram (eller combo‑diagram) kombinerar två eller fler diagramtyper i ett enda diagram. Detta diagram låter dig framhäva, jämföra eller granska skillnader mellan två eller flera datasätt, vilket hjälper dig att identifiera relationer mellan dem.
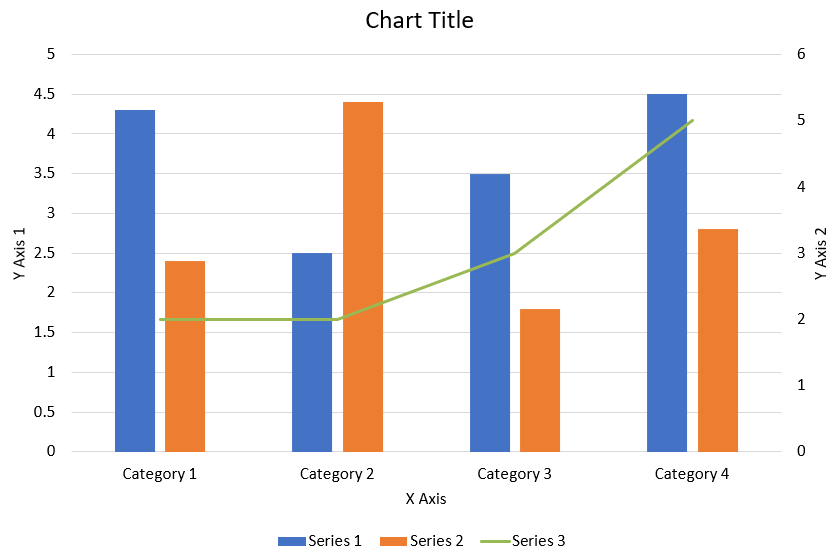
Detta exempel kombinerar två grupperade kolumnserier med en linjeserie över fyra kategorier. Kolumnerna använder den primära vertikala axeln, medan set_PlotOnSecondAxis placerar linjen på en sekundär vertikal axel till höger. Hjälpfunktionerna konfigurerar titel, förklaring, axelrubriker och rutnätslinjer.
#include <DOM/Chart/IChartLinesFormat.h>
#include <DOM/Chart/IChartPortionFormat.h>
#include <DOM/Chart/IAxisFormat.h>
#include <system/shared_ptr.h>
#include <system/object_ext.h>
#include <system/string.h>
#include <drawing/color.h>
#include <DOM/Chart/AxisPositionType.h>
#include <DOM/Chart/ChartType.h>
#include <DOM/Chart/CrossesType.h>
#include <DOM/Chart/IAxesManager.h>
#include <DOM/Chart/IAxis.h>
#include <DOM/Chart/IChartCategoryCollection.h>
#include <DOM/Chart/IChartData.h>
#include <DOM/Chart/IChartDataCell.h>
#include <DOM/Chart/IChartDataPoint.h>
#include <DOM/Chart/IChartDataPointCollection.h>
#include <DOM/Chart/IChartDataWorkbook.h>
#include <DOM/Chart/IChartSeries.h>
#include <DOM/Chart/IChartSeriesCollection.h>
#include <DOM/Chart/IChartSeriesGroup.h>
#include <DOM/Chart/IChartSeriesGroupCollection.h>
#include <DOM/Chart/IChartTextFormat.h>
#include <DOM/Chart/IChartTitle.h>
#include <DOM/Chart/IFormat.h>
#include <DOM/Chart/ILegend.h>
#include <DOM/Chart/LegendPositionType.h>
#include <DOM/FillType.h>
#include <DOM/IChart.h>
#include <DOM/IColorFormat.h>
#include <DOM/IFillFormat.h>
#include <DOM/ILineFillFormat.h>
#include <DOM/ILineFormat.h>
#include <DOM/IParagraph.h>
#include <DOM/IParagraphCollection.h>
#include <DOM/IParagraphFormat.h>
#include <DOM/IPortionFormat.h>
#include <DOM/IShapeCollection.h>
#include <DOM/ISlide.h>
#include <DOM/ITextFrame.h>
#include <DOM/ITextFrameFormat.h>
#include <DOM/NullableBool.h>
#include <DOM/Presentation.h>
#include <Export/SaveFormat.h>

using namespace System;
using namespace System::Drawing;
using namespace Aspose::Slides;
using namespace Aspose::Slides::Charts;
using namespace Aspose::Slides::Export;

struct ComboChartExample
{
    static void CreateComboChart()
    {
        auto presentation = MakeObject<Presentation>();
        auto chart = CreateChartWithFirstSeries(presentation->get_Slide(0));

        AddSecondSeriesToChart(chart);
        AddThirdSeriesToChart(chart);

        SetPrimaryAxesFormat(chart);
        SetSecondaryAxesFormat(chart);

        presentation->Save(u"combo-chart.pptx", SaveFormat::Pptx);
    }

    static SharedPtr<IChart> CreateChartWithFirstSeries(SharedPtr<ISlide> slide)
    {
        auto chart = slide->get_Shapes()->AddChart(ChartType::ClusteredColumn, 50, 50, 600, 400);

        chart->set_HasTitle(true);
        chart->get_ChartTitle()->AddTextFrameForOverriding(u"Chart Title");
        chart->get_ChartTitle()->set_Overlay(false);
        auto portionFormat = chart->get_ChartTitle()->get_TextFrameForOverriding()->get_Paragraphs()->idx_get(0)->get_ParagraphFormat()->get_DefaultPortionFormat();
        portionFormat->set_FontBold(NullableBool::False);
        portionFormat->set_FontHeight(18.0f);

        chart->get_Legend()->set_Position(LegendPositionType::Bottom);
        chart->get_Legend()->get_TextFormat()->get_PortionFormat()->set_FontHeight(12.0f);

        chart->get_ChartData()->get_Series()->Clear();
        chart->get_ChartData()->get_Categories()->Clear();

        auto workbook = chart->get_ChartData()->get_ChartDataWorkbook();
        auto worksheetIndex = 0;

        auto categoryCell = workbook->GetCell(worksheetIndex, 1, 0, ObjectExt::Box(String(u"Category 1")));
        chart->get_ChartData()->get_Categories()->Add(categoryCell);
        categoryCell = workbook->GetCell(worksheetIndex, 2, 0, ObjectExt::Box(String(u"Category 2")));
        chart->get_ChartData()->get_Categories()->Add(categoryCell);
        categoryCell = workbook->GetCell(worksheetIndex, 3, 0, ObjectExt::Box(String(u"Category 3")));
        chart->get_ChartData()->get_Categories()->Add(categoryCell);
        categoryCell = workbook->GetCell(worksheetIndex, 4, 0, ObjectExt::Box(String(u"Category 4")));
        chart->get_ChartData()->get_Categories()->Add(categoryCell);

        auto seriesNameCell = workbook->GetCell(worksheetIndex, 0, 1, ObjectExt::Box(String(u"Series 1")));
        auto series = chart->get_ChartData()->get_Series()->Add(seriesNameCell, chart->get_Type());

        series->get_ParentSeriesGroup()->set_Overlap(-25);
        series->get_ParentSeriesGroup()->set_GapWidth(220);

        auto valueCell = workbook->GetCell(worksheetIndex, 1, 1, ObjectExt::Box(4.3));
        series->get_DataPoints()->AddDataPointForBarSeries(valueCell);
        valueCell = workbook->GetCell(worksheetIndex, 2, 1, ObjectExt::Box(2.5));
        series->get_DataPoints()->AddDataPointForBarSeries(valueCell);
        valueCell = workbook->GetCell(worksheetIndex, 3, 1, ObjectExt::Box(3.5));
        series->get_DataPoints()->AddDataPointForBarSeries(valueCell);
        valueCell = workbook->GetCell(worksheetIndex, 4, 1, ObjectExt::Box(4.5));
        series->get_DataPoints()->AddDataPointForBarSeries(valueCell);

        return chart;
    }

    static void AddSecondSeriesToChart(SharedPtr<IChart> chart)
    {
        auto workbook = chart->get_ChartData()->get_ChartDataWorkbook();
        const int worksheetIndex = 0;

        auto seriesNameCell = workbook->GetCell(worksheetIndex, 0, 2, ObjectExt::Box(String(u"Series 2")));
        auto series = chart->get_ChartData()->get_Series()->Add(seriesNameCell, ChartType::ClusteredColumn);

        series->get_ParentSeriesGroup()->set_Overlap(-25);
        series->get_ParentSeriesGroup()->set_GapWidth(220);

        auto valueCell = workbook->GetCell(worksheetIndex, 1, 2, ObjectExt::Box(2.4));
        series->get_DataPoints()->AddDataPointForBarSeries(valueCell);
        valueCell = workbook->GetCell(worksheetIndex, 2, 2, ObjectExt::Box(4.4));
        series->get_DataPoints()->AddDataPointForBarSeries(valueCell);
        valueCell = workbook->GetCell(worksheetIndex, 3, 2, ObjectExt::Box(1.8));
        series->get_DataPoints()->AddDataPointForBarSeries(valueCell);
        valueCell = workbook->GetCell(worksheetIndex, 4, 2, ObjectExt::Box(2.8));
        series->get_DataPoints()->AddDataPointForBarSeries(valueCell);
    }

    static void AddThirdSeriesToChart(SharedPtr<IChart> chart)
    {
        auto workbook = chart->get_ChartData()->get_ChartDataWorkbook();
        const int worksheetIndex = 0;

        auto seriesNameCell = workbook->GetCell(worksheetIndex, 0, 3, ObjectExt::Box(String(u"Series 3")));
        auto series = chart->get_ChartData()->get_Series()->Add(seriesNameCell, ChartType::Line);

        auto valueCell = workbook->GetCell(worksheetIndex, 1, 3, ObjectExt::Box(2.0));
        series->get_DataPoints()->AddDataPointForLineSeries(valueCell);
        valueCell = workbook->GetCell(worksheetIndex, 2, 3, ObjectExt::Box(2.0));
        series->get_DataPoints()->AddDataPointForLineSeries(valueCell);
        valueCell = workbook->GetCell(worksheetIndex, 3, 3, ObjectExt::Box(3.0));
        series->get_DataPoints()->AddDataPointForLineSeries(valueCell);
        valueCell = workbook->GetCell(worksheetIndex, 4, 3, ObjectExt::Box(5.0));
        series->get_DataPoints()->AddDataPointForLineSeries(valueCell);

        series->set_PlotOnSecondAxis(true);
    }

    static void SetPrimaryAxesFormat(SharedPtr<IChart> chart)
    {
        auto horizontalAxis = chart->get_Axes()->get_HorizontalAxis();
        horizontalAxis->get_TextFormat()->get_PortionFormat()->set_FontHeight(12.0f);
        horizontalAxis->get_Format()->get_Line()->get_FillFormat()->set_FillType(FillType::NoFill);

        SetAxisTitle(horizontalAxis, u"X Axis");

        auto verticalAxis = chart->get_Axes()->get_VerticalAxis();
        verticalAxis->get_TextFormat()->get_PortionFormat()->set_FontHeight(12.0f);
        verticalAxis->get_Format()->get_Line()->get_FillFormat()->set_FillType(FillType::NoFill);

        SetAxisTitle(verticalAxis, u"Y Axis 1");

        auto majorGridLinesFormat = verticalAxis->get_MajorGridLinesFormat()->get_Line()->get_FillFormat();
        majorGridLinesFormat->set_FillType(FillType::Solid);
        majorGridLinesFormat->get_SolidFillColor()->set_Color(Color::FromArgb(217, 217, 217));
    }

    static void SetSecondaryAxesFormat(SharedPtr<IChart> chart)
    {
        auto secondaryHorizontalAxis = chart->get_Axes()->get_SecondaryHorizontalAxis();
        secondaryHorizontalAxis->set_Position(AxisPositionType::Bottom);
        secondaryHorizontalAxis->set_CrossType(CrossesType::Maximum);
        secondaryHorizontalAxis->set_IsVisible(false);
        secondaryHorizontalAxis->get_MajorGridLinesFormat()->get_Line()->get_FillFormat()->set_FillType(FillType::NoFill);
        secondaryHorizontalAxis->get_MinorGridLinesFormat()->get_Line()->get_FillFormat()->set_FillType(FillType::NoFill);

        auto secondaryVerticalAxis = chart->get_Axes()->get_SecondaryVerticalAxis();
        secondaryVerticalAxis->set_Position(AxisPositionType::Right);
        secondaryVerticalAxis->get_TextFormat()->get_PortionFormat()->set_FontHeight(12.0f);
        secondaryVerticalAxis->get_Format()->get_Line()->get_FillFormat()->set_FillType(FillType::NoFill);
        secondaryVerticalAxis->get_MajorGridLinesFormat()->get_Line()->get_FillFormat()->set_FillType(FillType::NoFill);
        secondaryVerticalAxis->get_MinorGridLinesFormat()->get_Line()->get_FillFormat()->set_FillType(FillType::NoFill);

        SetAxisTitle(secondaryVerticalAxis, u"Y Axis 2");
    }

    static void SetAxisTitle(SharedPtr<IAxis> axis, String axisTitle)
    {
        axis->set_HasTitle(true);
        axis->get_Title()->set_Overlay(false);
        auto titlePortionFormat = axis->get_Title()->AddTextFrameForOverriding(axisTitle)->get_Paragraphs()->idx_get(0)->get_ParagraphFormat()->get_DefaultPortionFormat();
        titlePortionFormat->set_FontBold(NullableBool::False);
        titlePortionFormat->set_FontHeight(12.0f);
    }
};

ComboChartExample::CreateComboChart();
Uppdatera diagram
Aspose.Slides för C++ möjliggör att uppdatera PowerPoint‑diagram genom att ändra diagramdata, formatering och stil. Denna funktion förenklar processen att hålla presentationer aktuella med dynamiskt innehåll och säkerställer att diagrammen korrekt återger aktuella data och visuella standarder.
Detta exempel uppdaterar diagrammet med namnet “My chart” på den första bilden i en befintlig presentation. Det kräver två kolumnserier med tre datapunkter vardera, med kategorietiketter i kolumn A och serienamn i den första raden i det första arbetsbladet. Exemplet använder GetCell för att ändra arbetsboks‑celler, uppdaterar serievärden, lägger till en tredje serie och ändrar diagrammet till grupperade cylindrar via set_Type.
#include <system/shared_ptr.h>
#include <system/object_ext.h>
#include <system/string.h>
#include <DOM/Chart/ChartType.h>
#include <DOM/Chart/IChartCategoryCollection.h>
#include <DOM/Chart/IChartData.h>
#include <DOM/Chart/IChartDataCell.h>
#include <DOM/Chart/IChartDataPoint.h>
#include <DOM/Chart/IChartDataPointCollection.h>
#include <DOM/Chart/IChartDataWorkbook.h>
#include <DOM/Chart/IChartSeries.h>
#include <DOM/Chart/IChartSeriesCollection.h>
#include <DOM/Chart/IDoubleChartValue.h>
#include <DOM/Chart/IFormat.h>
#include <DOM/IChart.h>
#include <DOM/IColorFormat.h>
#include <DOM/IFillFormat.h>
#include <DOM/ILineFillFormat.h>
#include <DOM/ILineFormat.h>
#include <DOM/IShape.h>
#include <DOM/IShapeCollection.h>
#include <DOM/ISlide.h>
#include <DOM/Presentation.h>
#include <Export/SaveFormat.h>

using namespace System;
using namespace Aspose::Slides;
using namespace Aspose::Slides::Charts;
using namespace Aspose::Slides::Export;

const String chartName = u"My chart";

auto presentation = MakeObject<Presentation>(u"ExistingChart.pptx");
auto slide = presentation->get_Slide(0);

for (auto shape : slide->get_Shapes())
{
    auto chart = System::DynamicCast<IChart>(shape);
    if (chart != nullptr && chart->get_Name() == chartName)
    {
        auto worksheetIndex = 0;

        auto workbook = chart->get_ChartData()->get_ChartDataWorkbook();

        workbook->GetCell(worksheetIndex, 1, 0, ObjectExt::Box(String(u"Modified Category 1")));
        workbook->GetCell(worksheetIndex, 2, 0, ObjectExt::Box(String(u"Modified Category 2")));

        auto series = chart->get_ChartData()->get_Series()->idx_get(0);

        workbook->GetCell(worksheetIndex, 0, 1, ObjectExt::Box(String(u"New_Series 1")));
        series->get_DataPoints()->idx_get(0)->get_Value()->set_Data(ObjectExt::Box(90));
        series->get_DataPoints()->idx_get(1)->get_Value()->set_Data(ObjectExt::Box(123));
        series->get_DataPoints()->idx_get(2)->get_Value()->set_Data(ObjectExt::Box(44));

        series = chart->get_ChartData()->get_Series()->idx_get(1);

        workbook->GetCell(worksheetIndex, 0, 2, ObjectExt::Box(String(u"New_Series 2")));
        series->get_DataPoints()->idx_get(0)->get_Value()->set_Data(ObjectExt::Box(23));
        series->get_DataPoints()->idx_get(1)->get_Value()->set_Data(ObjectExt::Box(67));
        series->get_DataPoints()->idx_get(2)->get_Value()->set_Data(ObjectExt::Box(99));

        auto seriesNameCell = workbook->GetCell(worksheetIndex, 0, 3, ObjectExt::Box(String(u"Series 3")));
        series = chart->get_ChartData()->get_Series()->Add(seriesNameCell, chart->get_Type());

        auto valueCell = workbook->GetCell(worksheetIndex, 1, 3, ObjectExt::Box(20));
        series->get_DataPoints()->AddDataPointForBarSeries(valueCell);
        valueCell = workbook->GetCell(worksheetIndex, 2, 3, ObjectExt::Box(50));
        series->get_DataPoints()->AddDataPointForBarSeries(valueCell);
        valueCell = workbook->GetCell(worksheetIndex, 3, 3, ObjectExt::Box(30));
        series->get_DataPoints()->AddDataPointForBarSeries(valueCell);

        chart->set_Type(ChartType::ClusteredCylinder);
    }
}

presentation->Save(u"AsposeChartModified.pptx", SaveFormat::Pptx);
Ange dataintervall för ett diagram
För att inspektera intervallet som redan används av ett befintligt diagram, se Hämta ett diagrams dataintervall.
Aspose.Slides för C++ ger flexibiliteten att definiera ett specifikt dataintervall från ett arbetsblad som källa för ditt diagrams data. Detta innebär att du kan direkt mappa en del av ditt arbetsblad till diagrammet, vilket låter dig styra vilka celler som bidrar till diagrammets serier och kategorier. Som resultat kan du enkelt uppdatera och synkronisera dina diagram med de senaste dataväxlingarna i ditt arbetsblad, så att dina PowerPoint‑presentationer återspeglar aktuell och korrekt information.
Detta exempel använder SetRange för att sätta datakällan för diagrammet med namnet “My chart” på den första bilden i en befintlig presentation till Sheet1!A1:B4. Diagramarboken måste innehålla det arbetsbladet och ett ifyllt intervall med en serierubrik i den första raden, kategorietiketter i kolumn A och tre värden i kolumn B.
#include <system/shared_ptr.h>
#include <DOM/Chart/ChartType.h>
#include <DOM/Chart/IChartCategoryCollection.h>
#include <DOM/Chart/IChartData.h>
#include <DOM/Chart/IChartSeriesCollection.h>
#include <DOM/Chart/IFormat.h>
#include <DOM/IChart.h>
#include <DOM/IColorFormat.h>
#include <DOM/IFillFormat.h>
#include <DOM/ILineFillFormat.h>
#include <DOM/ILineFormat.h>
#include <DOM/IShape.h>
#include <DOM/IShapeCollection.h>
#include <DOM/ISlide.h>
#include <DOM/Presentation.h>
#include <Export/SaveFormat.h>

using namespace System;
using namespace Aspose::Slides;
using namespace Aspose::Slides::Charts;
using namespace Aspose::Slides::Export;

const String chartName = u"My chart";

auto presentation = MakeObject<Presentation>(u"ExistingChart.pptx");
auto slide = presentation->get_Slide(0);

for (auto shape : slide->get_Shapes())
{
    auto chart = System::DynamicCast<IChart>(shape);
    if (chart != nullptr && chart->get_Name() == chartName)
    {
        chart->get_ChartData()->SetRange(u"Sheet1!A1:B4");
    }
}

presentation->Save(u"SetDataRange.pptx", SaveFormat::Pptx);
Använd standardmarkörer i diagram
När du använder standardmarkörer i diagram får varje diagramserie automatiskt en annan standardmarkörsymbol.
Detta exempel använder AddChart för att skapa ett diagram med två linjeserier och en förklaring. Inställningarna get_Marker behåller de automatiskt tilldelade markörsymbolerna. Den första serien innehåller ett negativt värde och ett saknat värde, representerat av nullptr, medan den andra har ett värde för varje kategori.
#include <system/shared_ptr.h>
#include <system/object_ext.h>
#include <system/string.h>
#include <DOM/Chart/ChartType.h>
#include <DOM/Chart/IChartCategoryCollection.h>
#include <DOM/Chart/IChartData.h>
#include <DOM/Chart/IChartDataCell.h>
#include <DOM/Chart/IChartDataPoint.h>
#include <DOM/Chart/IChartDataPointCollection.h>
#include <DOM/Chart/IChartDataWorkbook.h>
#include <DOM/Chart/IChartSeries.h>
#include <DOM/Chart/IChartSeriesCollection.h>
#include <DOM/Chart/IChartTextFormat.h>
#include <DOM/Chart/IFormat.h>
#include <DOM/Chart/ILegend.h>
#include <DOM/Chart/IMarker.h>
#include <DOM/IChart.h>
#include <DOM/IColorFormat.h>
#include <DOM/IFillFormat.h>
#include <DOM/ILineFillFormat.h>
#include <DOM/ILineFormat.h>
#include <DOM/IPortionFormat.h>
#include <DOM/IShapeCollection.h>
#include <DOM/ISlide.h>
#include <DOM/Presentation.h>
#include <Export/SaveFormat.h>

using namespace System;
using namespace Aspose::Slides;
using namespace Aspose::Slides::Charts;
using namespace Aspose::Slides::Export;

auto presentation = MakeObject<Presentation>();
auto slide = presentation->get_Slide(0);

auto chart = slide->get_Shapes()->AddChart(ChartType::LineWithMarkers, 10, 10, 400, 400);

chart->get_ChartData()->get_Series()->Clear();
chart->get_ChartData()->get_Categories()->Clear();

auto workbook = chart->get_ChartData()->get_ChartDataWorkbook();

auto seriesNameCell = workbook->GetCell(0, 0, 1, ObjectExt::Box(String(u"Series 1")));
auto series = chart->get_ChartData()->get_Series()->Add(seriesNameCell, chart->get_Type());

auto categoryCell = workbook->GetCell(0, 1, 0, ObjectExt::Box(String(u"C1")));
chart->get_ChartData()->get_Categories()->Add(categoryCell);
auto valueCell = workbook->GetCell(0, 1, 1, ObjectExt::Box(24));
series->get_DataPoints()->AddDataPointForLineSeries(valueCell);

categoryCell = workbook->GetCell(0, 2, 0, ObjectExt::Box(String(u"C2")));
chart->get_ChartData()->get_Categories()->Add(categoryCell);
valueCell = workbook->GetCell(0, 2, 1, ObjectExt::Box(23));
series->get_DataPoints()->AddDataPointForLineSeries(valueCell);

categoryCell = workbook->GetCell(0, 3, 0, ObjectExt::Box(String(u"C3")));
chart->get_ChartData()->get_Categories()->Add(categoryCell);
valueCell = workbook->GetCell(0, 3, 1, ObjectExt::Box(-10));
series->get_DataPoints()->AddDataPointForLineSeries(valueCell);

categoryCell = workbook->GetCell(0, 4, 0, ObjectExt::Box(String(u"C4")));
chart->get_ChartData()->get_Categories()->Add(categoryCell);
valueCell = workbook->GetCell(0, 4, 1, nullptr);
series->get_DataPoints()->AddDataPointForLineSeries(valueCell);

seriesNameCell = workbook->GetCell(0, 0, 2, ObjectExt::Box(String(u"Series 2")));
auto secondSeries = chart->get_ChartData()->get_Series()->Add(seriesNameCell, chart->get_Type());

valueCell = workbook->GetCell(0, 1, 2, ObjectExt::Box(30));
secondSeries->get_DataPoints()->AddDataPointForLineSeries(valueCell);
valueCell = workbook->GetCell(0, 2, 2, ObjectExt::Box(10));
secondSeries->get_DataPoints()->AddDataPointForLineSeries(valueCell);
valueCell = workbook->GetCell(0, 3, 2, ObjectExt::Box(60));
secondSeries->get_DataPoints()->AddDataPointForLineSeries(valueCell);
valueCell = workbook->GetCell(0, 4, 2, ObjectExt::Box(40));
secondSeries->get_DataPoints()->AddDataPointForLineSeries(valueCell);

chart->set_HasLegend(true);
chart->get_Legend()->set_Overlay(false);

presentation->Save(u"DefaultMarkersInChart.pptx", SaveFormat::Pptx);
Vanliga frågor
Vilka diagramtyper stöds av Aspose.Slides för C++?
Aspose.Slides för C++ stödjer ett brett sortiment av diagramtyper, inklusive stapel, linje, cirkel, area, spridning, histogram, radar och många fler. Denna flexibilitet låter dig välja den mest lämpliga diagramtypen för dina behov av datavisualisering.
Hur lägger jag till ett nytt diagram på en bild?
För att lägga till ett diagram skapar du först en instans av klassen Presentation, hämtar den önskade bilden med dess index och anropar sedan metoden för att lägga till ett diagram, där du specificerar diagramtypen och initiala data. Detta process integrerar diagrammet direkt i din presentation.
Hur kan jag uppdatera data som visas i ett diagram?
Du kan uppdatera ett diagramdata genom att komma åt dess datarbok IChartDataWorkbook, rensa eventuella standardserier och -kategorier, och sedan lägga till din anpassade data. Detta låter dig programatiskt uppdatera diagrammet så att det speglar den senaste datan.
Är det möjligt att anpassa diagrammets utseende?
Ja, Aspose.Slides för C++ erbjuder omfattande anpassningsalternativ. Du kan ändra färger, typsnitt, etiketter, förklaringar och andra formateringselement för att skräddarsy diagrammets utseende efter dina specifika designkrav.