
在 C++ 中创建或更新 PowerPoint 演示文稿图表
概述
本文提供了使用 Aspose.Slides for C++ 创建和自定义图表的完整指南。您将学习如何以编程方式向幻灯片添加图表、填充数据,并应用各种格式设置以满足特定的设计需求。文章中提供了详细的代码示例,演示了从初始化演示文稿和图表对象到配置系列、坐标轴和图例的每一步。通过本指南,您将掌握在 C++ 应用程序中集成动态图表的技巧,从而简化数据驱动演示文稿的创建过程。
创建图表
图表帮助人们快速可视化数据,并发现表格或电子表格中不易察觉的洞察。
为什么要创建图表?
使用图表,您可以:
- 在单张幻灯片上聚合、压缩或汇总大量数据;
- 展示数据中的模式和趋势;
- 推断数据随时间或相对于特定计量单位的方向和动量;
- 发现异常值、偏差、错误和无意义的数据;
- 传达或展示复杂数据。
在 PowerPoint 中,您可以通过 Insert 功能创建图表,该功能提供了多种图表模板。使用 Aspose.Slides,您既可以创建常规图表(基于常用图表类型),也可以创建自定义图表。
创建簇状柱形图
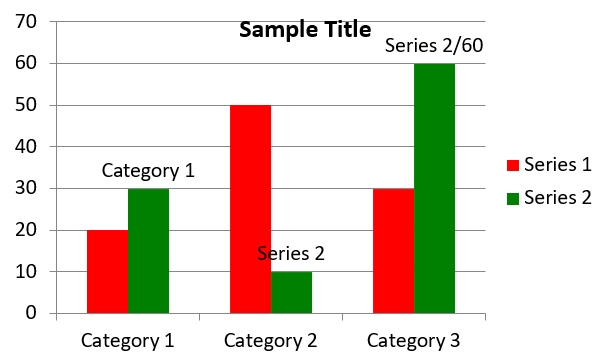
此示例使用 AddChart 创建一个簇状柱形图,该图对比了两个系列在三个类别上的数据。系列使用红色和绿色填充,单独的标签展示了类别名称、系列名称和数值。工作表索引 0 指嵌入式图表工作簿中的第一张工作表。
#include <system/shared_ptr.h>
#include <system/object_ext.h>
#include <system/string.h>
#include <drawing/color.h>
#include <DOM/Chart/ChartType.h>
#include <DOM/Chart/IChartCategoryCollection.h>
#include <DOM/Chart/IChartData.h>
#include <DOM/Chart/IChartDataCell.h>
#include <DOM/Chart/IChartDataPoint.h>
#include <DOM/Chart/IChartDataPointCollection.h>
#include <DOM/Chart/IChartDataWorkbook.h>
#include <DOM/Chart/IChartSeries.h>
#include <DOM/Chart/IChartSeriesCollection.h>
#include <DOM/Chart/IChartTitle.h>
#include <DOM/Chart/IDataLabel.h>
#include <DOM/Chart/IDataLabelCollection.h>
#include <DOM/Chart/IDataLabelFormat.h>
#include <DOM/Chart/IDoubleChartValue.h>
#include <DOM/Chart/IFormat.h>
#include <DOM/FillType.h>
#include <DOM/IChart.h>
#include <DOM/IColorFormat.h>
#include <DOM/IFillFormat.h>
#include <DOM/ILineFillFormat.h>
#include <DOM/ILineFormat.h>
#include <DOM/IShapeCollection.h>
#include <DOM/ISlide.h>
#include <DOM/ITextFrame.h>
#include <DOM/ITextFrameFormat.h>
#include <DOM/NullableBool.h>
#include <DOM/Presentation.h>
#include <Export/SaveFormat.h>

using namespace System;
using namespace System::Drawing;
using namespace Aspose::Slides;
using namespace Aspose::Slides::Charts;
using namespace Aspose::Slides::Export;

auto presentation = MakeObject<Presentation>();
auto slide = presentation->get_Slide(0);

auto chart = slide->get_Shapes()->AddChart(ChartType::ClusteredColumn, 20, 20, 500, 300);

chart->get_ChartTitle()->AddTextFrameForOverriding(u"Sample Title");
chart->get_ChartTitle()->get_TextFrameForOverriding()->get_TextFrameFormat()->set_CenterText(NullableBool::True);
chart->get_ChartTitle()->set_Height(20);
chart->set_HasTitle(true);

auto workbook = chart->get_ChartData()->get_ChartDataWorkbook();
auto worksheetIndex = 0;

chart->get_ChartData()->get_Series()->Clear();
chart->get_ChartData()->get_Categories()->Clear();

auto seriesNameCell = workbook->GetCell(worksheetIndex, 0, 1, ObjectExt::Box(String(u"Series 1")));
chart->get_ChartData()->get_Series()->Add(seriesNameCell, chart->get_Type());
seriesNameCell = workbook->GetCell(worksheetIndex, 0, 2, ObjectExt::Box(String(u"Series 2")));
chart->get_ChartData()->get_Series()->Add(seriesNameCell, chart->get_Type());

auto categoryCell = workbook->GetCell(worksheetIndex, 1, 0, ObjectExt::Box(String(u"Category 1")));
chart->get_ChartData()->get_Categories()->Add(categoryCell);
categoryCell = workbook->GetCell(worksheetIndex, 2, 0, ObjectExt::Box(String(u"Category 2")));
chart->get_ChartData()->get_Categories()->Add(categoryCell);
categoryCell = workbook->GetCell(worksheetIndex, 3, 0, ObjectExt::Box(String(u"Category 3")));
chart->get_ChartData()->get_Categories()->Add(categoryCell);

auto series = chart->get_ChartData()->get_Series()->idx_get(0);

auto valueCell = workbook->GetCell(worksheetIndex, 1, 1, ObjectExt::Box(20));
series->get_DataPoints()->AddDataPointForBarSeries(valueCell);
valueCell = workbook->GetCell(worksheetIndex, 2, 1, ObjectExt::Box(50));
series->get_DataPoints()->AddDataPointForBarSeries(valueCell);
valueCell = workbook->GetCell(worksheetIndex, 3, 1, ObjectExt::Box(30));
series->get_DataPoints()->AddDataPointForBarSeries(valueCell);

series->get_Format()->get_Fill()->set_FillType(FillType::Solid);
series->get_Format()->get_Fill()->get_SolidFillColor()->set_Color(Color::get_Red());

series = chart->get_ChartData()->get_Series()->idx_get(1);

valueCell = workbook->GetCell(worksheetIndex, 1, 2, ObjectExt::Box(30));
series->get_DataPoints()->AddDataPointForBarSeries(valueCell);
valueCell = workbook->GetCell(worksheetIndex, 2, 2, ObjectExt::Box(10));
series->get_DataPoints()->AddDataPointForBarSeries(valueCell);
valueCell = workbook->GetCell(worksheetIndex, 3, 2, ObjectExt::Box(60));
series->get_DataPoints()->AddDataPointForBarSeries(valueCell);

series->get_Format()->get_Fill()->set_FillType(FillType::Solid);
series->get_Format()->get_Fill()->get_SolidFillColor()->set_Color(Color::get_Green());

auto label = series->get_DataPoints()->idx_get(0)->get_Label();
label->get_DataLabelFormat()->set_ShowCategoryName(true);

label = series->get_DataPoints()->idx_get(1)->get_Label();
label->get_DataLabelFormat()->set_ShowSeriesName(true);

label = series->get_DataPoints()->idx_get(2)->get_Label();
label->get_DataLabelFormat()->set_ShowValue(true);
label->get_DataLabelFormat()->set_ShowSeriesName(true);
label->get_DataLabelFormat()->set_Separator(u"/");

presentation->Save(u"AsposeChart.pptx", SaveFormat::Pptx);
结果:
创建散点图
散点图(也称为散点图或 x‑y 图)常用于检查模式或展示两个变量之间的相关性。
在以下情况下使用散点图:
- 您拥有配对的数值数据;
- 两个变量之间具有良好的配对关系;
- 您想确定这两个变量是否相关;
- 您有一个自变量对应多个因变量的取值。
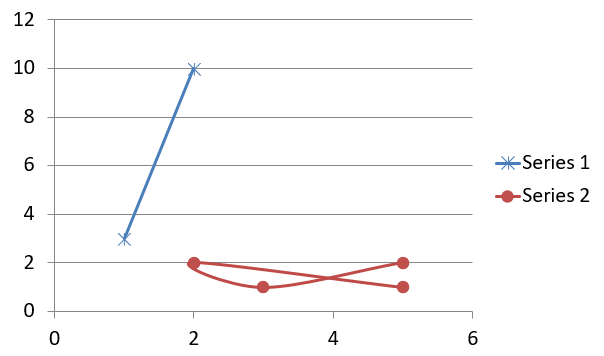
此示例绘制了两组 x‑y 值。第一系列使用带星形标记的直线,第二系列使用带圆形标记的平滑线;两者的标记大小均为 10,通过 set_Size 设置。set_Symbol 方法控制标记形状。
#include <system/shared_ptr.h>
#include <system/object_ext.h>
#include <system/string.h>
#include <DOM/Chart/ChartType.h>
#include <DOM/Chart/IChartCategoryCollection.h>
#include <DOM/Chart/IChartData.h>
#include <DOM/Chart/IChartDataCell.h>
#include <DOM/Chart/IChartDataPoint.h>
#include <DOM/Chart/IChartDataPointCollection.h>
#include <DOM/Chart/IChartDataWorkbook.h>
#include <DOM/Chart/IChartSeries.h>
#include <DOM/Chart/IChartSeriesCollection.h>
#include <DOM/Chart/IDoubleChartValue.h>
#include <DOM/Chart/IFormat.h>
#include <DOM/Chart/IMarker.h>
#include <DOM/Chart/MarkerStyleType.h>
#include <DOM/IChart.h>
#include <DOM/IColorFormat.h>
#include <DOM/IFillFormat.h>
#include <DOM/ILineFillFormat.h>
#include <DOM/ILineFormat.h>
#include <DOM/IShapeCollection.h>
#include <DOM/ISlide.h>
#include <DOM/Presentation.h>
#include <Export/SaveFormat.h>

using namespace System;
using namespace Aspose::Slides;
using namespace Aspose::Slides::Charts;
using namespace Aspose::Slides::Export;

auto presentation = MakeObject<Presentation>();
auto slide = presentation->get_Slide(0);

auto chart = slide->get_Shapes()->AddChart(ChartType::ScatterWithSmoothLines, 20, 20, 500, 300);

auto workbook = chart->get_ChartData()->get_ChartDataWorkbook();
auto worksheetIndex = 0;

chart->get_ChartData()->get_Series()->Clear();

auto seriesNameCell = workbook->GetCell(worksheetIndex, 1, 1, ObjectExt::Box(String(u"Series 1")));
chart->get_ChartData()->get_Series()->Add(seriesNameCell, chart->get_Type());
seriesNameCell = workbook->GetCell(worksheetIndex, 1, 3, ObjectExt::Box(String(u"Series 2")));
chart->get_ChartData()->get_Series()->Add(seriesNameCell, chart->get_Type());

auto series = chart->get_ChartData()->get_Series()->idx_get(0);

auto xValueCell = workbook->GetCell(worksheetIndex, 2, 1, ObjectExt::Box(1));
auto yValueCell = workbook->GetCell(worksheetIndex, 2, 2, ObjectExt::Box(3));
series->get_DataPoints()->AddDataPointForScatterSeries(xValueCell, yValueCell);

xValueCell = workbook->GetCell(worksheetIndex, 3, 1, ObjectExt::Box(2));
yValueCell = workbook->GetCell(worksheetIndex, 3, 2, ObjectExt::Box(10));
series->get_DataPoints()->AddDataPointForScatterSeries(xValueCell, yValueCell);

series->set_Type(ChartType::ScatterWithStraightLinesAndMarkers);

series->get_Marker()->set_Size(10);
series->get_Marker()->set_Symbol(MarkerStyleType::Star);

series = chart->get_ChartData()->get_Series()->idx_get(1);

xValueCell = workbook->GetCell(worksheetIndex, 2, 3, ObjectExt::Box(5));
yValueCell = workbook->GetCell(worksheetIndex, 2, 4, ObjectExt::Box(2));
series->get_DataPoints()->AddDataPointForScatterSeries(xValueCell, yValueCell);

xValueCell = workbook->GetCell(worksheetIndex, 3, 3, ObjectExt::Box(3));
yValueCell = workbook->GetCell(worksheetIndex, 3, 4, ObjectExt::Box(1));
series->get_DataPoints()->AddDataPointForScatterSeries(xValueCell, yValueCell);

xValueCell = workbook->GetCell(worksheetIndex, 4, 3, ObjectExt::Box(2));
yValueCell = workbook->GetCell(worksheetIndex, 4, 4, ObjectExt::Box(2));
series->get_DataPoints()->AddDataPointForScatterSeries(xValueCell, yValueCell);

xValueCell = workbook->GetCell(worksheetIndex, 5, 3, ObjectExt::Box(5));
yValueCell = workbook->GetCell(worksheetIndex, 5, 4, ObjectExt::Box(1));
series->get_DataPoints()->AddDataPointForScatterSeries(xValueCell, yValueCell);

series->get_Marker()->set_Size(10);
series->get_Marker()->set_Symbol(MarkerStyleType::Circle);

presentation->Save(u"AsposeChart.pptx", SaveFormat::Pptx);
结果:
创建饼图
饼图最适合展示数据的部分与整体关系,尤其是数据包含带数值的分类标签时。不过,如果数据包含的部分或标签很多,建议使用条形图。
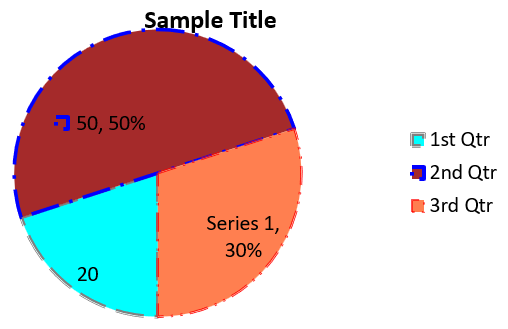
此示例创建了一个包含三个季度值的饼图。每个扇区都有自定义填充和边框,标签显示值、百分比和系列信息的不同组合。set_FirstSliceAngle 方法将第一扇区的起始角度设置为 180 度。
#include <system/shared_ptr.h>
#include <system/object_ext.h>
#include <system/string.h>
#include <drawing/color.h>
#include <DOM/Chart/ChartType.h>
#include <DOM/Chart/IChartCategoryCollection.h>
#include <DOM/Chart/IChartData.h>
#include <DOM/Chart/IChartDataCell.h>
#include <DOM/Chart/IChartDataPoint.h>
#include <DOM/Chart/IChartDataPointCollection.h>
#include <DOM/Chart/IChartDataWorkbook.h>
#include <DOM/Chart/IChartSeries.h>
#include <DOM/Chart/IChartSeriesCollection.h>
#include <DOM/Chart/IChartSeriesGroup.h>
#include <DOM/Chart/IChartSeriesGroupCollection.h>
#include <DOM/Chart/IChartTextFormat.h>
#include <DOM/Chart/IChartTitle.h>
#include <DOM/Chart/IDataLabel.h>
#include <DOM/Chart/IDataLabelCollection.h>
#include <DOM/Chart/IDataLabelFormat.h>
#include <DOM/Chart/IDoubleChartValue.h>
#include <DOM/Chart/IFormat.h>
#include <DOM/Chart/ILegend.h>
#include <DOM/FillType.h>
#include <DOM/IChart.h>
#include <DOM/IColorFormat.h>
#include <DOM/IFillFormat.h>
#include <DOM/ILineFillFormat.h>
#include <DOM/ILineFormat.h>
#include <DOM/IPortionFormat.h>
#include <DOM/IShapeCollection.h>
#include <DOM/ISlide.h>
#include <DOM/ITextFrame.h>
#include <DOM/ITextFrameFormat.h>
#include <DOM/LineDashStyle.h>
#include <DOM/LineStyle.h>
#include <DOM/NullableBool.h>
#include <DOM/Presentation.h>
#include <Export/SaveFormat.h>

using namespace System;
using namespace System::Drawing;
using namespace Aspose::Slides;
using namespace Aspose::Slides::Charts;
using namespace Aspose::Slides::Export;

auto presentation = MakeObject<Presentation>();
auto slide = presentation->get_Slide(0);

auto chart = slide->get_Shapes()->AddChart(ChartType::Pie, 20, 20, 500, 300);

chart->get_ChartTitle()->AddTextFrameForOverriding(u"Sample Title");
chart->get_ChartTitle()->get_TextFrameForOverriding()->get_TextFrameFormat()->set_CenterText(NullableBool::True);
chart->get_ChartTitle()->set_Height(20);
chart->set_HasTitle(true);

chart->get_ChartData()->get_Series()->idx_get(0)->get_Labels()->get_DefaultDataLabelFormat()->set_ShowValue(true);

auto workbook = chart->get_ChartData()->get_ChartDataWorkbook();
auto worksheetIndex = 0;

chart->get_ChartData()->get_Series()->Clear();
chart->get_ChartData()->get_Categories()->Clear();

auto categoryCell = workbook->GetCell(0, 1, 0, ObjectExt::Box(String(u"1st Qtr")));
chart->get_ChartData()->get_Categories()->Add(categoryCell);
categoryCell = workbook->GetCell(0, 2, 0, ObjectExt::Box(String(u"2nd Qtr")));
chart->get_ChartData()->get_Categories()->Add(categoryCell);
categoryCell = workbook->GetCell(0, 3, 0, ObjectExt::Box(String(u"3rd Qtr")));
chart->get_ChartData()->get_Categories()->Add(categoryCell);

auto seriesNameCell = workbook->GetCell(0, 0, 1, ObjectExt::Box(String(u"Series 1")));
auto series = chart->get_ChartData()->get_Series()->Add(seriesNameCell, chart->get_Type());

auto valueCell = workbook->GetCell(worksheetIndex, 1, 1, ObjectExt::Box(20));
series->get_DataPoints()->AddDataPointForPieSeries(valueCell);
valueCell = workbook->GetCell(worksheetIndex, 2, 1, ObjectExt::Box(50));
series->get_DataPoints()->AddDataPointForPieSeries(valueCell);
valueCell = workbook->GetCell(worksheetIndex, 3, 1, ObjectExt::Box(30));
series->get_DataPoints()->AddDataPointForPieSeries(valueCell);

chart->get_ChartData()->get_SeriesGroups()->idx_get(0)->set_IsColorVaried(true);

auto firstSlice = series->get_DataPoints()->idx_get(0);
firstSlice->get_Format()->get_Fill()->set_FillType(FillType::Solid);
firstSlice->get_Format()->get_Fill()->get_SolidFillColor()->set_Color(Color::get_Cyan());

firstSlice->get_Format()->get_Line()->get_FillFormat()->set_FillType(FillType::Solid);
firstSlice->get_Format()->get_Line()->get_FillFormat()->get_SolidFillColor()->set_Color(Color::get_Gray());
firstSlice->get_Format()->get_Line()->set_Width(3.0);
firstSlice->get_Format()->get_Line()->set_Style(LineStyle::ThinThick);
firstSlice->get_Format()->get_Line()->set_DashStyle(LineDashStyle::LargeDash);

auto secondSlice = series->get_DataPoints()->idx_get(1);
secondSlice->get_Format()->get_Fill()->set_FillType(FillType::Solid);
secondSlice->get_Format()->get_Fill()->get_SolidFillColor()->set_Color(Color::get_Brown());

secondSlice->get_Format()->get_Line()->get_FillFormat()->set_FillType(FillType::Solid);
secondSlice->get_Format()->get_Line()->get_FillFormat()->get_SolidFillColor()->set_Color(Color::get_Blue());
secondSlice->get_Format()->get_Line()->set_Width(3.0);
secondSlice->get_Format()->get_Line()->set_Style(LineStyle::Single);
secondSlice->get_Format()->get_Line()->set_DashStyle(LineDashStyle::LargeDashDot);

auto thirdSlice = series->get_DataPoints()->idx_get(2);
thirdSlice->get_Format()->get_Fill()->set_FillType(FillType::Solid);
thirdSlice->get_Format()->get_Fill()->get_SolidFillColor()->set_Color(Color::get_Coral());

thirdSlice->get_Format()->get_Line()->get_FillFormat()->set_FillType(FillType::Solid);
thirdSlice->get_Format()->get_Line()->get_FillFormat()->get_SolidFillColor()->set_Color(Color::get_Red());
thirdSlice->get_Format()->get_Line()->set_Width(2.0);
thirdSlice->get_Format()->get_Line()->set_Style(LineStyle::ThinThin);
thirdSlice->get_Format()->get_Line()->set_DashStyle(LineDashStyle::LargeDashDotDot);

auto firstLabel = series->get_DataPoints()->idx_get(0)->get_Label();
firstLabel->get_DataLabelFormat()->set_ShowValue(true);

auto secondLabel = series->get_DataPoints()->idx_get(1)->get_Label();
secondLabel->get_DataLabelFormat()->set_ShowValue(true);
secondLabel->get_DataLabelFormat()->set_ShowLegendKey(true);
secondLabel->get_DataLabelFormat()->set_ShowPercentage(true);

auto thirdLabel = series->get_DataPoints()->idx_get(2)->get_Label();
thirdLabel->get_DataLabelFormat()->set_ShowSeriesName(true);
thirdLabel->get_DataLabelFormat()->set_ShowPercentage(true);

series->get_Labels()->get_DefaultDataLabelFormat()->set_ShowLeaderLines(true);

chart->get_ChartData()->get_SeriesGroups()->idx_get(0)->set_FirstSliceAngle(180);

presentation->Save(u"PieChart.pptx", SaveFormat::Pptx);
结果:
创建折线图
折线图(也称为折线图)最适合用于展示随时间变化的数值。使用折线图,您可以一次性比较大量数据,跟踪随时间的变化和趋势,突出显示数据系列中的异常等。
此示例使用 AddChart 创建一个默认系列和类别的折线图,然后将演示文稿另存为 PPTX。
#include <system/shared_ptr.h>
#include <DOM/Chart/ChartType.h>
#include <DOM/Chart/IChartCategoryCollection.h>
#include <DOM/Chart/IChartData.h>
#include <DOM/Chart/IChartSeriesCollection.h>
#include <DOM/Chart/IFormat.h>
#include <DOM/IChart.h>
#include <DOM/IColorFormat.h>
#include <DOM/IFillFormat.h>
#include <DOM/ILineFillFormat.h>
#include <DOM/ILineFormat.h>
#include <DOM/IShapeCollection.h>
#include <DOM/ISlide.h>
#include <DOM/Presentation.h>
#include <Export/SaveFormat.h>

using namespace System;
using namespace Aspose::Slides;
using namespace Aspose::Slides::Charts;
using namespace Aspose::Slides::Export;

auto presentation = MakeObject<Presentation>();
auto slide = presentation->get_Slide(0);

auto lineChart = slide->get_Shapes()->AddChart(ChartType::Line, 20, 20, 500, 300);

presentation->Save(u"lineChart.pptx", SaveFormat::Pptx);
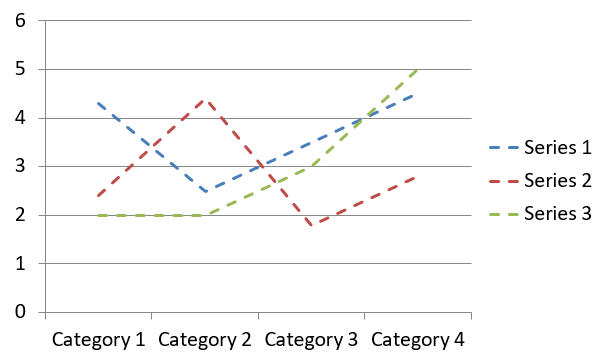
默认情况下,折线图上的点由连续的直线相连。如果希望点之间使用虚线,请调用带有 LineDashStyle 中某个值的 set_DashStyle:
#include <system/shared_ptr.h>
#include <DOM/Chart/ChartType.h>
#include <DOM/Chart/IChartCategoryCollection.h>
#include <DOM/Chart/IChartData.h>
#include <DOM/Chart/IChartSeries.h>
#include <DOM/Chart/IChartSeriesCollection.h>
#include <DOM/Chart/IFormat.h>
#include <DOM/IChart.h>
#include <DOM/IColorFormat.h>
#include <DOM/IFillFormat.h>
#include <DOM/ILineFillFormat.h>
#include <DOM/ILineFormat.h>
#include <DOM/IShapeCollection.h>
#include <DOM/ISlide.h>
#include <DOM/LineDashStyle.h>
#include <DOM/Presentation.h>

using namespace System;
using namespace Aspose::Slides;
using namespace Aspose::Slides::Charts;

auto presentation = MakeObject<Presentation>();
auto slide = presentation->get_Slide(0);

auto lineChart = slide->get_Shapes()->AddChart(ChartType::Line, 20, 20, 500, 300);

for (auto series : lineChart->get_ChartData()->get_Series())
{
    series->get_Format()->get_Line()->set_DashStyle(LineDashStyle::Dash);
}
结果:
创建树状图
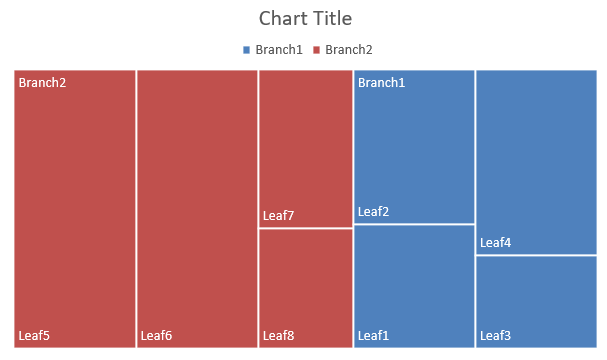
树状图最适合用于销售数据,能够显示数据类别的相对大小,并快速关注每个类别中贡献最大的项目。
此示例创建了一个包含八个叶子、四个干和两个分支的树状图。SetGroupingItem 方法在分组级别 1 上分配干,在级别 2 上分配分支。值决定矩形的相对大小,类别标签和重叠的父标签标识层级结构。
#include <system/shared_ptr.h>
#include <system/object_ext.h>
#include <system/string.h>
#include <DOM/Chart/ChartType.h>
#include <DOM/Chart/IChartCategory.h>
#include <DOM/Chart/IChartCategoryCollection.h>
#include <DOM/Chart/IChartCategoryLevelsManager.h>
#include <DOM/Chart/IChartData.h>
#include <DOM/Chart/IChartDataCell.h>
#include <DOM/Chart/IChartDataPoint.h>
#include <DOM/Chart/IChartDataPointCollection.h>
#include <DOM/Chart/IChartDataWorkbook.h>
#include <DOM/Chart/IChartSeries.h>
#include <DOM/Chart/IChartSeriesCollection.h>
#include <DOM/Chart/IDataLabel.h>
#include <DOM/Chart/IDataLabelCollection.h>
#include <DOM/Chart/IDataLabelFormat.h>
#include <DOM/Chart/IFormat.h>
#include <DOM/Chart/ParentLabelLayoutType.h>
#include <DOM/IChart.h>
#include <DOM/IColorFormat.h>
#include <DOM/IFillFormat.h>
#include <DOM/ILineFillFormat.h>
#include <DOM/ILineFormat.h>
#include <DOM/IShapeCollection.h>
#include <DOM/ISlide.h>
#include <DOM/Presentation.h>
#include <Export/SaveFormat.h>

using namespace System;
using namespace Aspose::Slides;
using namespace Aspose::Slides::Charts;
using namespace Aspose::Slides::Export;

auto presentation = MakeObject<Presentation>();
auto slide = presentation->get_Slide(0);

auto chart = slide->get_Shapes()->AddChart(ChartType::Treemap, 20, 20, 500, 300);

chart->get_ChartData()->get_Categories()->Clear();
chart->get_ChartData()->get_Series()->Clear();

auto workbook = chart->get_ChartData()->get_ChartDataWorkbook();
workbook->Clear(0);

// 分支 1
auto categoryCell = workbook->GetCell(0, u"C1", ObjectExt::Box(String(u"Leaf1")));
auto leaf = chart->get_ChartData()->get_Categories()->Add(categoryCell);
leaf->get_GroupingLevels()->SetGroupingItem(1, ObjectExt::Box(String(u"Stem1")));
leaf->get_GroupingLevels()->SetGroupingItem(2, ObjectExt::Box(String(u"Branch1")));

categoryCell = workbook->GetCell(0, u"C2", ObjectExt::Box(String(u"Leaf2")));
chart->get_ChartData()->get_Categories()->Add(categoryCell);

categoryCell = workbook->GetCell(0, u"C3", ObjectExt::Box(String(u"Leaf3")));
leaf = chart->get_ChartData()->get_Categories()->Add(categoryCell);
leaf->get_GroupingLevels()->SetGroupingItem(1, ObjectExt::Box(String(u"Stem2")));

categoryCell = workbook->GetCell(0, u"C4", ObjectExt::Box(String(u"Leaf4")));
chart->get_ChartData()->get_Categories()->Add(categoryCell);

// 分支 2
categoryCell = workbook->GetCell(0, u"C5", ObjectExt::Box(String(u"Leaf5")));
leaf = chart->get_ChartData()->get_Categories()->Add(categoryCell);
leaf->get_GroupingLevels()->SetGroupingItem(1, ObjectExt::Box(String(u"Stem3")));
leaf->get_GroupingLevels()->SetGroupingItem(2, ObjectExt::Box(String(u"Branch2")));

categoryCell = workbook->GetCell(0, u"C6", ObjectExt::Box(String(u"Leaf6")));
chart->get_ChartData()->get_Categories()->Add(categoryCell);

categoryCell = workbook->GetCell(0, u"C7", ObjectExt::Box(String(u"Leaf7")));
leaf = chart->get_ChartData()->get_Categories()->Add(categoryCell);
leaf->get_GroupingLevels()->SetGroupingItem(1, ObjectExt::Box(String(u"Stem4")));

categoryCell = workbook->GetCell(0, u"C8", ObjectExt::Box(String(u"Leaf8")));
chart->get_ChartData()->get_Categories()->Add(categoryCell);

auto series = chart->get_ChartData()->get_Series()->Add(ChartType::Treemap);
series->get_Labels()->get_DefaultDataLabelFormat()->set_ShowCategoryName(true);
auto valueCell = workbook->GetCell(0, u"D1", ObjectExt::Box(4));
series->get_DataPoints()->AddDataPointForTreemapSeries(valueCell);
valueCell = workbook->GetCell(0, u"D2", ObjectExt::Box(5));
series->get_DataPoints()->AddDataPointForTreemapSeries(valueCell);
valueCell = workbook->GetCell(0, u"D3", ObjectExt::Box(3));
series->get_DataPoints()->AddDataPointForTreemapSeries(valueCell);
valueCell = workbook->GetCell(0, u"D4", ObjectExt::Box(6));
series->get_DataPoints()->AddDataPointForTreemapSeries(valueCell);
valueCell = workbook->GetCell(0, u"D5", ObjectExt::Box(9));
series->get_DataPoints()->AddDataPointForTreemapSeries(valueCell);
valueCell = workbook->GetCell(0, u"D6", ObjectExt::Box(9));
series->get_DataPoints()->AddDataPointForTreemapSeries(valueCell);
valueCell = workbook->GetCell(0, u"D7", ObjectExt::Box(4));
series->get_DataPoints()->AddDataPointForTreemapSeries(valueCell);
valueCell = workbook->GetCell(0, u"D8", ObjectExt::Box(3));
series->get_DataPoints()->AddDataPointForTreemapSeries(valueCell);

series->set_ParentLabelLayout(ParentLabelLayoutType::Overlapping);

presentation->Save(u"Treemap.pptx", SaveFormat::Pptx);
结果:
创建瀑布图
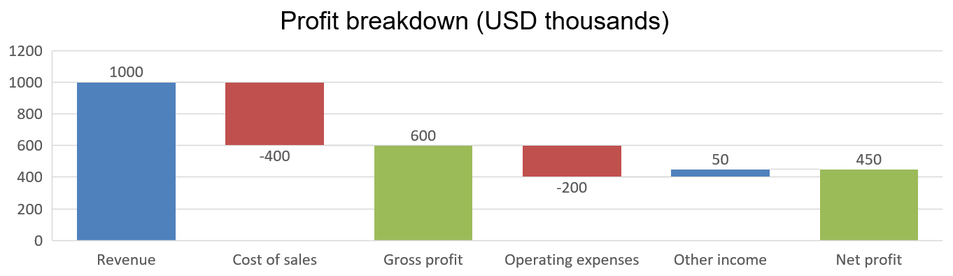
瀑布图展示正负变化如何累计到最终值。例如,利润分解可以从收入开始,减去成本,再加上其他收入。变化列在前一个累计值和新累计值之间浮动,而总计列则从零延伸到累计值。
以下示例使用千美元为单位的金额:
| 类别 | 工作簿数值 | 列类型 |
|---|---|---|
| Revenue | 1000 | Increase |
| Cost of sales | -400 | Decrease |
| Gross profit | 600 | Intermediate total |
| Operating expenses | -200 | Decrease |
| Other income | 50 | Increase |
| Net profit | 450 | Final total |
要将某一点标记为中间或最终总计,请对其调用 set_SetAsTotal 并传入 true。在该点的工作簿单元格中提供实际累计数值:毛利润为 600(1000 - 400),净利润为 450(600 - 200 + 50)。该方法仅标记列为总计,不会计算或填充单元格数值。请勿使用零作为占位符,也不要为总计点提供其他变化。总计列显示累计值,但不会再次将其加入运行值。
完整的 C++ 示例使用 ChartType 的 Waterfall 成员创建图表,清除默认数据,并填充嵌入式工作簿。工作表索引 0 选取第一张工作表;列 A 包含类别名称,列 B 包含数值。每个数值单元格通过 AddDataPointForWaterfallSeries 添加。基于零的点索引 2 和 5 标识中间总计和最终总计。将 true 传入 set_ShowValue 可在列上显示数额。此示例不需要输入演示文稿或工作簿。
#include <system/shared_ptr.h>
#include <system/object_ext.h>
#include <system/string.h>
#include <system/array.h>
#include <DOM/Chart/ChartType.h>
#include <DOM/Chart/IChartCategoryCollection.h>
#include <DOM/Chart/IChartData.h>
#include <DOM/Chart/IChartDataCell.h>
#include <DOM/Chart/IChartDataPoint.h>
#include <DOM/Chart/IChartDataPointCollection.h>
#include <DOM/Chart/IChartDataWorkbook.h>
#include <DOM/Chart/IChartSeries.h>
#include <DOM/Chart/IChartSeriesCollection.h>
#include <DOM/Chart/IChartTextFormat.h>
#include <DOM/Chart/IChartTitle.h>
#include <DOM/Chart/IDataLabel.h>
#include <DOM/Chart/IDataLabelCollection.h>
#include <DOM/Chart/IDataLabelFormat.h>
#include <DOM/Chart/IDoubleChartValue.h>
#include <DOM/Chart/IFormat.h>
#include <DOM/Chart/ILegend.h>
#include <DOM/IChart.h>
#include <DOM/IColorFormat.h>
#include <DOM/IFillFormat.h>
#include <DOM/ILineFillFormat.h>
#include <DOM/ILineFormat.h>
#include <DOM/IPortionFormat.h>
#include <DOM/IShapeCollection.h>
#include <DOM/ISlide.h>
#include <DOM/ITextFrame.h>
#include <DOM/ITextFrameFormat.h>
#include <DOM/NullableBool.h>
#include <DOM/Presentation.h>
#include <Export/SaveFormat.h>

using namespace System;
using namespace Aspose::Slides;
using namespace Aspose::Slides::Charts;
using namespace Aspose::Slides::Export;

auto presentation = MakeObject<Presentation>();
auto slide = presentation->get_Slide(0);

auto chart = slide->get_Shapes()->AddChart(ChartType::Waterfall, 20, 20, 680, 200);

chart->set_HasTitle(true);
chart->get_ChartTitle()->AddTextFrameForOverriding(u"Profit breakdown (USD thousands)");
chart->get_ChartTitle()->set_Overlay(false);
chart->set_HasLegend(false);

chart->get_ChartData()->get_Series()->Clear();
chart->get_ChartData()->get_Categories()->Clear();

auto workbook = chart->get_ChartData()->get_ChartDataWorkbook();
auto worksheetIndex = 0;

workbook->Clear(worksheetIndex);

auto seriesNameCell = workbook->GetCell(worksheetIndex, 0, 1, ObjectExt::Box(String(u"Profit")));
auto series = chart->get_ChartData()->get_Series()->Add(seriesNameCell, ChartType::Waterfall);
auto categories = MakeArray<String>({ u"Revenue", u"Cost of sales", u"Gross profit", u"Operating expenses", u"Other income", u"Net profit" });
auto values = MakeArray<double>({ 1000, -400, 600, -200, 50, 450 });

for (auto i = 0; i < categories->get_Length(); i++)
{
    auto categoryCell = workbook->GetCell(worksheetIndex, i + 1, 0, ObjectExt::Box(categories->idx_get(i)));
    chart->get_ChartData()->get_Categories()->Add(categoryCell);
    auto valueCell = workbook->GetCell(worksheetIndex, i + 1, 1, ObjectExt::Box(values->idx_get(i)));
    series->get_DataPoints()->AddDataPointForWaterfallSeries(valueCell);
}

// 第三和第六个点代表总计,而不是额外的变化。
series->get_DataPoints()->idx_get(2)->set_SetAsTotal(true);
series->get_DataPoints()->idx_get(5)->set_SetAsTotal(true);
series->set_ShowConnectorLines(true);
series->get_Labels()->get_DefaultDataLabelFormat()->set_ShowValue(true);

presentation->Save(u"WaterfallChart.pptx", SaveFormat::Pptx);
在系列层面调用 set_ShowConnectorLines 并传入 true,可显示连接相邻列的线,使运行值更易于跟踪。若要隐藏这些线,请在保存前将示例中的赋值替换为 series->set_ShowConnectorLines(false);。此修改只影响线的可见性,不会改变数据或总计。
保存后的演示文稿显示毛利润 600 和净利润 450,两者的总计均从零开始绘制:
创建股票图
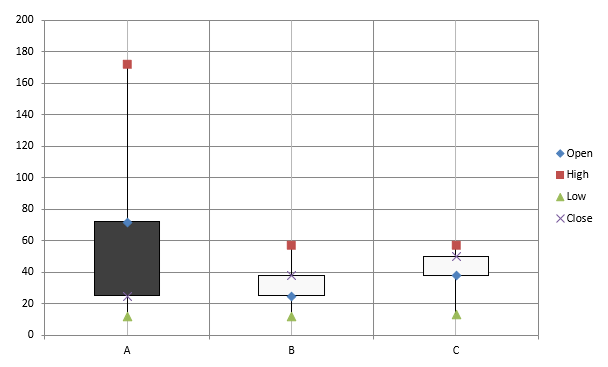
股票图用于展示开盘价、最高价、最低价和收盘价等金融数据,帮助分析市场趋势和波动性。它们提供有关股票表现的关键洞察,帮助投资者和分析师作出明智决策。
此示例创建了一个包含四个系列(顺序为开‑高‑低‑收)的股票图,并包含三个类别。set_HasUpDownBars 方法启用上/下柱,get_HiLowLinesFormat 控制显示价格区间的高低线,而各系列线和次要水平网格线被隐藏。
#include <DOM/Chart/IChartLinesFormat.h>
#include <system/shared_ptr.h>
#include <system/object_ext.h>
#include <system/string.h>
#include <DOM/Chart/ChartType.h>
#include <DOM/Chart/IAxesManager.h>
#include <DOM/Chart/IAxis.h>
#include <DOM/Chart/IChartCategoryCollection.h>
#include <DOM/Chart/IChartData.h>
#include <DOM/Chart/IChartDataCell.h>
#include <DOM/Chart/IChartDataPoint.h>
#include <DOM/Chart/IChartDataPointCollection.h>
#include <DOM/Chart/IChartDataWorkbook.h>
#include <DOM/Chart/IChartSeries.h>
#include <DOM/Chart/IChartSeriesCollection.h>
#include <DOM/Chart/IChartSeriesGroup.h>
#include <DOM/Chart/IChartSeriesGroupCollection.h>
#include <DOM/Chart/IFormat.h>
#include <DOM/Chart/IUpDownBarsManager.h>
#include <DOM/FillType.h>
#include <DOM/IChart.h>
#include <DOM/IColorFormat.h>
#include <DOM/IFillFormat.h>
#include <DOM/ILineFillFormat.h>
#include <DOM/ILineFormat.h>
#include <DOM/IShapeCollection.h>
#include <DOM/ISlide.h>
#include <DOM/Presentation.h>
#include <Export/SaveFormat.h>

using namespace System;
using namespace Aspose::Slides;
using namespace Aspose::Slides::Charts;
using namespace Aspose::Slides::Export;

auto presentation = MakeObject<Presentation>();
auto slide = presentation->get_Slide(0);

auto chart = slide->get_Shapes()->AddChart(ChartType::OpenHighLowClose, 20, 20, 500, 300, false);

auto workbook = chart->get_ChartData()->get_ChartDataWorkbook();

auto categoryCell = workbook->GetCell(0, 1, 0, ObjectExt::Box(String(u"A")));
chart->get_ChartData()->get_Categories()->Add(categoryCell);
categoryCell = workbook->GetCell(0, 2, 0, ObjectExt::Box(String(u"B")));
chart->get_ChartData()->get_Categories()->Add(categoryCell);
categoryCell = workbook->GetCell(0, 3, 0, ObjectExt::Box(String(u"C")));
chart->get_ChartData()->get_Categories()->Add(categoryCell);

auto seriesNameCell = workbook->GetCell(0, 0, 1, ObjectExt::Box(String(u"Open")));
chart->get_ChartData()->get_Series()->Add(seriesNameCell, ChartType::OpenHighLowClose);
seriesNameCell = workbook->GetCell(0, 0, 2, ObjectExt::Box(String(u"High")));
chart->get_ChartData()->get_Series()->Add(seriesNameCell, ChartType::OpenHighLowClose);
seriesNameCell = workbook->GetCell(0, 0, 3, ObjectExt::Box(String(u"Low")));
chart->get_ChartData()->get_Series()->Add(seriesNameCell, ChartType::OpenHighLowClose);
seriesNameCell = workbook->GetCell(0, 0, 4, ObjectExt::Box(String(u"Close")));
chart->get_ChartData()->get_Series()->Add(seriesNameCell, ChartType::OpenHighLowClose);

auto series = chart->get_ChartData()->get_Series()->idx_get(0);
auto valueCell = workbook->GetCell(0, 1, 1, ObjectExt::Box(72));
series->get_DataPoints()->AddDataPointForStockSeries(valueCell);
valueCell = workbook->GetCell(0, 2, 1, ObjectExt::Box(25));
series->get_DataPoints()->AddDataPointForStockSeries(valueCell);
valueCell = workbook->GetCell(0, 3, 1, ObjectExt::Box(38));
series->get_DataPoints()->AddDataPointForStockSeries(valueCell);

series = chart->get_ChartData()->get_Series()->idx_get(1);
valueCell = workbook->GetCell(0, 1, 2, ObjectExt::Box(172));
series->get_DataPoints()->AddDataPointForStockSeries(valueCell);
valueCell = workbook->GetCell(0, 2, 2, ObjectExt::Box(57));
series->get_DataPoints()->AddDataPointForStockSeries(valueCell);
valueCell = workbook->GetCell(0, 3, 2, ObjectExt::Box(57));
series->get_DataPoints()->AddDataPointForStockSeries(valueCell);

series = chart->get_ChartData()->get_Series()->idx_get(2);
valueCell = workbook->GetCell(0, 1, 3, ObjectExt::Box(12));
series->get_DataPoints()->AddDataPointForStockSeries(valueCell);
valueCell = workbook->GetCell(0, 2, 3, ObjectExt::Box(12));
series->get_DataPoints()->AddDataPointForStockSeries(valueCell);
valueCell = workbook->GetCell(0, 3, 3, ObjectExt::Box(13));
series->get_DataPoints()->AddDataPointForStockSeries(valueCell);

series = chart->get_ChartData()->get_Series()->idx_get(3);
valueCell = workbook->GetCell(0, 1, 4, ObjectExt::Box(25));
series->get_DataPoints()->AddDataPointForStockSeries(valueCell);
valueCell = workbook->GetCell(0, 2, 4, ObjectExt::Box(38));
series->get_DataPoints()->AddDataPointForStockSeries(valueCell);
valueCell = workbook->GetCell(0, 3, 4, ObjectExt::Box(50));
series->get_DataPoints()->AddDataPointForStockSeries(valueCell);

chart->get_ChartData()->get_SeriesGroups()->idx_get(0)->get_UpDownBars()->set_HasUpDownBars(true);
chart->get_ChartData()->get_SeriesGroups()->idx_get(0)->get_HiLowLinesFormat()->get_Line()->get_FillFormat()->set_FillType(FillType::Solid);

for (auto stockSeries : chart->get_ChartData()->get_Series())
{
    stockSeries->get_Format()->get_Line()->get_FillFormat()->set_FillType(FillType::NoFill);
}

chart->get_Axes()->get_VerticalAxis()->get_MinorGridLinesFormat()->get_Line()->get_FillFormat()->set_FillType(FillType::NoFill);

presentation->Save(u"Stock-chart.pptx", SaveFormat::Pptx);
结果:
创建箱线图
箱线图用于通过汇总关键统计量(如中位数、四分位数和潜在异常值)来展示数据分布。它们在探索性数据分析和统计研究中非常有用,能够快速了解数据的变异性并识别异常。
此示例使用六个数值创建箱线图。set_QuartileMethod 方法选用排他式四分位计算。示例同时启用了均值线、均值标记、内部点和异常点。
#include <system/shared_ptr.h>
#include <system/object_ext.h>
#include <system/string.h>
#include <DOM/Chart/ChartType.h>
#include <DOM/Chart/IChartCategoryCollection.h>
#include <DOM/Chart/IChartData.h>
#include <DOM/Chart/IChartDataCell.h>
#include <DOM/Chart/IChartDataPoint.h>
#include <DOM/Chart/IChartDataPointCollection.h>
#include <DOM/Chart/IChartDataWorkbook.h>
#include <DOM/Chart/IChartSeries.h>
#include <DOM/Chart/IChartSeriesCollection.h>
#include <DOM/Chart/IFormat.h>
#include <DOM/Chart/IMarker.h>
#include <DOM/Chart/QuartileMethodType.h>
#include <DOM/IChart.h>
#include <DOM/IColorFormat.h>
#include <DOM/IFillFormat.h>
#include <DOM/ILineFillFormat.h>
#include <DOM/ILineFormat.h>
#include <DOM/IShapeCollection.h>
#include <DOM/ISlide.h>
#include <DOM/Presentation.h>
#include <Export/SaveFormat.h>

using namespace System;
using namespace Aspose::Slides;
using namespace Aspose::Slides::Charts;
using namespace Aspose::Slides::Export;

auto presentation = MakeObject<Presentation>();
auto slide = presentation->get_Slide(0);

auto chart = slide->get_Shapes()->AddChart(ChartType::BoxAndWhisker, 20, 20, 500, 300);

chart->get_ChartData()->get_Categories()->Clear();
chart->get_ChartData()->get_Series()->Clear();

auto workbook = chart->get_ChartData()->get_ChartDataWorkbook();
workbook->Clear(0);

auto categoryCell = workbook->GetCell(0, u"A1", ObjectExt::Box(String(u"Category 1")));
chart->get_ChartData()->get_Categories()->Add(categoryCell);
categoryCell = workbook->GetCell(0, u"A2", ObjectExt::Box(String(u"Category 2")));
chart->get_ChartData()->get_Categories()->Add(categoryCell);
categoryCell = workbook->GetCell(0, u"A3", ObjectExt::Box(String(u"Category 3")));
chart->get_ChartData()->get_Categories()->Add(categoryCell);
categoryCell = workbook->GetCell(0, u"A4", ObjectExt::Box(String(u"Category 4")));
chart->get_ChartData()->get_Categories()->Add(categoryCell);
categoryCell = workbook->GetCell(0, u"A5", ObjectExt::Box(String(u"Category 5")));
chart->get_ChartData()->get_Categories()->Add(categoryCell);
categoryCell = workbook->GetCell(0, u"A6", ObjectExt::Box(String(u"Category 6")));
chart->get_ChartData()->get_Categories()->Add(categoryCell);

auto series = chart->get_ChartData()->get_Series()->Add(ChartType::BoxAndWhisker);

series->set_QuartileMethod(QuartileMethodType::Exclusive);
series->set_ShowMeanLine(true);
series->set_ShowMeanMarkers(true);
series->set_ShowInnerPoints(true);
series->set_ShowOutlierPoints(true);

auto valueCell = workbook->GetCell(0, u"B1", ObjectExt::Box(15));
series->get_DataPoints()->AddDataPointForBoxAndWhiskerSeries(valueCell);
valueCell = workbook->GetCell(0, u"B2", ObjectExt::Box(41));
series->get_DataPoints()->AddDataPointForBoxAndWhiskerSeries(valueCell);
valueCell = workbook->GetCell(0, u"B3", ObjectExt::Box(16));
series->get_DataPoints()->AddDataPointForBoxAndWhiskerSeries(valueCell);
valueCell = workbook->GetCell(0, u"B4", ObjectExt::Box(10));
series->get_DataPoints()->AddDataPointForBoxAndWhiskerSeries(valueCell);
valueCell = workbook->GetCell(0, u"B5", ObjectExt::Box(23));
series->get_DataPoints()->AddDataPointForBoxAndWhiskerSeries(valueCell);
valueCell = workbook->GetCell(0, u"B6", ObjectExt::Box(16));
series->get_DataPoints()->AddDataPointForBoxAndWhiskerSeries(valueCell);

presentation->Save(u"BoxAndWhisker.pptx", SaveFormat::Pptx);
创建漏斗图
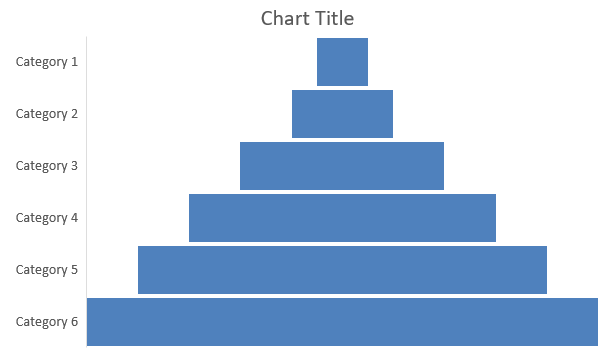
漏斗图用于可视化包含连续阶段的流程,数据量随步骤推进而递减。它们在分析转化率、识别瓶颈以及跟踪销售或营销过程效率方面尤为有用。
此示例使用 AddChart 将漏斗图添加到现有演示文稿的第一张幻灯片。它用六个类别和从 50 到 500 的数值替换默认数据,然后保存更新后的演示文稿。输入演示文稿必须至少包含一张幻灯片。
#include <system/shared_ptr.h>
#include <system/object_ext.h>
#include <system/string.h>
#include <DOM/Chart/ChartType.h>
#include <DOM/Chart/IChartCategoryCollection.h>
#include <DOM/Chart/IChartData.h>
#include <DOM/Chart/IChartDataCell.h>
#include <DOM/Chart/IChartDataPoint.h>
#include <DOM/Chart/IChartDataPointCollection.h>
#include <DOM/Chart/IChartDataWorkbook.h>
#include <DOM/Chart/IChartSeries.h>
#include <DOM/Chart/IChartSeriesCollection.h>
#include <DOM/Chart/IFormat.h>
#include <DOM/IChart.h>
#include <DOM/IColorFormat.h>
#include <DOM/IFillFormat.h>
#include <DOM/ILineFillFormat.h>
#include <DOM/ILineFormat.h>
#include <DOM/IShapeCollection.h>
#include <DOM/ISlide.h>
#include <DOM/Presentation.h>
#include <Export/SaveFormat.h>

using namespace System;
using namespace Aspose::Slides;
using namespace Aspose::Slides::Charts;
using namespace Aspose::Slides::Export;

auto presentation = MakeObject<Presentation>(u"test.pptx");
auto slide = presentation->get_Slide(0);

auto chart = slide->get_Shapes()->AddChart(ChartType::Funnel, 50, 50, 500, 400);

chart->get_ChartData()->get_Categories()->Clear();
chart->get_ChartData()->get_Series()->Clear();

auto workbook = chart->get_ChartData()->get_ChartDataWorkbook();
workbook->Clear(0);

auto categoryCell = workbook->GetCell(0, u"A1", ObjectExt::Box(String(u"Category 1")));
chart->get_ChartData()->get_Categories()->Add(categoryCell);
categoryCell = workbook->GetCell(0, u"A2", ObjectExt::Box(String(u"Category 2")));
chart->get_ChartData()->get_Categories()->Add(categoryCell);
categoryCell = workbook->GetCell(0, u"A3", ObjectExt::Box(String(u"Category 3")));
chart->get_ChartData()->get_Categories()->Add(categoryCell);
categoryCell = workbook->GetCell(0, u"A4", ObjectExt::Box(String(u"Category 4")));
chart->get_ChartData()->get_Categories()->Add(categoryCell);
categoryCell = workbook->GetCell(0, u"A5", ObjectExt::Box(String(u"Category 5")));
chart->get_ChartData()->get_Categories()->Add(categoryCell);
categoryCell = workbook->GetCell(0, u"A6", ObjectExt::Box(String(u"Category 6")));
chart->get_ChartData()->get_Categories()->Add(categoryCell);

auto series = chart->get_ChartData()->get_Series()->Add(ChartType::Funnel);

auto valueCell = workbook->GetCell(0, u"B1", ObjectExt::Box(50));
series->get_DataPoints()->AddDataPointForFunnelSeries(valueCell);
valueCell = workbook->GetCell(0, u"B2", ObjectExt::Box(100));
series->get_DataPoints()->AddDataPointForFunnelSeries(valueCell);
valueCell = workbook->GetCell(0, u"B3", ObjectExt::Box(200));
series->get_DataPoints()->AddDataPointForFunnelSeries(valueCell);
valueCell = workbook->GetCell(0, u"B4", ObjectExt::Box(300));
series->get_DataPoints()->AddDataPointForFunnelSeries(valueCell);
valueCell = workbook->GetCell(0, u"B5", ObjectExt::Box(400));
series->get_DataPoints()->AddDataPointForFunnelSeries(valueCell);
valueCell = workbook->GetCell(0, u"B6", ObjectExt::Box(500));
series->get_DataPoints()->AddDataPointForFunnelSeries(valueCell);

presentation->Save(u"Funnel.pptx", SaveFormat::Pptx);
结果:
创建旭辉图
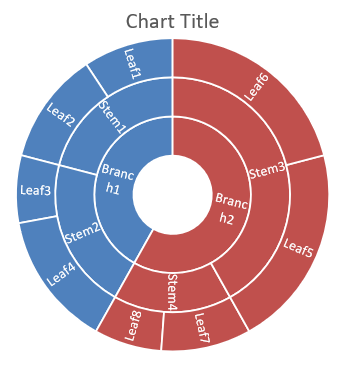
旭辉图用于可视化层级数据,以同心环的形式显示各级别。它们有助于展示部分与整体的关系,特别适合以紧凑清晰的方式表示嵌套的类别和子类别。
此示例创建了一个包含八个叶子、四个干和两个分支的旭辉图。SetGroupingItem 方法在分组级别 1 上分配干,在级别 2 上分配分支。类别标签标识各段,数值决定相对大小。
#include <system/shared_ptr.h>
#include <system/object_ext.h>
#include <system/string.h>
#include <DOM/Chart/ChartType.h>
#include <DOM/Chart/IChartCategory.h>
#include <DOM/Chart/IChartCategoryCollection.h>
#include <DOM/Chart/IChartCategoryLevelsManager.h>
#include <DOM/Chart/IChartData.h>
#include <DOM/Chart/IChartDataCell.h>
#include <DOM/Chart/IChartDataPoint.h>
#include <DOM/Chart/IChartDataPointCollection.h>
#include <DOM/Chart/IChartDataWorkbook.h>
#include <DOM/Chart/IChartSeries.h>
#include <DOM/Chart/IChartSeriesCollection.h>
#include <DOM/Chart/IDataLabel.h>
#include <DOM/Chart/IDataLabelCollection.h>
#include <DOM/Chart/IDataLabelFormat.h>
#include <DOM/Chart/IFormat.h>
#include <DOM/IChart.h>
#include <DOM/IColorFormat.h>
#include <DOM/IFillFormat.h>
#include <DOM/ILineFillFormat.h>
#include <DOM/ILineFormat.h>
#include <DOM/IShapeCollection.h>
#include <DOM/ISlide.h>
#include <DOM/Presentation.h>
#include <Export/SaveFormat.h>

using namespace System;
using namespace Aspose::Slides;
using namespace Aspose::Slides::Charts;
using namespace Aspose::Slides::Export;

auto presentation = MakeObject<Presentation>();
auto slide = presentation->get_Slide(0);

auto chart = slide->get_Shapes()->AddChart(ChartType::Sunburst, 20, 20, 500, 300);

chart->get_ChartData()->get_Categories()->Clear();
chart->get_ChartData()->get_Series()->Clear();

auto workbook = chart->get_ChartData()->get_ChartDataWorkbook();
workbook->Clear(0);

// 分支 1
auto categoryCell = workbook->GetCell(0, u"C1", ObjectExt::Box(String(u"Leaf1")));
auto leaf = chart->get_ChartData()->get_Categories()->Add(categoryCell);
leaf->get_GroupingLevels()->SetGroupingItem(1, ObjectExt::Box(String(u"Stem1")));
leaf->get_GroupingLevels()->SetGroupingItem(2, ObjectExt::Box(String(u"Branch1")));

categoryCell = workbook->GetCell(0, u"C2", ObjectExt::Box(String(u"Leaf2")));
chart->get_ChartData()->get_Categories()->Add(categoryCell);

categoryCell = workbook->GetCell(0, u"C3", ObjectExt::Box(String(u"Leaf3")));
leaf = chart->get_ChartData()->get_Categories()->Add(categoryCell);
leaf->get_GroupingLevels()->SetGroupingItem(1, ObjectExt::Box(String(u"Stem2")));

categoryCell = workbook->GetCell(0, u"C4", ObjectExt::Box(String(u"Leaf4")));
chart->get_ChartData()->get_Categories()->Add(categoryCell);

// 分支 2
categoryCell = workbook->GetCell(0, u"C5", ObjectExt::Box(String(u"Leaf5")));
leaf = chart->get_ChartData()->get_Categories()->Add(categoryCell);
leaf->get_GroupingLevels()->SetGroupingItem(1, ObjectExt::Box(String(u"Stem3")));
leaf->get_GroupingLevels()->SetGroupingItem(2, ObjectExt::Box(String(u"Branch2")));

categoryCell = workbook->GetCell(0, u"C6", ObjectExt::Box(String(u"Leaf6")));
chart->get_ChartData()->get_Categories()->Add(categoryCell);

categoryCell = workbook->GetCell(0, u"C7", ObjectExt::Box(String(u"Leaf7")));
leaf = chart->get_ChartData()->get_Categories()->Add(categoryCell);
leaf->get_GroupingLevels()->SetGroupingItem(1, ObjectExt::Box(String(u"Stem4")));

categoryCell = workbook->GetCell(0, u"C8", ObjectExt::Box(String(u"Leaf8")));
chart->get_ChartData()->get_Categories()->Add(categoryCell);

auto series = chart->get_ChartData()->get_Series()->Add(ChartType::Sunburst);
series->get_Labels()->get_DefaultDataLabelFormat()->set_ShowCategoryName(true);
auto valueCell = workbook->GetCell(0, u"D1", ObjectExt::Box(4));
series->get_DataPoints()->AddDataPointForSunburstSeries(valueCell);
valueCell = workbook->GetCell(0, u"D2", ObjectExt::Box(5));
series->get_DataPoints()->AddDataPointForSunburstSeries(valueCell);
valueCell = workbook->GetCell(0, u"D3", ObjectExt::Box(3));
series->get_DataPoints()->AddDataPointForSunburstSeries(valueCell);
valueCell = workbook->GetCell(0, u"D4", ObjectExt::Box(6));
series->get_DataPoints()->AddDataPointForSunburstSeries(valueCell);
valueCell = workbook->GetCell(0, u"D5", ObjectExt::Box(9));
series->get_DataPoints()->AddDataPointForSunburstSeries(valueCell);
valueCell = workbook->GetCell(0, u"D6", ObjectExt::Box(9));
series->get_DataPoints()->AddDataPointForSunburstSeries(valueCell);
valueCell = workbook->GetCell(0, u"D7", ObjectExt::Box(4));
series->get_DataPoints()->AddDataPointForSunburstSeries(valueCell);
valueCell = workbook->GetCell(0, u"D8", ObjectExt::Box(3));
series->get_DataPoints()->AddDataPointForSunburstSeries(valueCell);

presentation->Save(u"Sunburst.pptx", SaveFormat::Pptx);
结果:
创建直方图
直方图展示数值在区间(箱)上的分布情况。对于订单处理时间的月度报告,使用相同的箱宽和阈值可保持区间一致,便于比较分布。
对水平坐标轴调用 set_AggregationType 并传入 AxisAggregationType 中的模式。ByBinWidth 模式下使用 set_BinWidth,ByNumberOfBins 模式下使用 set_NumberOfBins。使用 Automatic 让图表自行决定箱的划分。
使用固定箱宽
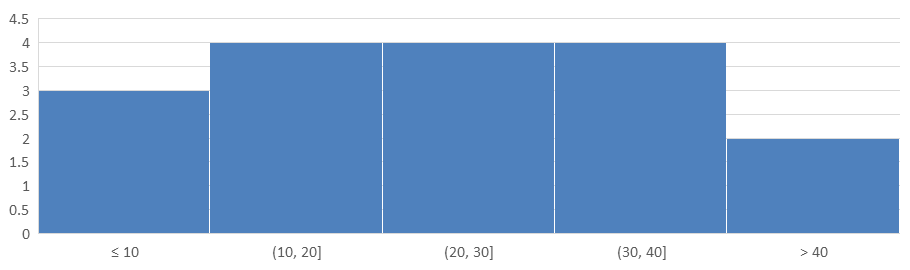
此示例将处理时间分组为 10 分钟间隔,并为 ≤10 分钟和 >40 分钟的时间分别设置单独的箱。通过 set_IsUnderflowBin 和 set_IsOverflowBin 启用这些箱。若通过 set_UnderflowBin 和 set_OverflowBin 明确阈值,还需将 set_IsAutomaticUnderflowBin 和 set_IsAutomaticOverflowBin 设为 false。
#include <system/array.h>
#include <system/shared_ptr.h>
#include <system/object_ext.h>
#include <system/string.h>
#include <DOM/Chart/AxisAggregationType.h>
#include <DOM/Chart/ChartType.h>
#include <DOM/Chart/IAxesManager.h>
#include <DOM/Chart/IAxis.h>
#include <DOM/Chart/IChartCategoryCollection.h>
#include <DOM/Chart/IChartData.h>
#include <DOM/Chart/IChartDataCell.h>
#include <DOM/Chart/IChartDataPoint.h>
#include <DOM/Chart/IChartDataPointCollection.h>
#include <DOM/Chart/IChartDataWorkbook.h>
#include <DOM/Chart/IChartSeries.h>
#include <DOM/Chart/IChartSeriesCollection.h>
#include <DOM/Chart/IFormat.h>
#include <DOM/IChart.h>
#include <DOM/IColorFormat.h>
#include <DOM/IFillFormat.h>
#include <DOM/ILineFillFormat.h>
#include <DOM/ILineFormat.h>
#include <DOM/IShapeCollection.h>
#include <DOM/ISlide.h>
#include <DOM/Presentation.h>
#include <Export/SaveFormat.h>

using namespace System;
using namespace Aspose::Slides;
using namespace Aspose::Slides::Charts;
using namespace Aspose::Slides::Export;

auto presentation = MakeObject<Presentation>();
auto slide = presentation->get_Slide(0);

auto chart = slide->get_Shapes()->AddChart(ChartType::Histogram, 20, 20, 680, 200);

chart->set_HasLegend(false);
chart->set_HasTitle(false);

chart->get_ChartData()->get_Categories()->Clear();
chart->get_ChartData()->get_Series()->Clear();

auto workbook = chart->get_ChartData()->get_ChartDataWorkbook();
workbook->Clear(0);

auto series = chart->get_ChartData()->get_Series()->Add(ChartType::Histogram);
auto values = MakeArray<double>({ 5, 10, 10, 11, 15, 20, 20, 21, 25, 30, 30, 31, 35, 40, 40, 41, 50 });
for (auto i = 0; i < values->get_Length(); i++)
{
    auto valueCell = workbook->GetCell(0, i, 0, ObjectExt::Box(values[i]));
    series->get_DataPoints()->AddDataPointForHistogramSeries(valueCell);
}

auto axis = chart->get_Axes()->get_HorizontalAxis();
axis->set_AggregationType(AxisAggregationType::ByBinWidth);
axis->set_BinWidth(10);
axis->set_IsUnderflowBin(true);
axis->set_IsAutomaticUnderflowBin(false);
axis->set_UnderflowBin(10);
axis->set_IsOverflowBin(true);
axis->set_IsAutomaticOverflowBin(false);
axis->set_OverflowBin(40);

presentation->Save(u"Histogram-bin-width.pptx", SaveFormat::Pptx);
PowerPoint 中展示的演示文稿显示箱计数为 3、4、4、4、2。下溢箱包含 5、10、10,因此阈值为闭区间;上溢箱仅包含 41、50,阈值为开区间,数值 40 仍属于前一个区间。内部箱包含大于下界且小于等于上界的值。
指定箱的数量
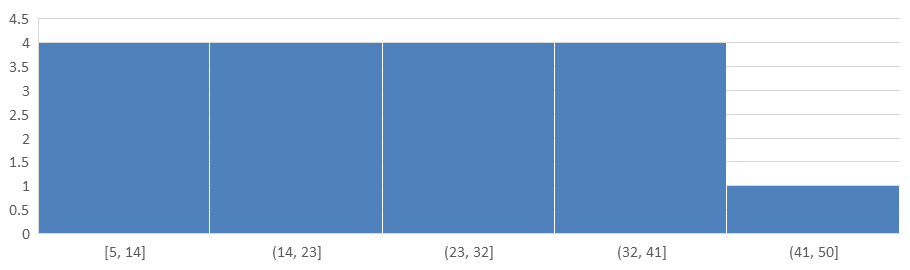
若希望固定细节层级而非固定间隔,可请求五个箱来表示相同数据。此示例禁用了下溢和上溢箱。图表根据数据范围计算箱宽,因而边界可能随报告而变。
#include <system/array.h>
#include <system/shared_ptr.h>
#include <system/object_ext.h>
#include <system/string.h>
#include <DOM/Chart/AxisAggregationType.h>
#include <DOM/Chart/ChartType.h>
#include <DOM/Chart/IAxesManager.h>
#include <DOM/Chart/IAxis.h>
#include <DOM/Chart/IChartCategoryCollection.h>
#include <DOM/Chart/IChartData.h>
#include <DOM/Chart/IChartDataCell.h>
#include <DOM/Chart/IChartDataPoint.h>
#include <DOM/Chart/IChartDataPointCollection.h>
#include <DOM/Chart/IChartDataWorkbook.h>
#include <DOM/Chart/IChartSeries.h>
#include <DOM/Chart/IChartSeriesCollection.h>
#include <DOM/Chart/IFormat.h>
#include <DOM/IChart.h>
#include <DOM/IColorFormat.h>
#include <DOM/IFillFormat.h>
#include <DOM/ILineFillFormat.h>
#include <DOM/ILineFormat.h>
#include <DOM/IShapeCollection.h>
#include <DOM/ISlide.h>
#include <DOM/Presentation.h>
#include <Export/SaveFormat.h>

using namespace System;
using namespace Aspose::Slides;
using namespace Aspose::Slides::Charts;
using namespace Aspose::Slides::Export;

auto presentation = MakeObject<Presentation>();
auto slide = presentation->get_Slide(0);

auto chart = slide->get_Shapes()->AddChart(ChartType::Histogram, 20, 20, 680, 200);

chart->set_HasLegend(false);
chart->set_HasTitle(false);

chart->get_ChartData()->get_Categories()->Clear();
chart->get_ChartData()->get_Series()->Clear();

auto workbook = chart->get_ChartData()->get_ChartDataWorkbook();
workbook->Clear(0);

auto series = chart->get_ChartData()->get_Series()->Add(ChartType::Histogram);
auto values = MakeArray<double>({ 5, 10, 10, 11, 15, 20, 20, 21, 25, 30, 30, 31, 35, 40, 40, 41, 50 });
for (auto i = 0; i < values->get_Length(); i++)
{
    auto valueCell = workbook->GetCell(0, i, 0, ObjectExt::Box(values[i]));
    series->get_DataPoints()->AddDataPointForHistogramSeries(valueCell);
}

auto axis = chart->get_Axes()->get_HorizontalAxis();
axis->set_AggregationType(AxisAggregationType::ByNumberOfBins);
axis->set_NumberOfBins(5);

presentation->Save(u"Histogram-bin-count.pptx", SaveFormat::Pptx);
这五个箱的计数分别为 4、4、4、4、1。将此分布与上述固定宽度结果进行比较:输入值相同,但边界不同。
创建雷达图
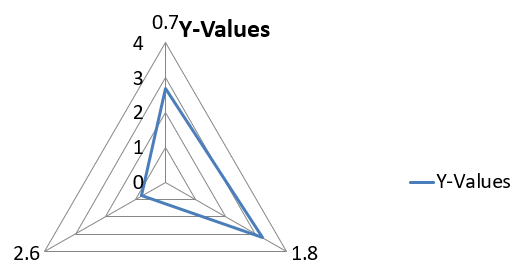
雷达图用于在二维平面上展示多变量数据,便于同时比较多个变量。它们特别适合识别多项绩效指标或属性之间的模式、优势和劣势。
此示例使用 AddChart 创建一个默认系列和类别的雷达图,然后将演示文稿另存为 PPTX。
#include <system/shared_ptr.h>
#include <DOM/Chart/ChartType.h>
#include <DOM/Chart/IChartCategoryCollection.h>
#include <DOM/Chart/IChartData.h>
#include <DOM/Chart/IChartSeriesCollection.h>
#include <DOM/Chart/IFormat.h>
#include <DOM/IChart.h>
#include <DOM/IColorFormat.h>
#include <DOM/IFillFormat.h>
#include <DOM/ILineFillFormat.h>
#include <DOM/ILineFormat.h>
#include <DOM/IShapeCollection.h>
#include <DOM/ISlide.h>
#include <DOM/Presentation.h>
#include <Export/SaveFormat.h>

using namespace System;
using namespace Aspose::Slides;
using namespace Aspose::Slides::Charts;
using namespace Aspose::Slides::Export;

auto presentation = MakeObject<Presentation>();
auto slide = presentation->get_Slide(0);

slide->get_Shapes()->AddChart(ChartType::Radar, 20, 20, 500, 300);

presentation->Save(u"Radar-chart.pptx", SaveFormat::Pptx);
结果:
创建多类别图表
多类别图表用于展示涉及多个分类分组的数据,帮助您在多个维度上同时比较数值。它们在分析复杂多层数据集的趋势和关系时尤为有用。
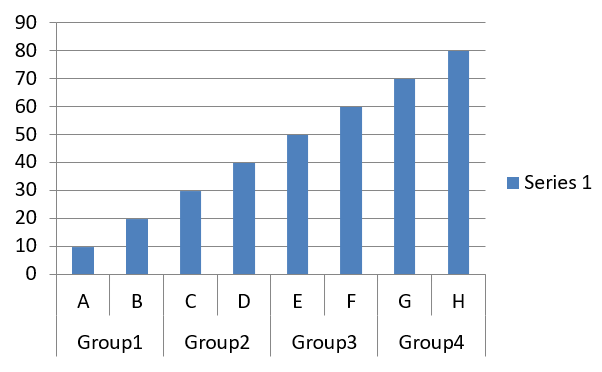
此示例创建了一个簇状柱形图,其中八个类别按四对排列。SetGroupingItem 方法在分组级别 1 为每对分配共享标签,从而在类别轴上同时显示单独标签和分组标签。
#include <system/shared_ptr.h>
#include <system/object_ext.h>
#include <system/string.h>
#include <DOM/Chart/ChartType.h>
#include <DOM/Chart/IChartCategory.h>
#include <DOM/Chart/IChartCategoryCollection.h>
#include <DOM/Chart/IChartCategoryLevelsManager.h>
#include <DOM/Chart/IChartData.h>
#include <DOM/Chart/IChartDataCell.h>
#include <DOM/Chart/IChartDataPoint.h>
#include <DOM/Chart/IChartDataPointCollection.h>
#include <DOM/Chart/IChartDataWorkbook.h>
#include <DOM/Chart/IChartSeries.h>
#include <DOM/Chart/IChartSeriesCollection.h>
#include <DOM/Chart/IFormat.h>
#include <DOM/IChart.h>
#include <DOM/IColorFormat.h>
#include <DOM/IFillFormat.h>
#include <DOM/ILineFillFormat.h>
#include <DOM/ILineFormat.h>
#include <DOM/IShapeCollection.h>
#include <DOM/ISlide.h>
#include <DOM/Presentation.h>
#include <Export/SaveFormat.h>

using namespace System;
using namespace Aspose::Slides;
using namespace Aspose::Slides::Charts;
using namespace Aspose::Slides::Export;

auto presentation = MakeObject<Presentation>();
auto slide = presentation->get_Slide(0);

auto chart = slide->get_Shapes()->AddChart(ChartType::ClusteredColumn, 20, 20, 500, 300);

chart->get_ChartData()->get_Series()->Clear();
chart->get_ChartData()->get_Categories()->Clear();

auto workbook = chart->get_ChartData()->get_ChartDataWorkbook();
workbook->Clear(0);

auto worksheetIndex = 0;

auto categoryCell = workbook->GetCell(0, u"c2", ObjectExt::Box(String(u"A")));
auto category = chart->get_ChartData()->get_Categories()->Add(categoryCell);
category->get_GroupingLevels()->SetGroupingItem(1, ObjectExt::Box(String(u"Group1")));
categoryCell = workbook->GetCell(0, u"c3", ObjectExt::Box(String(u"B")));
category = chart->get_ChartData()->get_Categories()->Add(categoryCell);

categoryCell = workbook->GetCell(0, u"c4", ObjectExt::Box(String(u"C")));
category = chart->get_ChartData()->get_Categories()->Add(categoryCell);
category->get_GroupingLevels()->SetGroupingItem(1, ObjectExt::Box(String(u"Group2")));
categoryCell = workbook->GetCell(0, u"c5", ObjectExt::Box(String(u"D")));
category = chart->get_ChartData()->get_Categories()->Add(categoryCell);

categoryCell = workbook->GetCell(0, u"c6", ObjectExt::Box(String(u"E")));
category = chart->get_ChartData()->get_Categories()->Add(categoryCell);
category->get_GroupingLevels()->SetGroupingItem(1, ObjectExt::Box(String(u"Group3")));
categoryCell = workbook->GetCell(0, u"c7", ObjectExt::Box(String(u"F")));
category = chart->get_ChartData()->get_Categories()->Add(categoryCell);

categoryCell = workbook->GetCell(0, u"c8", ObjectExt::Box(String(u"G")));
category = chart->get_ChartData()->get_Categories()->Add(categoryCell);
category->get_GroupingLevels()->SetGroupingItem(1, ObjectExt::Box(String(u"Group4")));
categoryCell = workbook->GetCell(0, u"c9", ObjectExt::Box(String(u"H")));
category = chart->get_ChartData()->get_Categories()->Add(categoryCell);

auto seriesNameCell = workbook->GetCell(0, u"D1", ObjectExt::Box(String(u"Series 1")));
auto series = chart->get_ChartData()->get_Series()->Add(seriesNameCell, ChartType::ClusteredColumn);

auto valueCell = workbook->GetCell(worksheetIndex, u"D2", ObjectExt::Box(10));
series->get_DataPoints()->AddDataPointForBarSeries(valueCell);
valueCell = workbook->GetCell(worksheetIndex, u"D3", ObjectExt::Box(20));
series->get_DataPoints()->AddDataPointForBarSeries(valueCell);
valueCell = workbook->GetCell(worksheetIndex, u"D4", ObjectExt::Box(30));
series->get_DataPoints()->AddDataPointForBarSeries(valueCell);
valueCell = workbook->GetCell(worksheetIndex, u"D5", ObjectExt::Box(40));
series->get_DataPoints()->AddDataPointForBarSeries(valueCell);
valueCell = workbook->GetCell(worksheetIndex, u"D6", ObjectExt::Box(50));
series->get_DataPoints()->AddDataPointForBarSeries(valueCell);
valueCell = workbook->GetCell(worksheetIndex, u"D7", ObjectExt::Box(60));
series->get_DataPoints()->AddDataPointForBarSeries(valueCell);
valueCell = workbook->GetCell(worksheetIndex, u"D8", ObjectExt::Box(70));
series->get_DataPoints()->AddDataPointForBarSeries(valueCell);
valueCell = workbook->GetCell(worksheetIndex, u"D9", ObjectExt::Box(80));
series->get_DataPoints()->AddDataPointForBarSeries(valueCell);

presentation->Save(u"AsposeChart.pptx", SaveFormat::Pptx);
结果:
创建地图图表
地图图表用于通过将信息映射到特定位置(如国家、州或城市)来可视化地理数据。它们在分析区域趋势、人口统计数据和空间分布时非常有用,能够以直观、生动的方式呈现。
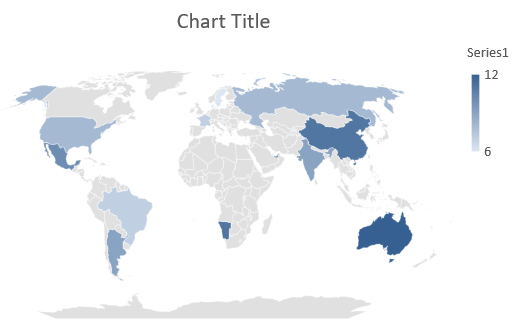
此示例使用 AddChart 创建一个默认地理数据的地图图表,并将其保存以便在 PowerPoint 中查看。
#include <system/shared_ptr.h>
#include <DOM/Chart/ChartType.h>
#include <DOM/Chart/IChartCategoryCollection.h>
#include <DOM/Chart/IChartData.h>
#include <DOM/Chart/IChartSeriesCollection.h>
#include <DOM/Chart/IFormat.h>
#include <DOM/IChart.h>
#include <DOM/IColorFormat.h>
#include <DOM/IFillFormat.h>
#include <DOM/ILineFillFormat.h>
#include <DOM/ILineFormat.h>
#include <DOM/IShapeCollection>
#include <DOM/ISlide.h>
#include <DOM/Presentation.h>
#include <Export/SaveFormat.h>

using namespace System;
using namespace Aspose::Slides;
using namespace Aspose::Slides::Charts;
using namespace Aspose::Slides::Export;

auto presentation = MakeObject<Presentation>();
auto slide = presentation->get_Slide(0);

auto chart = slide->get_Shapes()->AddChart(ChartType::Map, 20, 20, 500, 300);

presentation->Save(u"mapChart.pptx", SaveFormat::Pptx);
结果:
Note
上图展示了在 PowerPoint 中打开的已保存演示文稿。Aspose.Slides 正确写入了地图图表及其数据,但自身并不绘制地图图表:当包含地图图表的幻灯片渲染为图像或转换为 PDF、SVG 时,图表区域会为空白。同一幻灯片上的其他形状不受影响。创建组合图表
组合图表(或 Combo 图表)在同一坐标系中融合两种或更多图表类型。该图表可帮助您突出、比较或检查多个数据集之间的差异,从而识别它们之间的关联。

此示例将两个簇状柱形系列与一个折线系列在四个类别上进行组合。柱形使用主垂直坐标轴,而 set_PlotOnSecondAxis 将折线放置在右侧的次坐标轴上。辅助函数负责配置标题、图例、坐标轴标签和网格线。
#include <DOM/Chart/IChartLinesFormat.h>
#include <DOM/Chart/IChartPortionFormat.h>
#include <DOM/Chart/IAxisFormat.h>
#include <system/shared_ptr.h>
#include <system/object_ext.h>
#include <system/string.h>
#include <drawing/color.h>
#include <DOM/Chart/AxisPositionType.h>
#include <DOM/Chart/ChartType.h>
#include <DOM/Chart/CrossesType.h>
#include <DOM/Chart/IAxesManager.h>
#include <DOM/Chart/IAxis.h>
#include <DOM/Chart/IChartCategoryCollection.h>
#include <DOM/Chart/IChartData.h>
#include <DOM/Chart/IChartDataCell.h>
#include <DOM/Chart/IChartDataPoint.h>
#include <DOM/Chart/IChartDataPointCollection.h>
#include <DOM/Chart/IChartDataWorkbook.h>
#include <DOM/Chart/IChartSeries.h>
#include <DOM/Chart/IChartSeriesCollection.h>
#include <DOM/Chart/IChartSeriesGroup.h>
#include <DOM/Chart/IChartSeriesGroupCollection.h>
#include <DOM/Chart/IChartTextFormat.h>
#include <DOM/Chart/IChartTitle.h>
#include <DOM/Chart/IFormat.h>
#include <DOM/Chart/ILegend.h>
#include <DOM/Chart/LegendPositionType.h>
#include <DOM/FillType.h>
#include <DOM/IChart.h>
#include <DOM/IColorFormat.h>
#include <DOM/IFillFormat.h>
#include <DOM/ILineFillFormat.h>
#include <DOM/ILineFormat.h>
#include <DOM/IParagraph.h>
#include <DOM/IParagraphCollection.h>
#include <DOM/IParagraphFormat.h>
#include <DOM/IPortionFormat.h>
#include <DOM/IShapeCollection.h>
#include <DOM/ISlide.h>
#include <DOM/ITextFrame.h>
#include <DOM/ITextFrameFormat.h>
#include <DOM/NullableBool.h>
#include <DOM/Presentation.h>
#include <Export/SaveFormat.h>

using namespace System;
using namespace System::Drawing;
using namespace Aspose::Slides;
using namespace Aspose::Slides::Charts;
using namespace Aspose::Slides::Export;

struct ComboChartExample
{
    static void CreateComboChart()
    {
        auto presentation = MakeObject<Presentation>();
        auto chart = CreateChartWithFirstSeries(presentation->get_Slide(0));

        AddSecondSeriesToChart(chart);
        AddThirdSeriesToChart(chart);

        SetPrimaryAxesFormat(chart);
        SetSecondaryAxesFormat(chart);

        presentation->Save(u"combo-chart.pptx", SaveFormat::Pptx);
    }

    static SharedPtr<IChart> CreateChartWithFirstSeries(SharedPtr<ISlide> slide)
    {
        auto chart = slide->get_Shapes()->AddChart(ChartType::ClusteredColumn, 50, 50, 600, 400);

        chart->set_HasTitle(true);
        chart->get_ChartTitle()->AddTextFrameForOverriding(u"Chart Title");
        chart->get_ChartTitle()->set_Overlay(false);
        auto portionFormat = chart->get_ChartTitle()->get_TextFrameForOverriding()->get_Paragraphs()->idx_get(0)->get_ParagraphFormat()->get_DefaultPortionFormat();
        portionFormat->set_FontBold(NullableBool::False);
        portionFormat->set_FontHeight(18.0f);

        chart->get_Legend()->set_Position(LegendPositionType::Bottom);
        chart->get_Legend()->get_TextFormat()->get_PortionFormat()->set_FontHeight(12.0f);

        chart->get_ChartData()->get_Series()->Clear();
        chart->get_ChartData()->get_Categories()->Clear();

        auto workbook = chart->get_ChartData()->get_ChartDataWorkbook();
        auto worksheetIndex = 0;

        auto categoryCell = workbook->GetCell(worksheetIndex, 1, 0, ObjectExt::Box(String(u"Category 1")));
        chart->get_ChartData()->get_Categories()->Add(categoryCell);
        categoryCell = workbook->GetCell(worksheetIndex, 2, 0, ObjectExt::Box(String(u"Category 2")));
        chart->get_ChartData()->get_Categories()->Add(categoryCell);
        categoryCell = workbook->GetCell(worksheetIndex, 3, 0, ObjectExt::Box(String(u"Category 3")));
        chart->get_ChartData()->get_Categories()->Add(categoryCell);
        categoryCell = workbook->GetCell(worksheetIndex, 4, 0, ObjectExt::Box(String(u"Category 4")));
        chart->get_ChartData()->get_Categories()->Add(categoryCell);

        auto seriesNameCell = workbook->GetCell(worksheetIndex, 0, 1, ObjectExt::Box(String(u"Series 1")));
        auto series = chart->get_ChartData()->get_Series()->Add(seriesNameCell, chart->get_Type());

        series->get_ParentSeriesGroup()->set_Overlap(-25);
        series->get_ParentSeriesGroup()->set_GapWidth(220);

        auto valueCell = workbook->GetCell(worksheetIndex, 1, 1, ObjectExt::Box(4.3));
        series->get_DataPoints()->AddDataPointForBarSeries(valueCell);
        valueCell = workbook->GetCell(worksheetIndex, 2, 1, ObjectExt::Box(2.5));
        series->get_DataPoints()->AddDataPointForBarSeries(valueCell);
        valueCell = workbook->GetCell(worksheetIndex, 3, 1, ObjectExt::Box(3.5));
        series->get_DataPoints()->AddDataPointForBarSeries(valueCell);
        valueCell = workbook->GetCell(worksheetIndex, 4, 1, ObjectExt::Box(4.5));
        series->get_DataPoints()->AddDataPointForBarSeries(valueCell);

        return chart;
    }

    static void AddSecondSeriesToChart(SharedPtr<IChart> chart)
    {
        auto workbook = chart->get_ChartData()->get_ChartDataWorkbook();
        const int worksheetIndex = 0;

        auto seriesNameCell = workbook->GetCell(worksheetIndex, 0, 2, ObjectExt::Box(String(u"Series 2")));
        auto series = chart->get_ChartData()->get_Series()->Add(seriesNameCell, ChartType::ClusteredColumn);

        series->get_ParentSeriesGroup()->set_Overlap(-25);
        series->get_ParentSeriesGroup()->set_GapWidth(220);

        auto valueCell = workbook->GetCell(worksheetIndex, 1, 2, ObjectExt::Box(2.4));
        series->get_DataPoints()->AddDataPointForBarSeries(valueCell);
        valueCell = workbook->GetCell(worksheetIndex, 2, 2, ObjectExt::Box(4.4));
        series->get_DataPoints()->AddDataPointForBarSeries(valueCell);
        valueCell = workbook->GetCell(worksheetIndex, 3, 2, ObjectExt::Box(1.8));
        series->get_DataPoints()->AddDataPointForBarSeries(valueCell);
        valueCell = workbook->GetCell(worksheetIndex, 4, 2, ObjectExt::Box(2.8));
        series->get_DataPoints()->AddDataPointForBarSeries(valueCell);
    }

    static void AddThirdSeriesToChart(SharedPtr<IChart> chart)
    {
        auto workbook = chart->get_ChartData()->get_ChartDataWorkbook();
        const int worksheetIndex = 0;

        auto seriesNameCell = workbook->GetCell(worksheetIndex, 0, 3, ObjectExt::Box(String(u"Series 3")));
        auto series = chart->get_ChartData()->get_Series()->Add(seriesNameCell, ChartType::Line);

        auto valueCell = workbook->GetCell(worksheetIndex, 1, 3, ObjectExt::Box(2.0));
        series->get_DataPoints()->AddDataPointForLineSeries(valueCell);
        valueCell = workbook->GetCell(worksheetIndex, 2, 3, ObjectExt::Box(2.0));
        series->get_DataPoints()->AddDataPointForLineSeries(valueCell);
        valueCell = workbook->GetCell(worksheetIndex, 3, 3, ObjectExt::Box(3.0));
        series->get_DataPoints()->AddDataPointForLineSeries(valueCell);
        valueCell = workbook->GetCell(worksheetIndex, 4, 3, ObjectExt::Box(5.0));
        series->get_DataPoints()->AddDataPointForLineSeries(valueCell);

        series->set_PlotOnSecondAxis(true);
    }

    static void SetPrimaryAxesFormat(SharedPtr<IChart> chart)
    {
        auto horizontalAxis = chart->get_Axes()->get_HorizontalAxis();
        horizontalAxis->get_TextFormat()->get_PortionFormat()->set_FontHeight(12.0f);
        horizontalAxis->get_Format()->get_Line()->get_FillFormat()->set_FillType(FillType::NoFill);

        SetAxisTitle(horizontalAxis, u"X Axis");

        auto verticalAxis = chart->get_Axes()->get_VerticalAxis();
        verticalAxis->get_TextFormat()->get_PortionFormat()->set_FontHeight(12.0f);
        verticalAxis->get_Format()->get_Line()->get_FillFormat()->set_FillType(FillType::NoFill);

        SetAxisTitle(verticalAxis, u"Y Axis 1");

        auto majorGridLinesFormat = verticalAxis->get_MajorGridLinesFormat()->get_Line()->get_FillFormat();
        majorGridLinesFormat->set_FillType(FillType::Solid);
        majorGridLinesFormat->get_SolidFillColor()->set_Color(Color::FromArgb(217, 217, 217));
    }

    static void SetSecondaryAxesFormat(SharedPtr<IChart> chart)
    {
        auto secondaryHorizontalAxis = chart->get_Axes()->get_SecondaryHorizontalAxis();
        secondaryHorizontalAxis->set_Position(AxisPositionType::Bottom);
        secondaryHorizontalAxis->set_CrossType(CrossesType::Maximum);
        secondaryHorizontalAxis->set_IsVisible(false);
        secondaryHorizontalAxis->get_MajorGridLinesFormat()->get_Line()->get_FillFormat()->set_FillType(FillType::NoFill);
        secondaryHorizontalAxis->get_MinorGridLinesFormat()->get_Line()->get_FillFormat()->set_FillType(FillType::NoFill);

        auto secondaryVerticalAxis = chart->get_Axes()->get_SecondaryVerticalAxis();
        secondaryVerticalAxis->set_Position(AxisPositionType::Right);
        secondaryVerticalAxis->get_TextFormat()->get_PortionFormat()->set_FontHeight(12.0f);
        secondaryVerticalAxis->get_Format()->get_Line()->get_FillFormat()->set_FillType(FillType::NoFill);
        secondaryVerticalAxis->get_MajorGridLinesFormat()->get_Line()->get_FillFormat()->set_FillType(FillType::NoFill);
        secondaryVerticalAxis->get_MinorGridLinesFormat()->get_Line()->get_FillFormat()->set_FillType(FillType::NoFill);

        SetAxisTitle(secondaryVerticalAxis, u"Y Axis 2");
    }

    static void SetAxisTitle(SharedPtr<IAxis> axis, String axisTitle)
    {
        axis->set_HasTitle(true);
        axis->get_Title()->set_Overlay(false);
        auto titlePortionFormat = axis->get_Title()->AddTextFrameForOverriding(axisTitle)->get_Paragraphs()->idx_get(0)->get_ParagraphFormat()->get_DefaultPortionFormat();
        titlePortionFormat->set_FontBold(NullableBool::False);
        titlePortionFormat->set_FontHeight(12.0f);
    }
};

ComboChartExample::CreateComboChart();
更新图表
Aspose.Slides for C++ 使您能够通过修改图表数据、格式和样式来更新 PowerPoint 图表。此功能简化了保持演示文稿与动态内容同步的过程,确保图表准确反映当前数据和视觉标准。
此示例更新现有演示文稿第一张幻灯片中名为 “My chart” 的图表。它需要两个系列、每个系列三个数据点,类别标签位于列 A,系列名称位于工作表第一行。示例使用 GetCell 更改工作簿单元格,更新系列值,添加第三个系列,并通过 set_Type 将图表类型改为簇状圆柱体。
#include <system/shared_ptr.h>
#include <system/object_ext.h>
#include <system/string.h>
#include <DOM/Chart/ChartType.h>
#include <DOM/Chart/IChartCategoryCollection.h>
#include <DOM/Chart/IChartData.h>
#include <DOM/Chart/IChartDataCell.h>
#include <DOM/Chart/IChartDataPoint.h>
#include <DOM/Chart/IChartDataPointCollection.h>
#include <DOM/Chart/IChartDataWorkbook.h>
#include <DOM/Chart/IChartSeries.h>
#include <DOM/Chart/IChartSeriesCollection.h>
#include <DOM/Chart/IDoubleChartValue.h>
#include <DOM/Chart/IFormat.h>
#include <DOM/IChart.h>
#include <DOM/IColorFormat.h>
#include <DOM/IFillFormat.h>
#include <DOM/ILineFillFormat.h>
#include <DOM/ILineFormat.h>
#include <DOM/IShape.h>
#include <DOM/IShapeCollection.h>
#include <DOM/ISlide.h>
#include <DOM/Presentation.h>
#include <Export/SaveFormat.h>

using namespace System;
using namespace Aspose::Slides;
using namespace Aspose::Slides::Charts;
using namespace Aspose::Slides::Export;

const String chartName = u"My chart";

auto presentation = MakeObject<Presentation>(u"ExistingChart.pptx");
auto slide = presentation->get_Slide(0);

for (auto shape : slide->get_Shapes())
{
    auto chart = System::DynamicCast<IChart>(shape);
    if (chart != nullptr && chart->get_Name() == chartName)
    {
        auto worksheetIndex = 0;

        auto workbook = chart->get_ChartData()->get_ChartDataWorkbook();

        workbook->GetCell(worksheetIndex, 1, 0, ObjectExt::Box(String(u"Modified Category 1")));
        workbook->GetCell(worksheetIndex, 2, 0, ObjectExt::Box(String(u"Modified Category 2")));

        auto series = chart->get_ChartData()->get_Series()->idx_get(0);

        workbook->GetCell(worksheetIndex, 0, 1, ObjectExt::Box(String(u"New_Series 1")));
        series->get_DataPoints()->idx_get(0)->get_Value()->set_Data(ObjectExt::Box(90));
        series->get_DataPoints()->idx_get(1)->get_Value()->set_Data(ObjectExt::Box(123));
        series->get_DataPoints()->idx_get(2)->get_Value()->set_Data(ObjectExt::Box(44));

        series = chart->get_ChartData()->get_Series()->idx_get(1);

        workbook->GetCell(worksheetIndex, 0, 2, ObjectExt::Box(String(u"New_Series 2")));
        series->get_DataPoints()->idx_get(0)->get_Value()->set_Data(ObjectExt::Box(23));
        series->get_DataPoints()->idx_get(1)->get_Value()->set_Data(ObjectExt::Box(67));
        series->get_DataPoints()->idx_get(2)->get_Value()->set_Data(ObjectExt::Box(99));

        auto seriesNameCell = workbook->GetCell(worksheetIndex, 0, 3, ObjectExt::Box(String(u"Series 3")));
        series = chart->get_ChartData()->get_Series()->Add(seriesNameCell, chart->get_Type());

        auto valueCell = workbook->GetCell(worksheetIndex, 1, 3, ObjectExt::Box(20));
        series->get_DataPoints()->AddDataPointForBarSeries(valueCell);
        valueCell = workbook->GetCell(worksheetIndex, 2, 3, ObjectExt::Box(50));
        series->get_DataPoints()->AddDataPointForBarSeries(valueCell);
        valueCell = workbook->GetCell(worksheetIndex, 3, 3, ObjectExt::Box(30));
        series->get_DataPoints()->AddDataPointForBarSeries(valueCell);

        chart->set_Type(ChartType::ClusteredCylinder);
    }
}

presentation->Save(u"AsposeChartModified.pptx", SaveFormat::Pptx);
为图表设置数据范围
要查看现有图表已使用的范围,请参阅 Retrieve a Chart’s Data Range。
Aspose.Slides for C++ 提供将工作表中指定数据范围设为图表数据源的灵活性。这意味着您可以直接映射工作表的某一部分到图表,从而控制哪些单元格贡献给图表的系列和类别。这样,您可以轻松更新并同步图表与工作表中的最新数据,更好地保证演示文稿信息的时效性和准确性。
此示例使用 SetRange 将现有演示文稿第一张幻灯片中名为 “My chart” 的图表的数据源设置为 Sheet1!A1:B4。图表工作簿必须包含该工作表,并且该范围需包含第一行的系列标题、列 A 的类别标签以及列 B 的三个数值。
#include <system/shared_ptr.h>
#include <DOM/Chart/ChartType.h>
#include <DOM/Chart/IChartCategoryCollection.h>
#include <DOM/Chart/IChartData.h>
#include <DOM/Chart/IChartSeriesCollection.h>
#include <DOM/Chart/IFormat.h>
#include <DOM/IChart.h>
#include <DOM/IColorFormat.h>
#include <DOM/IFillFormat.h>
#include <DOM/ILineFillFormat.h>
#include <DOM/ILineFormat.h>
#include <DOM/IShape.h>
#include <DOM/IShapeCollection>
#include <DOM/ISlide.h>
#include <DOM/Presentation.h>
#include <Export/SaveFormat.h>

using namespace System;
using namespace Aspose::Slides;
using namespace Aspose::Slides::Charts;
using namespace Aspose::Slides::Export;

const String chartName = u"My chart";

auto  presentation  = MakeObject<Presentation>(u"ExistingChart.pptx");
auto  slide  = presentation->get_Slide(0);

for  (auto shape : slide->get_Shapes())
{
    auto chart = System::DynamicCast<IChart>(shape);
    if (chart != nullptr && chart->get_Name() == chartName)
    {
        chart->get_ChartData()->SetRange(u"Sheet1!A1:B4");
    }
}

presentation->Save(u"SetDataRange.pptx", Save Format :: Ppt x  );
在图表中使用默认标记
在图表中使用默认标记时,每个系列会自动分配不同的默认标记符号。
此示例使用 AddChart 创建一个包含两条折线系列和图例的图表。get_Marker 设置保留了自动分配的标记符号。第一系列包含一个负值和一个缺失值(用 nullptr 表示),第二系列则为每个类别提供了数值。
#include <system/shared_ptr.h>
#include <system/object_ext.h>
#include <system/string.h>
#include <DOM/Chart/ChartType.h>
#include <DOM/Chart/IChartCategoryCollection.h>
#include <DOM/Chart/IChartData.h>
#include <DOM/Chart/IChartDataCell.h>
#include <DOM/Chart/IChartDataPoint.h>
#include <DOM/Chart/IChartDataPointCollection.h>
#include <DOM/Chart/IChartDataWorkbook.h>
#include <DOM/Chart/IChartSeries.h>
#include <DOM/Chart/IChartSeriesCollection.h>
#include <DOM/Chart/IChartTextFormat.h>
#include <DOM/Chart/IFormat.h>
#include <DOM/Chart/ILegend.h>
#include <DOM/Chart/IMarker.h>
#include <DOM/IChart.h>
#include <DOM/IColorFormat.h>
#include <DOM/IFillFormat.h>
#include <DOM/ILineFillFormat.h>
#include <DOM/ILineFormat.h>
#include <DOM/IPortionFormat.h>
#include <DOM/IShapeCollection.h>
#include <DOM/ISlide.h>
#include <DOM/Presentation.h>
#include <Export/SaveFormat.h>

using namespace System;
using namespace Aspose::Slides;
using namespace Aspose::Slides::Charts;
using namespace Aspose::Slides::Export;

auto presentation = MakeObject<Presentation>();
auto slide = presentation->get_Slide(0);

auto chart = slide->get_Shapes()->AddChart(ChartType::LineWithMarkers, 10, 10, 400, 400);

chart->get_ChartData()->get_Series()->Clear();
chart->get_ChartData()->get_Categories()->Clear();

auto workbook = chart->get_ChartData()->get_ChartDataWorkbook();

auto seriesNameCell = workbook->GetCell(0, 0, 1, ObjectExt::Box(String(u"Series 1")));
auto series = chart->get_ChartData()->get_Series()->Add(seriesNameCell, chart->get_Type());

auto categoryCell = workbook->GetCell(0, 1, 0, ObjectExt::Box(String(u"C1")));
chart->get_ChartData()->get_Categories()->Add(categoryCell);
auto valueCell = workbook->GetCell(0, 1, 1, ObjectExt::Box(24));
series->get_DataPoints()->AddDataPointForLineSeries(valueCell);

categoryCell = workbook->GetCell(0, 2, 0, ObjectExt::Box(String(u"C2")));
chart->get_ChartData()->get_Categories()->Add(categoryCell);
valueCell = workbook->GetCell(0, 2, 1, ObjectExt::Box(23));
series->get_DataPoints()->AddDataPointForLineSeries(valueCell);

categoryCell = workbook->GetCell(0, 3, 0, ObjectExt::Box(String(u"C3")));
chart->get_ChartData()->get_Categories()->Add(categoryCell);
valueCell = workbook->GetCell(0, 3, 1, ObjectExt::Box(-10));
series->get_DataPoints()->AddDataPointForLineSeries(valueCell);

categoryCell = workbook->GetCell(0, 4, 0, ObjectExt::Box(String(u"C4")));
chart->get_ChartData()->get_Categories()->Add(categoryCell);
valueCell = workbook->GetCell(0, 4, 1, nullptr);
series->get_DataPoints()->AddDataPointForLineSeries(valueCell);

seriesNameCell = workbook->GetCell(0, 0, 2, ObjectExt::Box(String(u"Series 2")));
auto secondSeries = chart->get_ChartData()->get_Series()->Add(seriesNameCell, chart->get_Type());

valueCell = workbook->GetCell(0, 1, 2, ObjectExt::Box(30));
secondSeries->get_DataPoints()->AddDataPointForLineSeries(valueCell);
valueCell = workbook->GetCell(0, 2, 2, ObjectExt::Box(10));
secondSeries->get_DataPoints()->AddDataPointForLineSeries(valueCell);
valueCell = workbook->GetCell(0, 3, 2, ObjectExt::Box(60));
secondSeries->get_DataPoints()->AddDataPointForLineSeries(valueCell);
valueCell = workbook->GetCell(0, 4, 2, ObjectExt::Box(40));
secondSeries->get_DataPoints()->AddDataPointForLineSeries(valueCell);

chart->set_HasLegend(true);
chart->get_Legend()->set_Overlay(false);

presentation->Save(u"DefaultMarkersInChart.pptx", SaveFormat::Pptx);
常见问答
Aspose.Slides for C++ 支持哪些图表类型?
Aspose.Slides for C++ 支持包括柱形图、折线图、饼图、面积图、散点图、直方图、雷达图等在内的多种图表类型。此灵活性让您能够根据数据可视化需求选择最合适的图表。
如何向幻灯片添加新图表?
要添加图表,首先实例化 Presentation 类,使用索引获取目标幻灯片,然后调用添加图表的方法,指定图表类型和初始数据。此过程可将图表直接嵌入演示文稿。
如何更新图表中显示的数据?
您可以通过访问图表的数据工作簿 (IChartDataWorkbook),清除默认的系列和类别,然后添加自定义数据,以程序化方式刷新图表,反映最新数据。
是否可以自定义图表的外观?
可以,Aspose.Slides for C++ 提供丰富的自定义选项。您可以修改颜色、字体、标签、图例以及其他格式元素,以满足特定的设计需求。