
Crea o aggiorna i grafici delle presentazioni PowerPoint in C++
Panoramica
Questo articolo fornisce una guida completa su come creare e personalizzare i grafici utilizzando Aspose.Slides per C++. Imparerai come aggiungere programmaticamente un grafico a una diapositiva, popolarlo con i dati e applicare varie opzioni di formattazione per soddisfare i tuoi requisiti di progettazione specifici. Durante l’articolo, esempi di codice dettagliati illustrano ogni passaggio, dall’inizializzazione della presentazione e dell’oggetto grafico alla configurazione di serie, assi e legende. Seguendo questa guida, otterrai una solida comprensione di come integrare la generazione dinamica di grafici nelle tue applicazioni C++, semplificando il processo di creazione di presentazioni basate sui dati.
Crea un grafico
I grafici aiutano le persone a visualizzare rapidamente i dati e a ottenere approfondimenti che potrebbero non essere immediatamente evidenti da una tabella o da un foglio di calcolo.
Perché creare grafici?
- aggregare, condensare o riassumere grandi quantità di dati in una singola diapositiva di una presentazione;
- rivelare schemi e tendenze nei dati;
- dedurre la direzione e il dinamismo dei dati nel tempo o rispetto a un’unità di misura specifica;
- identificare valori anomali, aberrazioni, deviazioni, errori e dati senza senso;
- comunicare o presentare dati complessi.
In PowerPoint, puoi creare grafici tramite la funzione Inserisci, che fornisce modelli per progettare molti tipi di grafici. Utilizzando Aspose.Slides, puoi creare sia grafici regolari (basati su tipi di grafico popolari) sia grafici personalizzati.
Note
Utilizza l’enumerazione ChartType nello spazio dei nomi Aspose::Slides::Charts. I valori in questa enumerazione corrispondono a diversi tipi di grafico.Crea grafici a colonne raggruppate
Questo esempio utilizza AddChart per creare un grafico a colonne raggruppate che confronta due serie su tre categorie. Le serie utilizzano riempimenti rosso e verde, e le etichette individuali mostrano i nomi delle categorie, i nomi delle serie e i valori. L’indice del foglio di lavoro 0 si riferisce al primo foglio nella cartella di lavoro del grafico incorporata.
#include <system/shared_ptr.h>
#include <system/object_ext.h>
#include <system/string.h>
#include <drawing/color.h>
#include <DOM/Chart/ChartType.h>
#include <DOM/Chart/IChartCategoryCollection.h>
#include <DOM/Chart/IChartData.h>
#include <DOM/Chart/IChartDataCell.h>
#include <DOM/Chart/IChartDataPoint.h>
#include <DOM/Chart/IChartDataPointCollection.h>
#include <DOM/Chart/IChartDataWorkbook.h>
#include <DOM/Chart/IChartSeries.h>
#include <DOM/Chart/IChartSeriesCollection.h>
#include <DOM/Chart/IChartTitle.h>
#include <DOM/Chart/IDataLabel.h>
#include <DOM/Chart/IDataLabelCollection.h>
#include <DOM/Chart/IDataLabelFormat.h>
#include <DOM/Chart/IDoubleChartValue.h>
#include <DOM/Chart/IFormat.h>
#include <DOM/FillType.h>
#include <DOM/IChart.h>
#include <DOM/IColorFormat.h>
#include <DOM/IFillFormat.h>
#include <DOM/ILineFillFormat.h>
#include <DOM/ILineFormat.h>
#include <DOM/IShapeCollection.h>
#include <DOM/ISlide.h>
#include <DOM/ITextFrame.h>
#include <DOM/ITextFrameFormat.h>
#include <DOM/NullableBool.h>
#include <DOM/Presentation.h>
#include <Export/SaveFormat.h>

using namespace System;
using namespace System::Drawing;
using namespace Aspose::Slides;
using namespace Aspose::Slides::Charts;
using namespace Aspose::Slides::Export;

auto presentation = MakeObject<Presentation>();
auto slide = presentation->get_Slide(0);

auto chart = slide->get_Shapes()->AddChart(ChartType::ClusteredColumn, 20, 20, 500, 300);

chart->get_ChartTitle()->AddTextFrameForOverriding(u"Sample Title");
chart->get_ChartTitle()->get_TextFrameForOverriding()->get_TextFrameFormat()->set_CenterText(NullableBool::True);
chart->get_ChartTitle()->set_Height(20);
chart->set_HasTitle(true);

auto workbook = chart->get_ChartData()->get_ChartDataWorkbook();
auto worksheetIndex = 0;

chart->get_ChartData()->get_Series()->Clear();
chart->get_ChartData()->get_Categories()->Clear();

auto seriesNameCell = workbook->GetCell(worksheetIndex, 0, 1, ObjectExt::Box(String(u"Series 1")));
chart->get_ChartData()->get_Series()->Add(seriesNameCell, chart->get_Type());
seriesNameCell = workbook->GetCell(worksheetIndex, 0, 2, ObjectExt::Box(String(u"Series 2")));
chart->get_ChartData()->get_Series()->Add(seriesNameCell, chart->get_Type());

auto categoryCell = workbook->GetCell(worksheetIndex, 1, 0, ObjectExt::Box(String(u"Category 1")));
chart->get_ChartData()->get_Categories()->Add(categoryCell);
categoryCell = workbook->GetCell(worksheetIndex, 2, 0, ObjectExt::Box(String(u"Category 2")));
chart->get_ChartData()->get_Categories()->Add(categoryCell);
categoryCell = workbook->GetCell(worksheetIndex, 3, 0, ObjectExt::Box(String(u"Category 3")));
chart->get_ChartData()->get_Categories()->Add(categoryCell);

auto series = chart->get_ChartData()->get_Series()->idx_get(0);

auto valueCell = workbook->GetCell(worksheetIndex, 1, 1, ObjectExt::Box(20));
series->get_DataPoints()->AddDataPointForBarSeries(valueCell);
valueCell = workbook->GetCell(worksheetIndex, 2, 1, ObjectExt::Box(50));
series->get_DataPoints()->AddDataPointForBarSeries(valueCell);
valueCell = workbook->GetCell(worksheetIndex, 3, 1, ObjectExt::Box(30));
series->get_DataPoints()->AddDataPointForBarSeries(valueCell);

series->get_Format()->get_Fill()->set_FillType(FillType::Solid);
series->get_Format()->get_Fill()->get_SolidFillColor()->set_Color(Color::get_Red());

series = chart->get_ChartData()->get_Series()->idx_get(1);

valueCell = workbook->GetCell(worksheetIndex, 1, 2, ObjectExt::Box(30));
series->get_DataPoints()->AddDataPointForBarSeries(valueCell);
valueCell = workbook->GetCell(worksheetIndex, 2, 2, ObjectExt::Box(10));
series->get_DataPoints()->AddDataPointForBarSeries(valueCell);
valueCell = workbook->GetCell(worksheetIndex, 3, 2, ObjectExt::Box(60));
series->get_DataPoints()->AddDataPointForBarSeries(valueCell);

series->get_Format()->get_Fill()->set_FillType(FillType::Solid);
series->get_Format()->get_Fill()->get_SolidFillColor()->set_Color(Color::get_Green());

auto label = series->get_DataPoints()->idx_get(0)->get_Label();
label->get_DataLabelFormat()->set_ShowCategoryName(true);

label = series->get_DataPoints()->idx_get(1)->get_Label();
label->get_DataLabelFormat()->set_ShowSeriesName(true);

label = series->get_DataPoints()->idx_get(2)->get_Label();
label->get_DataLabelFormat()->set_ShowValue(true);
label->get_DataLabelFormat()->set_ShowSeriesName(true);
label->get_DataLabelFormat()->set_Separator(u"/");

presentation->Save(u"AsposeChart.pptx", SaveFormat::Pptx);
Il risultato:

Crea grafici a dispersione
I grafici a dispersione (noti anche come scatter plot o grafici x-y) sono spesso usati per verificare schemi o dimostrare correlazioni tra due variabili.
Usa un grafico a dispersione quando:
- Hai dati numerici accoppiati.
- Hai due variabili che si combinano bene.
- Vuoi determinare se le due variabili sono correlate.
- Hai una variabile indipendente che ha più valori per una variabile dipendente.
Questo esempio traccia due insiemi di valori x‑y. La prima serie utilizza linee rette con marcatori a stella, mentre la seconda utilizza linee lisce con marcatori a cerchio; entrambe usano una dimensione del marcatore di 10, impostata con set_Size. Il metodo set_Symbol controlla la forma del marcatore.
#include <system/shared_ptr.h>
#include <system/object_ext.h>
#include <system/string.h>
#include <DOM/Chart/ChartType.h>
#include <DOM/Chart/IChartCategoryCollection.h>
#include <DOM/Chart/IChartData.h>
#include <DOM/Chart/IChartDataCell.h>
#include <DOM/Chart/IChartDataPoint.h>
#include <DOM/Chart/IChartDataPointCollection.h>
#include <DOM/Chart/IChartDataWorkbook.h>
#include <DOM/Chart/IChartSeries.h>
#include <DOM/Chart/IChartSeriesCollection.h>
#include <DOM/Chart/IDoubleChartValue.h>
#include <DOM/Chart/IFormat.h>
#include <DOM/Chart/IMarker.h>
#include <DOM/Chart/MarkerStyleType.h>
#include <DOM/IChart.h>
#include <DOM/IColorFormat.h>
#include <DOM/IFillFormat.h>
#include <DOM/ILineFillFormat.h>
#include <DOM/ILineFormat.h>
#include <DOM/IShapeCollection.h>
#include <DOM/ISlide.h>
#include <DOM/Presentation.h>
#include <Export/SaveFormat.h>

using namespace System;
using namespace Aspose::Slides;
using namespace Aspose::Slides::Charts;
using namespace Aspose::Slides::Export;

auto presentation = MakeObject<Presentation>();
auto slide = presentation->get_Slide(0);

auto chart = slide->get_Shapes()->AddChart(ChartType::ScatterWithSmoothLines, 20, 20, 500, 300);

auto workbook = chart->get_ChartData()->get_ChartDataWorkbook();
auto worksheetIndex = 0;

chart->get_ChartData()->get_Series()->Clear();

auto seriesNameCell = workbook->GetCell(worksheetIndex, 1, 1, ObjectExt::Box(String(u"Series 1")));
chart->get_ChartData()->get_Series()->Add(seriesNameCell, chart->get_Type());
seriesNameCell = workbook->GetCell(worksheetIndex, 1, 3, ObjectExt::Box(String(u"Series 2")));
chart->get_ChartData()->get_Series()->Add(seriesNameCell, chart->get_Type());

auto series = chart->get_ChartData()->get_Series()->idx_get(0);

auto xValueCell = workbook->GetCell(worksheetIndex, 2, 1, ObjectExt::Box(1));
auto yValueCell = workbook->GetCell(worksheetIndex, 2, 2, ObjectExt::Box(3));
series->get_DataPoints()->AddDataPointForScatterSeries(xValueCell, yValueCell);

xValueCell = workbook->GetCell(worksheetIndex, 3, 1, ObjectExt::Box(2));
yValueCell = workbook->GetCell(worksheetIndex, 3, 2, ObjectExt::Box(10));
series->get_DataPoints()->AddDataPointForScatterSeries(xValueCell, yValueCell);

series->set_Type(ChartType::ScatterWithStraightLinesAndMarkers);

series->get_Marker()->set_Size(10);
series->get_Marker()->set_Symbol(MarkerStyleType::Star);

series = chart->get_ChartData()->get_Series()->idx_get(1);

xValueCell = workbook->GetCell(worksheetIndex, 2, 3, ObjectExt::Box(5));
yValueCell = workbook->GetCell(worksheetIndex, 2, 4, ObjectExt::Box(2));
series->get_DataPoints()->AddDataPointForScatterSeries(xValueCell, yValueCell);

xValueCell = workbook->GetCell(worksheetIndex, 3, 3, ObjectExt::Box(3));
yValueCell = workbook->GetCell(worksheetIndex, 3, 4, ObjectExt::Box(1));
series->get_DataPoints()->AddDataPointForScatterSeries(xValueCell, yValueCell);

xValueCell = workbook->GetCell(worksheetIndex, 4, 3, ObjectExt::Box(2));
yValueCell = workbook->GetCell(worksheetIndex, 4, 4, ObjectExt::Box(2));
series->get_DataPoints()->AddDataPointForScatterSeries(xValueCell, yValueCell);

xValueCell = workbook->GetCell(worksheetIndex, 5, 3, ObjectExt::Box(5));
yValueCell = workbook->GetCell(worksheetIndex, 5, 4, ObjectExt::Box(1));
series->get_DataPoints()->AddDataPointForScatterSeries(xValueCell, yValueCell);

series->get_Marker()->set_Size(10);
series->get_Marker()->set_Symbol(MarkerStyleType::Circle);

presentation->Save(u"AsposeChart.pptx", SaveFormat::Pptx);
Il risultato:

Crea grafici a torta
I grafici a torta sono ideali per mostrare la relazione parte‑intero nei dati, soprattutto quando i dati contengono etichette categoriche con valori numerici. Tuttavia, se i tuoi dati contengono molte parti o etichette, potresti considerare l’uso di un grafico a barre.
Questo esempio crea un grafico a torta con tre valori trimestrali. Ogni fetta ha un riempimento e un bordo personalizzati, e le etichette mostrano diverse combinazioni di valori, percentuali e informazioni sulla serie. Il metodo set_FirstSliceAngle imposta la prima fetta a 180 gradi.
#include <system/shared_ptr.h>
#include <system/object_ext.h>
#include <system/string.h>
#include <drawing/color.h>
#include <DOM/Chart/ChartType.h>
#include <DOM/Chart/IChartCategoryCollection.h>
#include <DOM/Chart/IChartData.h>
#include <DOM/Chart/IChartDataCell.h>
#include <DOM/Chart/IChartDataPoint.h>
#include <DOM/Chart/IChartDataPointCollection.h>
#include <DOM/Chart/IChartDataWorkbook.h>
#include <DOM/Chart/IChartSeries.h>
#include <DOM/Chart/IChartSeriesCollection.h>
#include <DOM/Chart/IChartSeriesGroup.h>
#include <DOM/Chart/IChartSeriesGroupCollection.h>
#include <DOM/Chart/IChartTextFormat.h>
#include <DOM/Chart/IChartTitle.h>
#include <DOM/Chart/IDataLabel.h>
#include <DOM/Chart/IDataLabelCollection.h>
#include <DOM/Chart/IDataLabelFormat.h>
#include <DOM/Chart/IDoubleChartValue.h>
#include <DOM/Chart/IFormat.h>
#include <DOM/Chart/ILegend.h>
#include <DOM/FillType.h>
#include <DOM/IChart.h>
#include <DOM/IColorFormat.h>
#include <DOM/IFillFormat.h>
#include <DOM/ILineFillFormat.h>
#include <DOM/ILineFormat.h>
#include <DOM/IPortionFormat.h>
#include <DOM/IShapeCollection.h>
#include <DOM/ISlide.h>
#include <DOM/ITextFrame.h>
#include <DOM/ITextFrameFormat.h>
#include <DOM/LineDashStyle.h>
#include <DOM/LineStyle.h>
#include <DOM/NullableBool.h>
#include <DOM/Presentation.h>
#include <Export/SaveFormat.h>

using namespace System;
using namespace System::Drawing;
using namespace Aspose::Slides;
using namespace Aspose::Slides::Charts;
using namespace Aspose::Slides::Export;

auto presentation = MakeObject<Presentation>();
auto slide = presentation->get_Slide(0);

auto chart = slide->get_Shapes()->AddChart(ChartType::Pie, 20, 20, 500, 300);

chart->get_ChartTitle()->AddTextFrameForOverriding(u"Sample Title");
chart->get_ChartTitle()->get_TextFrameForOverriding()->get_TextFrameFormat()->set_CenterText(NullableBool::True);
chart->get_ChartTitle()->set_Height(20);
chart->set_HasTitle(true);

chart->get_ChartData()->get_Series()->idx_get(0)->get_Labels()->get_DefaultDataLabelFormat()->set_ShowValue(true);

auto workbook = chart->get_ChartData()->get_ChartDataWorkbook();
auto worksheetIndex = 0;

chart->get_ChartData()->get_Series()->Clear();
chart->get_ChartData()->get_Categories()->Clear();

auto categoryCell = workbook->GetCell(0, 1, 0, ObjectExt::Box(String(u"1st Qtr")));
chart->get_ChartData()->get_Categories()->Add(categoryCell);
categoryCell = workbook->GetCell(0, 2, 0, ObjectExt::Box(String(u"2nd Qtr")));
chart->get_ChartData()->get_Categories()->Add(categoryCell);
categoryCell = workbook->GetCell(0, 3, 0, ObjectExt::Box(String(u"3rd Qtr")));
chart->get_ChartData()->get_Categories()->Add(categoryCell);

auto seriesNameCell = workbook->GetCell(0, 0, 1, ObjectExt::Box(String(u"Series 1")));
auto series = chart->get_ChartData()->get_Series()->Add(seriesNameCell, chart->get_Type());

auto valueCell = workbook->GetCell(worksheetIndex, 1, 1, ObjectExt::Box(20));
series->get_DataPoints()->AddDataPointForPieSeries(valueCell);
valueCell = workbook->GetCell(worksheetIndex, 2, 1, ObjectExt::Box(50));
series->get_DataPoints()->AddDataPointForPieSeries(valueCell);
valueCell = workbook->GetCell(worksheetIndex, 3, 1, ObjectExt::Box(30));
series->get_DataPoints()->AddDataPointForPieSeries(valueCell);

chart->get_ChartData()->get_SeriesGroups()->idx_get(0)->set_IsColorVaried(true);

auto firstSlice = series->get_DataPoints()->idx_get(0);
firstSlice->get_Format()->get_Fill()->set_FillType(FillType::Solid);
firstSlice->get_Format()->get_Fill()->get_SolidFillColor()->set_Color(Color::get_Cyan());

firstSlice->get_Format()->get_Line()->get_FillFormat()->set_FillType(FillType::Solid);
firstSlice->get_Format()->get_Line()->get_FillFormat()->get_SolidFillColor()->set_Color(Color::get_Gray());
firstSlice->get_Format()->get_Line()->set_Width(3.0);
firstSlice->get_Format()->get_Line()->set_Style(LineStyle::ThinThick);
firstSlice->get_Format()->get_Line()->set_DashStyle(LineDashStyle::LargeDash);

auto secondSlice = series->get_DataPoints()->idx_get(1);
secondSlice->get_Format()->get_Fill()->set_FillType(FillType::Solid);
secondSlice->get_Format()->get_Fill()->get_SolidFillColor()->set_Color(Color::get_Brown());

secondSlice->get_Format()->get_Line()->get_FillFormat()->set_FillType(FillType::Solid);
secondSlice->get_Format()->get_Line()->get_FillFormat()->get_SolidFillColor()->set_Color(Color::get_Blue());
secondSlice->get_Format()->get_Line()->set_Width(3.0);
secondSlice->get_Format()->get_Line()->set_Style(LineStyle::Single);
secondSlice->get_Format()->get_Line()->set_DashStyle(LineDashStyle::LargeDashDot);

auto thirdSlice = series->get_DataPoints()->idx_get(2);
thirdSlice->get_Format()->get_Fill()->set_FillType(FillType::Solid);
thirdSlice->get_Format()->get_Fill()->get_SolidFillColor()->set_Color(Color::get_Coral());

thirdSlice->get_Format()->get_Line()->get_FillFormat()->set_FillType(FillType::Solid);
thirdSlice->get_Format()->get_Line()->get_FillFormat()->get_SolidFillColor()->set_Color(Color::get_Red());
thirdSlice->get_Format()->get_Line()->set_Width(2.0);
thirdSlice->get_Format()->get_Line()->set_Style(LineStyle::ThinThin);
thirdSlice->get_Format()->get_Line()->set_DashStyle(LineDashStyle::LargeDashDotDot);

auto firstLabel = series->get_DataPoints()->idx_get(0)->get_Label();
firstLabel->get_DataLabelFormat()->set_ShowValue(true);

auto secondLabel = series->get_DataPoints()->idx_get(1)->get_Label();
secondLabel->get_DataLabelFormat()->set_ShowValue(true);
secondLabel->get_DataLabelFormat()->set_ShowLegendKey(true);
secondLabel->get_DataLabelFormat()->set_ShowPercentage(true);

auto thirdLabel = series->get_DataPoints()->idx_get(2)->get_Label();
thirdLabel->get_DataLabelFormat()->set_ShowSeriesName(true);
thirdLabel->get_DataLabelFormat()->set_ShowPercentage(true);

series->get_Labels()->get_DefaultDataLabelFormat()->set_ShowLeaderLines(true);

chart->get_ChartData()->get_SeriesGroups()->idx_get(0)->set_FirstSliceAngle(180);

presentation->Save(u"PieChart.pptx", SaveFormat::Pptx);
Il risultato:

Per migliorare la leggibilità delle etichette esterne al grafico a torta, vedi Formato linee guida per un esempio che posiziona le etichette e personalizza il colore, la larghezza, la trasparenza e lo stile tratteggiato delle linee.
Crea grafici a linee
I grafici a linee (noti anche come grafici lineari) sono ideali quando vuoi mostrare variazioni di valore nel tempo. Con un grafico a linee, puoi confrontare una grande quantità di dati simultaneamente, monitorare variazioni e tendenze nel tempo, evidenziare anomalie nelle serie di dati e molto altro.
Questo esempio utilizza AddChart per creare un grafico a linee con le serie e le categorie predefinite, quindi salva la presentazione come PPTX.
#include <system/shared_ptr.h>
#include <DOM/Chart/ChartType.h>
#include <DOM/Chart/IChartCategoryCollection.h>
#include <DOM/Chart/IChartData.h>
#include <DOM/Chart/IChartSeriesCollection.h>
#include <DOM/Chart/IFormat.h>
#include <DOM/IChart.h>
#include <DOM/IColorFormat.h>
#include <DOM/IFillFormat.h>
#include <DOM/ILineFillFormat.h>
#include <DOM/ILineFormat.h>
#include <DOM/IShapeCollection.h>
#include <DOM/ISlide.h>
#include <DOM/Presentation.h>
#include <Export/SaveFormat.h>

using namespace System;
using namespace Aspose::Slides;
using namespace Aspose::Slides::Charts;
using namespace Aspose::Slides::Export;

auto presentation = MakeObject<Presentation>();
auto slide = presentation->get_Slide(0);

auto lineChart = slide->get_Shapes()->AddChart(ChartType::Line, 20, 20, 500, 300);

presentation->Save(u"lineChart.pptx", SaveFormat::Pptx);
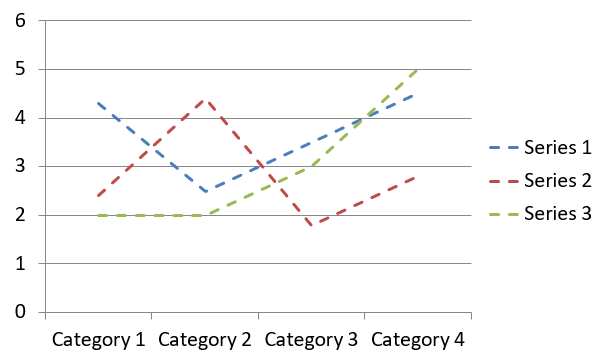
Per impostazione predefinita, i punti di un grafico a linee sono collegati da linee continue rette. Se desideri che i punti siano collegati da linee tratteggiate, chiama set_DashStyle con un valore da LineDashStyle:
#include <system/shared_ptr.h>
#include <DOM/Chart/ChartType.h>
#include <DOM/Chart/IChartCategoryCollection.h>
#include <DOM/Chart/IChartData.h>
#include <DOM/Chart/IChartSeries.h>
#include <DOM/Chart/IChartSeriesCollection.h>
#include <DOM/Chart/IFormat.h>
#include <DOM/IChart.h>
#include <DOM/IColorFormat.h>
#include <DOM/IFillFormat.h>
#include <DOM/ILineFillFormat.h>
#include <DOM/ILineFormat.h>
#include <DOM/IShapeCollection.h>
#include <DOM/ISlide.h>
#include <DOM/LineDashStyle.h>
#include <DOM/Presentation.h>

using namespace System;
using namespace Aspose::Slides;
using namespace Aspose::Slides::Charts;

auto presentation = MakeObject<Presentation>();
auto slide = presentation->get_Slide(0);

auto lineChart = slide->get_Shapes()->AddChart(ChartType::Line, 20, 20, 500, 300);

for (auto series : lineChart->get_ChartData()->get_Series())
{
    series->get_Format()->get_Line()->set_DashStyle(LineDashStyle::Dash);
}
Il risultato:
Crea grafici a mappa ad albero
I grafici a mappa ad albero sono ideali per dati di vendita quando vuoi mostrare la dimensione relativa delle categorie di dati e attirare rapidamente l’attenzione sugli elementi che contribuiscono di più all’interno di ciascuna categoria.
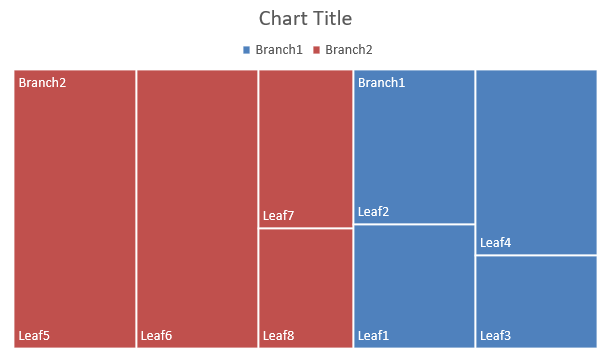
Questo esempio crea una mappa ad albero con otto foglie raggruppate in quattro steli e due rami. Il metodo SetGroupingItem assegna gli steli al livello di raggruppamento 1 e i rami al livello 2. I valori determinano le dimensioni relative dei rettangoli, mentre le etichette di categoria e le etichette dei genitori sovrapposte identificano la gerarchia.
#include <system/shared_ptr.h>
#include <system/object_ext.h>
#include <system/string.h>
#include <DOM/Chart/ChartType.h>
#include <DOM/Chart/IChartCategory.h>
#include <DOM/Chart/IChartCategoryCollection.h>
#include <DOM/Chart/IChartCategoryLevelsManager.h>
#include <DOM/Chart/IChartData.h>
#include <DOM/Chart/IChartDataCell.h>
#include <DOM/Chart/IChartDataPoint.h>
#include <DOM/Chart/IChartDataPointCollection.h>
#include <DOM/Chart/IChartDataWorkbook.h>
#include <DOM/Chart/IChartSeries.h>
#include <DOM/Chart/IChartSeriesCollection.h>
#include <DOM/Chart/IDataLabel.h>
#include <DOM/Chart/IDataLabelCollection.h>
#include <DOM/Chart/IDataLabelFormat.h>
#include <DOM/Chart/IFormat.h>
#include <DOM/Chart/ParentLabelLayoutType.h>
#include <DOM/IChart.h>
#include <DOM/IColorFormat.h>
#include <DOM/IFillFormat.h>
#include <DOM/ILineFillFormat.h>
#include <DOM/ILineFormat.h>
#include <DOM/IShapeCollection.h>
#include <DOM/ISlide.h>
#include <DOM/Presentation.h>
#include <Export/SaveFormat.h>

using namespace System;
using namespace Aspose::Slides;
using namespace Aspose::Slides::Charts;
using namespace Aspose::Slides::Export;

auto presentation = MakeObject<Presentation>();
auto slide = presentation->get_Slide(0);

auto chart = slide->get_Shapes()->AddChart(ChartType::Treemap, 20, 20, 500, 300);

chart->get_ChartData()->get_Categories()->Clear();
chart->get_ChartData()->get_Series()->Clear();

auto workbook = chart->get_ChartData()->get_ChartDataWorkbook();
workbook->Clear(0);

// Ramo 1
auto categoryCell = workbook->GetCell(0, u"C1", ObjectExt::Box(String(u"Leaf1")));
auto leaf = chart->get_ChartData()->get_Categories()->Add(categoryCell);
leaf->get_GroupingLevels()->SetGroupingItem(1, ObjectExt::Box(String(u"Stem1")));
leaf->get_GroupingLevels()->SetGroupingItem(2, ObjectExt::Box(String(u"Branch1")));

categoryCell = workbook->GetCell(0, u"C2", ObjectExt::Box(String(u"Leaf2")));
chart->get_ChartData()->get_Categories()->Add(categoryCell);

categoryCell = workbook->GetCell(0, u"C3", ObjectExt::Box(String(u"Leaf3")));
leaf = chart->get_ChartData()->get_Categories()->Add(categoryCell);
leaf->get_GroupingLevels()->SetGroupingItem(1, ObjectExt::Box(String(u"Stem2")));

categoryCell = workbook->GetCell(0, u"C4", ObjectExt::Box(String(u"Leaf4")));
chart->get_ChartData()->get_Categories()->Add(categoryCell);

// Ramo 2
categoryCell = workbook->GetCell(0, u"C5", ObjectExt::Box(String(u"Leaf5")));
leaf = chart->get_ChartData()->get_Categories()->Add(categoryCell);
leaf->get_GroupingLevels()->SetGroupingItem(1, ObjectExt::Box(String(u"Stem3")));
leaf->get_GroupingLevels()->SetGroupingItem(2, ObjectExt::Box(String(u"Branch2")));

categoryCell = workbook->GetCell(0, u"C6", ObjectExt::Box(String(u"Leaf6")));
chart->get_ChartData()->get_Categories()->Add(categoryCell);

categoryCell = workbook->GetCell(0, u"C7", ObjectExt::Box(String(u"Leaf7")));
leaf = chart->get_ChartData()->get_Categories()->Add(categoryCell);
leaf->get_GroupingLevels()->SetGroupingItem(1, ObjectExt::Box(String(u"Stem4")));

categoryCell = workbook->GetCell(0, u"C8", ObjectExt::Box(String(u"Leaf8")));
chart->get_ChartData()->get_Categories()->Add(categoryCell);

auto series = chart->get_ChartData()->get_Series()->Add(ChartType::Treemap);
series->get_Labels()->get_DefaultDataLabelFormat()->set_ShowCategoryName(true);
auto valueCell = workbook->GetCell(0, u"D1", ObjectExt::Box(4));
series->get_DataPoints()->AddDataPointForTreemapSeries(valueCell);
valueCell = workbook->GetCell(0, u"D2", ObjectExt::Box(5));
series->get_DataPoints()->AddDataPointForTreemapSeries(valueCell);
valueCell = workbook->GetCell(0, u"D3", ObjectExt::Box(3));
series->get_DataPoints()->AddDataPointForTreemapSeries(valueCell);
valueCell = workbook->GetCell(0, u"D4", ObjectExt::Box(6));
series->get_DataPoints()->AddDataPointForTreemapSeries(valueCell);
valueCell = workbook->GetCell(0, u"D5", ObjectExt::Box(9));
series->get_DataPoints()->AddDataPointForTreemapSeries(valueCell);
valueCell = workbook->GetCell(0, u"D6", ObjectExt::Box(9));
series->get_DataPoints()->AddDataPointForTreemapSeries(valueCell);
valueCell = workbook->GetCell(0, u"D7", ObjectExt::Box(4));
series->get_DataPoints()->AddDataPointForTreemapSeries(valueCell);
valueCell = workbook->GetCell(0, u"D8", ObjectExt::Box(3));
series->get_DataPoints()->AddDataPointForTreemapSeries(valueCell);

series->set_ParentLabelLayout(ParentLabelLayoutType::Overlapping);

presentation->Save(u"Treemap.pptx", SaveFormat::Pptx);
Il risultato:
Crea grafici a cascata
Un grafico a cascata mostra come le variazioni positive e negative contribuiscono a un valore finale. Per esempio, una ripartizione del profitto può partire dal fatturato, sottrarre i costi e aggiungere altri redditi. Le colonne di variazione fluttuano tra i valori cumulativi precedenti e nuovi, mentre le colonne totali si estendono da zero al valore accumulato.
| Categoria | Valore cartella di lavoro | Tipo di colonna |
|---|---|---|
| Ricavi | 1000 | Aumento |
| Costo delle vendite | -400 | Diminuzione |
| Profitto lordo | 600 | Totale intermedio |
| Spese operative | -200 | Diminuzione |
| Altri proventi | 50 | Aumento |
| Profitto netto | 450 | Totale finale |
Per segnare un punto come totale intermedio o finale, chiama il suo metodo set_SetAsTotal con true. Fornisci l’importo effettivamente accumulato nella cella del workbook di quel punto: 600 per il profitto lordo (1000 - 400) e 450 per il profitto netto (600 - 200 + 50). Il metodo contrassegna la colonna come totale; non calcola né popola il valore della cella. Non usare zero come segnaposto né fornire un’altra variazione per un punto totale. Una colonna totale visualizza il valore accumulato senza aggiungerlo nuovamente al valore corrente.
Questo esempio completo in C++ crea un grafico utilizzando il membro Waterfall di ChartType, cancella i dati predefiniti e riempie la cartella di lavoro incorporata. L’indice del foglio di lavoro 0 seleziona il primo foglio; la colonna A contiene i nomi delle categorie e la colonna B contiene i valori. Ogni cella valore viene aggiunta con AddDataPointForWaterfallSeries. Gli indici dei punti basati su zero 2 e 5 identificano rispettivamente i totali intermedi e finali. Passando true a set_ShowValue vengono visualizzati gli importi sulle colonne. Non è richiesta alcuna presentazione o cartella di lavoro di input.
#include <system/shared_ptr.h>
#include <system/object_ext.h>
#include <system/string.h>
#include <system/array.h>
#include <DOM/Chart/ChartType.h>
#include <DOM/Chart/IChartCategoryCollection.h>
#include <DOM/Chart/IChartData.h>
#include <DOM/Chart/IChartDataCell.h>
#include <DOM/Chart/IChartDataPoint.h>
#include <DOM/Chart/IChartDataPointCollection.h>
#include <DOM/Chart/IChartDataWorkbook.h>
#include <DOM/Chart/IChartSeries.h>
#include <DOM/Chart/IChartSeriesCollection.h>
#include <DOM/Chart/IChartTextFormat.h>
#include <DOM/Chart/IChartTitle.h>
#include <DOM/Chart/IDataLabel.h>
#include <DOM/Chart/IDataLabelCollection.h>
#include <DOM/Chart/IDataLabelFormat.h>
#include <DOM/Chart/IDoubleChartValue.h>
#include <DOM/Chart/IFormat.h>
#include <DOM/Chart/ILegend.h>
#include <DOM/IChart.h>
#include <DOM/IColorFormat.h>
#include <DOM/IFillFormat.h>
#include <DOM/ILineFillFormat.h>
#include <DOM/ILineFormat.h>
#include <DOM/IPortionFormat.h>
#include <DOM/IShapeCollection.h>
#include <DOM/ISlide.h>
#include <DOM/ITextFrame.h>
#include <DOM/ITextFrameFormat.h>
#include <DOM/NullableBool.h>
#include <DOM/Presentation.h>
#include <Export/SaveFormat.h>

using namespace System;
using namespace Aspose::Slides;
using namespace Aspose::Slides::Charts;
using namespace Aspose::Slides::Export;

auto presentation = MakeObject<Presentation>();
auto slide = presentation->get_Slide(0);

auto chart = slide->get_Shapes()->AddChart(ChartType::Waterfall, 20, 20, 680, 200);

chart->set_HasTitle(true);
chart->get_ChartTitle()->AddTextFrameForOverriding(u"Profit breakdown (USD thousands)");
chart->get_ChartTitle()->set_Overlay(false);
chart->set_HasLegend(false);

chart->get_ChartData()->get_Series()->Clear();
chart->get_ChartData()->get_Categories()->Clear();

auto workbook = chart->get_ChartData()->get_ChartDataWorkbook();
auto worksheetIndex = 0;

workbook->Clear(worksheetIndex);

auto seriesNameCell = workbook->GetCell(worksheetIndex, 0, 1, ObjectExt::Box(String(u"Profit")));
auto series = chart->get_ChartData()->get_Series()->Add(seriesNameCell, ChartType::Waterfall);
auto categories = MakeArray<String>({ u"Revenue", u"Cost of sales", u"Gross profit", u"Operating expenses", u"Other income", u"Net profit" });
auto values = MakeArray<double>({ 1000, -400, 600, -200, 50, 450 });

for (auto i = 0; i < categories->get_Length(); i++)
{
    auto categoryCell = workbook->GetCell(worksheetIndex, i + 1, 0, ObjectExt::Box(categories->idx_get(i)));
    chart->get_ChartData()->get_Categories()->Add(categoryCell);
    auto valueCell = workbook->GetCell(worksheetIndex, i + 1, 1, ObjectExt::Box(values->idx_get(i)));
    series->get_DataPoints()->AddDataPointForWaterfallSeries(valueCell);
}

// I terzi e sesti punti rappresentano totali, non variazioni aggiuntive.
series->get_DataPoints()->idx_get(2)->set_SetAsTotal(true);
series->get_DataPoints()->idx_get(5)->set_SetAsTotal(true);
series->set_ShowConnectorLines(true);
series->get_Labels()->get_DefaultDataLabelFormat()->set_ShowValue(true);

presentation->Save(u"WaterfallChart.pptx", SaveFormat::Pptx);
Chiama il metodo a livello di serie set_ShowConnectorLines con true per mostrare le linee che collegano le colonne consecutive e rendere più chiaro il valore corrente. Per nascondere queste linee, sostituisci l’assegnazione nell’esempio con series->set_ShowConnectorLines(false); prima di salvare. Questo modifica solo la visibilità della linea, non i dati o i totali.
La presentazione salvata mostra un profitto lordo di 600 e un profitto netto di 450, con entrambi i totali calcolati da zero:

Crea grafici azionari
I grafici azionari sono usati per visualizzare dati finanziari come prezzi di apertura, massimo, minimo e chiusura, aiutando ad analizzare tendenze di mercato e volatilità. Offrono informazioni essenziali sulle performance delle azioni, supportando investitori e analisti nelle decisioni informate.
Questo esempio crea un grafico open‑high‑low‑close con quattro serie in quest’ordine e tre categorie. Il metodo set_HasUpDownBars abilita le barre su/giù, e get_HiLowLinesFormat controlla le linee high‑low che mostrano le fasce di prezzo, mentre le linee delle singole serie e le linee di griglia orizzontali minori sono nascoste.
#include <DOM/Chart/IChartLinesFormat.h>
#include <system/shared_ptr.h>
#include <system/object_ext.h>
#include <system/string.h>
#include <DOM/Chart/ChartType.h>
#include <DOM/Chart/IAxesManager.h>
#include <DOM/Chart/IAxis.h>
#include <DOM/Chart/IChartCategoryCollection.h>
#include <DOM/Chart/IChartData.h>
#include <DOM/Chart/IChartDataCell.h>
#include <DOM/Chart/IChartDataPoint.h>
#include <DOM/Chart/IChartDataPointCollection.h>
#include <DOM/Chart/IChartDataWorkbook.h>
#include <DOM/Chart/IChartSeries.h>
#include <DOM/Chart/IChartSeriesCollection.h>
#include <DOM/Chart/IChartSeriesGroup.h>
#include <DOM/Chart/IChartSeriesGroupCollection.h>
#include <DOM/Chart/IFormat.h>
#include <DOM/Chart/IUpDownBarsManager.h>
#include <DOM/FillType.h>
#include <DOM/IChart.h>
#include <DOM/IColorFormat.h>
#include <DOM/IFillFormat.h>
#include <DOM/ILineFillFormat.h>
#include <DOM/ILineFormat.h>
#include <DOM/IShapeCollection.h>
#include <DOM/ISlide.h>
#include <DOM/Presentation.h>
#include <Export/SaveFormat.h>

using namespace System;
using namespace Aspose::Slides;
using namespace Aspose::Slides::Charts;
using namespace Aspose::Slides::Export;

auto presentation = MakeObject<Presentation>();
auto slide = presentation->get_Slide(0);

auto chart = slide->get_Shapes()->AddChart(ChartType::OpenHighLowClose, 20, 20, 500, 300, false);

auto workbook = chart->get_ChartData()->get_ChartDataWorkbook();

auto categoryCell = workbook->GetCell(0, 1, 0, ObjectExt::Box(String(u"A")));
chart->get_ChartData()->get_Categories()->Add(categoryCell);
categoryCell = workbook->GetCell(0, 2, 0, ObjectExt::Box(String(u"B")));
chart->get_ChartData()->get_Categories()->Add(categoryCell);
categoryCell = workbook->GetCell(0, 3, 0, ObjectExt::Box(String(u"C")));
chart->get_ChartData()->get_Categories()->Add(categoryCell);

auto seriesNameCell = workbook->GetCell(0, 0, 1, ObjectExt::Box(String(u"Open")));
chart->get_ChartData()->get_Series()->Add(seriesNameCell, ChartType::OpenHighLowClose);
seriesNameCell = workbook->GetCell(0, 0, 2, ObjectExt::Box(String(u"High")));
chart->get_ChartData()->get_Series()->Add(seriesNameCell, ChartType::OpenHighLowClose);
seriesNameCell = workbook->GetCell(0, 0, 3, ObjectExt::Box(String(u"Low")));
chart->get_ChartData()->get_Series()->Add(seriesNameCell, ChartType::OpenHighLowClose);
seriesNameCell = workbook->GetCell(0, 0, 4, ObjectExt::Box(String(u"Close")));
chart->get_ChartData()->get_Series()->Add(seriesNameCell, ChartType::OpenHighLowClose);

auto series = chart->get_ChartData()->get_Series()->idx_get(0);
auto valueCell = workbook->GetCell(0, 1, 1, ObjectExt::Box(72));
series->get_DataPoints()->AddDataPointForStockSeries(valueCell);
valueCell = workbook->GetCell(0, 2, 1, ObjectExt::Box(25));
series->get_DataPoints()->AddDataPointForStockSeries(valueCell);
valueCell = workbook->GetCell(0, 3, 1, ObjectExt::Box(38));
series->get_DataPoints()->AddDataPointForStockSeries(valueCell);

series = chart->get_ChartData()->get_Series()->idx_get(1);
valueCell = workbook->GetCell(0, 1, 2, ObjectExt::Box(172));
series->get_DataPoints()->AddDataPointForStockSeries(valueCell);
valueCell = workbook->GetCell(0, 2, 2, ObjectExt::Box(57));
series->get_DataPoints()->AddDataPointForStockSeries(valueCell);
valueCell = workbook->GetCell(0, 3, 2, ObjectExt::Box(57));
series->get_DataPoints()->AddDataPointForStockSeries(valueCell);

series = chart->get_ChartData()->get_Series()->idx_get(2);
valueCell = workbook->GetCell(0, 1, 3, ObjectExt::Box(12));
series->get_DataPoints()->AddDataPointForStockSeries(valueCell);
valueCell = workbook->GetCell(0, 2, 3, ObjectExt::Box(12));
series->get_DataPoints()->AddDataPointForStockSeries(valueCell);
valueCell = workbook->GetCell(0, 3, 3, ObjectExt::Box(13));
series->get_DataPoints()->AddDataPointForStockSeries(valueCell);

series = chart->get_ChartData()->get_Series()->idx_get(3);
valueCell = workbook->GetCell(0, 1, 4, ObjectExt::Box(25));
series->get_DataPoints()->AddDataPointForStockSeries(valueCell);
valueCell = workbook->GetCell(0, 2, 4, ObjectExt::Box(38));
series->get_DataPoints()->AddDataPointForStockSeries(valueCell);
valueCell = workbook->GetCell(0, 3, 4, ObjectExt::Box(50));
series->get_DataPoints()->AddDataPointForStockSeries(valueCell);

chart->get_ChartData()->get_SeriesGroups()->idx_get(0)->get_UpDownBars()->set_HasUpDownBars(true);
chart->get_ChartData()->get_SeriesGroups()->idx_get(0)->get_HiLowLinesFormat()->get_Line()->get_FillFormat()->set_FillType(FillType::Solid);

for (auto stockSeries : chart->get_ChartData()->get_Series())
{
    stockSeries->get_Format()->get_Line()->get_FillFormat()->set_FillType(FillType::NoFill);
}

chart->get_Axes()->get_VerticalAxis()->get_MinorGridLinesFormat()->get_Line()->get_FillFormat()->set_FillType(FillType::NoFill);

presentation->Save(u"Stock-chart.pptx", SaveFormat::Pptx);
Il risultato:

Crea grafici a scatola e baffi
I grafici a scatola e baffi visualizzano la distribuzione dei dati sintetizzando misure statistiche chiave, come mediana, quartili e possibili outlier. Sono particolarmente utili nell’analisi esplorativa dei dati e negli studi statistici per comprendere rapidamente la variabilità dei dati e identificare anomalie.
Questo esempio crea un grafico a scatola e baffi a partire da sei valori. Il metodo set_QuartileMethod seleziona il calcolo esclusivo dei quartili. L’esempio abilita inoltre le linee della media, i marcatori della media, i punti interni e i punti outlier.
#include <system/shared_ptr.h>
#include <system/object_ext.h>
#include <system/string.h>
#include <DOM/Chart/ChartType.h>
#include <DOM/Chart/IChartCategoryCollection.h>
#include <DOM/Chart/IChartData.h>
#include <DOM/Chart/IChartDataCell.h>
#include <DOM/Chart/IChartDataPoint.h>
#include <DOM/Chart/IChartDataPointCollection.h>
#include <DOM/Chart/IChartDataWorkbook.h>
#include <DOM/Chart/IChartSeries.h>
#include <DOM/Chart/IChartSeriesCollection.h>
#include <DOM/Chart/IFormat.h>
#include <DOM/Chart/IMarker.h>
#include <DOM/Chart/QuartileMethodType.h>
#include <DOM/IChart.h>
#include <DOM/IColorFormat.h>
#include <DOM/IFillFormat.h>
#include <DOM/ILineFillFormat.h>
#include <DOM/ILineFormat.h>
#include <DOM/IShapeCollection.h>
#include <DOM/ISlide.h>
#include <DOM/Presentation.h>
#include <Export/SaveFormat.h>

using namespace System;
using namespace Aspose::Slides;
using namespace Aspose::Slides::Charts;
using namespace Aspose::Slides::Export;

auto presentation = MakeObject<Presentation>();
auto slide = presentation->get_Slide(0);

auto chart = slide->get_Shapes()->AddChart(ChartType::BoxAndWhisker, 20, 20, 500, 300);

chart->get_ChartData()->get_Categories()->Clear();
chart->get_ChartData()->get_Series()->Clear();

auto workbook = chart->get_ChartData()->get_ChartDataWorkbook();
workbook->Clear(0);

auto categoryCell = workbook->GetCell(0, u"A1", ObjectExt::Box(String(u"Category 1")));
chart->get_ChartData()->get_Categories()->Add(categoryCell);
categoryCell = workbook->GetCell(0, u"A2", ObjectExt::Box(String(u"Category 2")));
chart->get_ChartData()->get_Categories()->Add(categoryCell);
categoryCell = workbook->GetCell(0, u"A3", ObjectExt::Box(String(u"Category 3")));
chart->get_ChartData()->get_Categories()->Add(categoryCell);
categoryCell = workbook->GetCell(0, u"A4", ObjectExt::Box(String(u"Category 4")));
chart->get_ChartData()->get_Categories()->Add(categoryCell);
categoryCell = workbook->GetCell(0, u"A5", ObjectExt::Box(String(u"Category 5")));
chart->get_ChartData()->get_Categories()->Add(categoryCell);
categoryCell = workbook->GetCell(0, u"A6", ObjectExt::Box(String(u"Category 6")));
chart->get_ChartData()->get_Categories()->Add(categoryCell);

auto series = chart->get_ChartData()->get_Series()->Add(ChartType::BoxAndWhisker);

series->set_QuartileMethod(QuartileMethodType::Exclusive);
series->set_ShowMeanLine(true);
series->set_ShowMeanMarkers(true);
series->set_ShowInnerPoints(true);
series->set_ShowOutlierPoints(true);

auto valueCell = workbook->GetCell(0, u"B1", ObjectExt::Box(15));
series->get_DataPoints()->AddDataPointForBoxAndWhiskerSeries(valueCell);
valueCell = workbook->GetCell(0, u"B2", ObjectExt::Box(41));
series->get_DataPoints()->AddDataPointForBoxAndWhiskerSeries(valueCell);
valueCell = workbook->GetCell(0, u"B3", ObjectExt::Box(16));
series->get_DataPoints()->AddDataPointForBoxAndWhiskerSeries(valueCell);
valueCell = workbook->GetCell(0, u"B4", ObjectExt::Box(10));
series->get_DataPoints()->AddDataPointForBoxAndWhiskerSeries(valueCell);
valueCell = workbook->GetCell(0, u"B5", ObjectExt::Box(23));
series->get_DataPoints()->AddDataPointForBoxAndWhiskerSeries(valueCell);
valueCell = workbook->GetCell(0, u"B6", ObjectExt::Box(16));
series->get_DataPoints()->AddDataPointForBoxAndWhiskerSeries(valueCell);

presentation->Save(u"BoxAndWhisker.pptx", SaveFormat::Pptx);
Crea grafici a imbuto
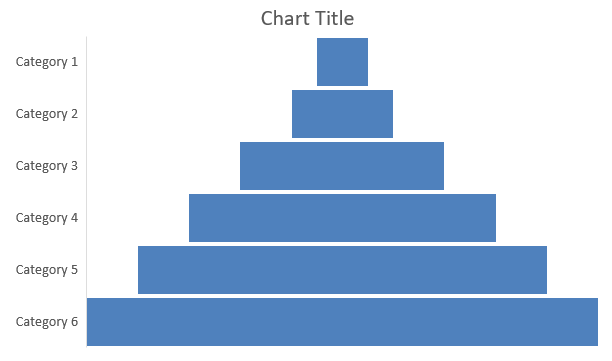
I grafici a imbuto visualizzano processi che coinvolgono fasi sequenziali, dove il volume dei dati diminuisce man mano che si avanza da una fase all’altra. Sono particolarmente utili per analizzare i tassi di conversione, identificare colli di bottiglia e monitorare l’efficienza dei processi di vendita o marketing.
Questo esempio utilizza AddChart per aggiungere un grafico a imbuto alla prima diapositiva di una presentazione esistente. Sostituisce i dati predefiniti con sei categorie e valori compresi tra 50 e 500, poi salva la presentazione aggiornata. La presentazione di input deve contenere almeno una diapositiva.
#include <system/shared_ptr.h>
#include <system/object_ext.h>
#include <system/string.h>
#include <DOM/Chart/ChartType.h>
#include <DOM/Chart/IChartCategoryCollection.h>
#include <DOM/Chart/IChartData.h>
#include <DOM/Chart/IChartDataCell.h>
#include <DOM/Chart/IChartDataPoint.h>
#include <DOM/Chart/IChartDataPointCollection.h>
#include <DOM/Chart/IChartDataWorkbook.h>
#include <DOM/Chart/IChartSeries.h>
#include <DOM/Chart/IChartSeriesCollection.h>
#include <DOM/Chart/IFormat.h>
#include <DOM/IChart.h>
#include <DOM/IColorFormat.h>
#include <DOM/IFillFormat.h>
#include <DOM/ILineFillFormat.h>
#include <DOM/ILineFormat.h>
#include <DOM/IShapeCollection.h>
#include <DOM/ISlide.h>
#include <DOM/Presentation.h>
#include <Export/SaveFormat.h>

using namespace System;
using namespace Aspose::Slides;
using namespace Aspose::Slides::Charts;
using namespace Aspose::Slides::Export;

auto presentation = MakeObject<Presentation>(u"test.pptx");
auto slide = presentation->get_Slide(0);

auto chart = slide->get_Shapes()->AddChart(ChartType::Funnel, 50, 50, 500, 400);

chart->get_ChartData()->get_Categories()->Clear();
chart->get_ChartData()->get_Series()->Clear();

auto workbook = chart->get_ChartData()->get_ChartDataWorkbook();
workbook->Clear(0);

auto categoryCell = workbook->GetCell(0, u"A1", ObjectExt::Box(String(u"Category 1")));
chart->get_ChartData()->get_Categories()->Add(categoryCell);
categoryCell = workbook->GetCell(0, u"A2", ObjectExt::Box(String(u"Category 2")));
chart->get_ChartData()->get_Categories()->Add(categoryCell);
categoryCell = workbook->GetCell(0, u"A3", ObjectExt::Box(String(u"Category 3")));
chart->get_ChartData()->get_Categories()->Add(categoryCell);
categoryCell = workbook->GetCell(0, u"A4", ObjectExt::Box(String(u"Category 4")));
chart->get_ChartData()->get_Categories()->Add(categoryCell);
categoryCell = workbook->GetCell(0, u"A5", ObjectExt::Box(String(u"Category 5")));
chart->get_ChartData()->get_Categories()->Add(categoryCell);
categoryCell = workbook->GetCell(0, u"A6", ObjectExt::Box(String(u"Category 6")));
chart->get_ChartData()->get_Categories()->Add(categoryCell);

auto series = chart->get_ChartData()->get_Series()->Add(ChartType::Funnel);

auto valueCell = workbook->GetCell(0, u"B1", ObjectExt::Box(50));
series->get_DataPoints()->AddDataPointForFunnelSeries(valueCell);
valueCell = workbook->GetCell(0, u"B2", ObjectExt::Box(100));
series->get_DataPoints()->AddDataPointForFunnelSeries(valueCell);
valueCell = workbook->GetCell(0, u"B3", ObjectExt::Box(200));
series->get_DataPoints()->AddDataPointForFunnelSeries(valueCell);
valueCell = workbook->GetCell(0, u"B4", ObjectExt::Box(300));
series->get_DataPoints()->AddDataPointForFunnelSeries(valueCell);
valueCell = workbook->GetCell(0, u"B5", ObjectExt::Box(400));
series->get_DataPoints()->AddDataPointForFunnelSeries(valueCell);
valueCell = workbook->GetCell(0, u"B6", ObjectExt::Box(500));
series->get_DataPoints()->AddDataPointForFunnelSeries(valueCell);

presentation->Save(u"Funnel.pptx", SaveFormat::Pptx);
Il risultato:
Crea grafici Sunburst
I grafici Sunburst visualizzano dati gerarchici, mostrando i livelli come anelli concentrici. Aiutano a illustrare le relazioni parte‑intero e sono ideali per rappresentare categorie e sotto‑categorie nidificate in modo chiaro e compatto.
Questo esempio crea un grafico Sunburst con otto foglie raggruppate in quattro steli e due rami. Il metodo SetGroupingItem assegna gli steli al livello di raggruppamento 1 e i rami al livello 2. Le etichette di categoria identificano i segmenti e i valori determinano le loro dimensioni relative.
#include <system/shared_ptr.h>
#include <system/object_ext.h>
#include <system/string.h>
#include <DOM/Chart/ChartType.h>
#include <DOM/Chart/IChartCategory.h>
#include <DOM/Chart/IChartCategoryCollection.h>
#include <DOM/Chart/IChartCategoryLevelsManager.h>
#include <DOM/Chart/IChartData.h>
#include <DOM/Chart/IChartDataCell.h>
#include <DOM/Chart/IChartDataPoint.h>
#include <DOM/Chart/IChartDataPointCollection.h>
#include <DOM/Chart/IChartDataWorkbook.h>
#include <DOM/Chart/IChartSeries.h>
#include <DOM/Chart/IChartSeriesCollection.h>
#include <DOM/Chart/IDataLabel.h>
#include <DOM/Chart/IDataLabelCollection.h>
#include <DOM/Chart/IDataLabelFormat.h>
#include <DOM/Chart/IFormat.h>
#include <DOM/IChart.h>
#include <DOM/IColorFormat.h>
#include <DOM/IFillFormat.h>
#include <DOM/ILineFillFormat.h>
#include <DOM/ILineFormat.h>
#include <DOM/IShapeCollection.h>
#include <DOM/ISlide.h>
#include <DOM/Presentation.h>
#include <Export/SaveFormat.h>

using namespace System;
using namespace Aspose::Slides;
using namespace Aspose::Slides::Charts;
using namespace Aspose::Slides::Export;

auto presentation = MakeObject<Presentation>();
auto slide = presentation->get_Slide(0);

auto chart = slide->get_Shapes()->AddChart(ChartType::Sunburst, 20, 20, 500, 300);

chart->get_ChartData()->get_Categories()->Clear();
chart->get_ChartData()->get_Series()->Clear();

auto workbook = chart->get_ChartData()->get_ChartDataWorkbook();
workbook->Clear(0);

// Ramo 1
auto categoryCell = workbook->GetCell(0, u"C1", ObjectExt::Box(String(u"Leaf1")));
auto leaf = chart->get_ChartData()->get_Categories()->Add(categoryCell);
leaf->get_GroupingLevels()->SetGroupingItem(1, ObjectExt::Box(String(u"Stem1")));
leaf->get_GroupingLevels()->SetGroupingItem(2, ObjectExt::Box(String(u"Branch1")));

categoryCell = workbook->GetCell(0, u"C2", ObjectExt::Box(String(u"Leaf2")));
chart->get_ChartData()->get_Categories()->Add(categoryCell);

categoryCell = workbook->GetCell(0, u"C3", ObjectExt::Box(String(u"Leaf3")));
leaf = chart->get_ChartData()->get_Categories()->Add(categoryCell);
leaf->get_GroupingLevels()->SetGroupingItem(1, ObjectExt::Box(String(u"Stem2")));

categoryCell = workbook->GetCell(0, u"C4", ObjectExt::Box(String(u"Leaf4")));
chart->get_ChartData()->get_Categories()->Add(categoryCell);

// Ramo 2
categoryCell = workbook->GetCell(0, u"C5", ObjectExt::Box(String(u"Leaf5")));
leaf = chart->get_ChartData()->get_Categories()->Add(categoryCell);
leaf->get_GroupingLevels()->SetGroupingItem(1, ObjectExt::Box(String(u"Stem3")));
leaf->get_GroupingLevels()->SetGroupingItem(2, ObjectExt::Box(String(u"Branch2")));

categoryCell = workbook->GetCell(0, u"C6", ObjectExt::Box(String(u"Leaf6")));
chart->get_ChartData()->get_Categories()->Add(categoryCell);

categoryCell = workbook->GetCell(0, u"C7", ObjectExt::Box(String(u"Leaf7")));
leaf = chart->get_ChartData()->get_Categories()->Add(categoryCell);
leaf->get_GroupingLevels()->SetGroupingItem(1, ObjectExt::Box(String(u"Stem4")));

categoryCell = workbook->GetCell(0, u"C8", ObjectExt::Box(String(u"Leaf8")));
chart->get_ChartData()->get_Categories()->Add(categoryCell);

auto series = chart->get_ChartData()->get_Series()->Add(ChartType::Sunburst);
series->get_Labels()->get_DefaultDataLabelFormat()->set_ShowCategoryName(true);
auto valueCell = workbook->GetCell(0, u"D1", ObjectExt::Box(4));
series->get_DataPoints()->AddDataPointForSunburstSeries(valueCell);
valueCell = workbook->GetCell(0, u"D2", ObjectExt::Box(5));
series->get_DataPoints()->AddDataPointForSunburstSeries(valueCell);
valueCell = workbook->GetCell(0, u"D3", ObjectExt::Box(3));
series->get_DataPoints()->AddDataPointForSunburstSeries(valueCell);
valueCell = workbook->GetCell(0, u"D4", ObjectExt::Box(6));
series->get_DataPoints()->AddDataPointForSunburstSeries(valueCell);
valueCell = workbook->GetCell(0, u"D5", ObjectExt::Box(9));
series->get_DataPoints()->AddDataPointForSunburstSeries(valueCell);
valueCell = workbook->GetCell(0, u"D6", ObjectExt::Box(9));
series->get_DataPoints()->AddDataPointForSunburstSeries(valueCell);
valueCell = workbook->GetCell(0, u"D7", ObjectExt::Box(4));
series->get_DataPoints()->AddDataPointForSunburstSeries(valueCell);
valueCell = workbook->GetCell(0, u"D8", ObjectExt::Box(3));
series->get_DataPoints()->AddDataPointForSunburstSeries(valueCell);

presentation->Save(u"Sunburst.pptx", SaveFormat::Pptx);
Il risultato:

Crea grafici a istogramma
Gli istogrammi mostrano come i valori numerici sono distribuiti tra intervalli (bin). Per i report mensili sui tempi di elaborazione degli ordini, utilizza la stessa larghezza di bin e le stesse soglie per mantenere gli intervalli coerenti e rendere più facile il confronto delle distribuzioni.
Chiama il metodo dell’asse orizzontale set_AggregationType con una modalità da AxisAggregationType. set_BinWidth si applica solo a ByBinWidth; set_NumberOfBins si applica solo a ByNumberOfBins. Usa Automatic per consentire al grafico di scegliere i bin.
Usa una larghezza di bin fissa
Questo esempio raggruppa i tempi di elaborazione in intervalli di 10 minuti, con bin separati per tempi ≤ 10 minuti e > 40 minuti. Abilita questi bin con set_IsUnderflowBin e set_IsOverflowBin. Quando fornisci soglie esplicite tramite set_UnderflowBin e set_OverflowBin, chiama set_IsAutomaticUnderflowBin e set_IsAutomaticOverflowBin con false.
#include <system/array.h>
#include <system/shared_ptr.h>
#include <system/object_ext.h>
#include <system/string.h>
#include <DOM/Chart/AxisAggregationType.h>
#include <DOM/Chart/ChartType.h>
#include <DOM/Chart/IAxesManager.h>
#include <DOM/Chart/IAxis.h>
#include <DOM/Chart/IChartCategoryCollection.h>
#include <DOM/Chart/IChartData.h>
#include <DOM/Chart/IChartDataCell.h>
#include <DOM/Chart/IChartDataPoint.h>
#include <DOM/Chart/IChartDataPointCollection.h>
#include <DOM/Chart/IChartDataWorkbook.h>
#include <DOM/Chart/IChartSeries.h>
#include <DOM/Chart/IChartSeriesCollection.h>
#include <DOM/Chart/IFormat.h>
#include <DOM/IChart.h>
#include <DOM/IColorFormat.h>
#include <DOM/IFillFormat.h>
#include <DOM/ILineFillFormat.h>
#include <DOM/ILineFormat.h>
#include <DOM/IShapeCollection.h>
#include <DOM/ISlide.h>
#include <DOM/Presentation.h>
#include <Export/SaveFormat.h>

using namespace System;
using namespace Aspose::Slides;
using namespace Aspose::Slides::Charts;
using namespace Aspose::Slides::Export;

auto presentation = MakeObject<Presentation>();
auto slide = presentation->get_Slide(0);

auto chart = slide->get_Shapes()->AddChart(ChartType::Histogram, 20, 20, 680, 200);

chart->set_HasLegend(false);
chart->set_HasTitle(false);

chart->get_ChartData()->get_Categories()->Clear();
chart->get_ChartData()->get_Series()->Clear();

auto workbook = chart->get_ChartData()->get_ChartDataWorkbook();
workbook->Clear(0);

auto series = chart->get_ChartData()->get_Series()->Add(ChartType::Histogram);
auto values = MakeArray<double>({ 5, 10, 10, 11, 15, 20, 20, 21, 25, 30, 30, 31, 35, 40, 40, 41, 50 });
for (auto i = 0; i < values->get_Length(); i++)
{
    auto valueCell = workbook->GetCell(0, i, 0, ObjectExt::Box(values[i]));
    series->get_DataPoints()->AddDataPointForHistogramSeries(valueCell);
}

auto axis = chart->get_Axes()->get_HorizontalAxis();
axis->set_AggregationType(AxisAggregationType::ByBinWidth);
axis->set_BinWidth(10);
axis->set_IsUnderflowBin(true);
axis->set_IsAutomaticUnderflowBin(false);
axis->set_UnderflowBin(10);
axis->set_IsOverflowBin(true);
axis->set_IsAutomaticOverflowBin(false);
axis->set_OverflowBin(40);

presentation->Save(u"Histogram-bin-width.pptx", SaveFormat::Pptx);
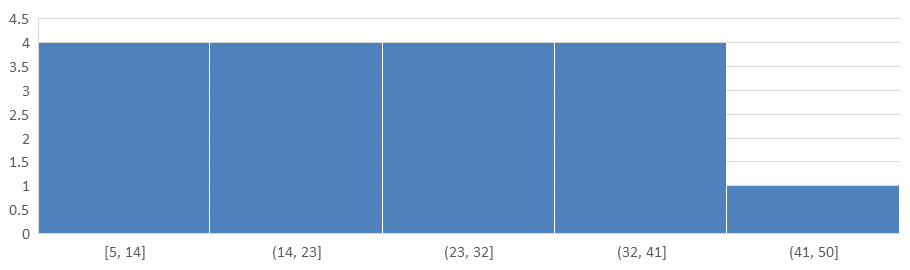
La presentazione visualizzata in PowerPoint mostra conteggi di bin 3, 4, 4, 4 e 2. Il bin di underflow include 5, 10, 10, quindi la sua soglia è inclusiva. Il bin di overflow include solo 41, 50, quindi la sua soglia è esclusiva; entrambi i valori uguali a 40 rimangono nell’intervallo precedente. I bin interni contengono valori superiori al loro limite inferiore e minori o uguali al loro limite superiore.

Specifica il numero di bin
Per un livello di dettaglio fisso anziché intervalli fissi, richiedi cinque bin per gli stessi dati. Questo esempio lascia i bin di underflow e overflow disabilitati. Il grafico determina la larghezza dai dati, quindi i confini possono variare tra i report.
#include <system/array.h>
#include <system/shared_ptr.h>
#include <system/object_ext.h>
#include <system/string.h>
#include <DOM/Chart/AxisAggregationType.h>
#include <DOM/Chart/ChartType.h>
#include <DOM/Chart/IAxesManager.h>
#include <DOM/Chart/IAxis.h>
#include <DOM/Chart/IChartCategoryCollection.h>
#include <DOM/Chart/IChartData.h>
#include <DOM/Chart/IChartDataCell.h>
#include <DOM/Chart/IChartDataPoint.h>
#include <DOM/Chart/IChartDataPointCollection.h>
#include <DOM/Chart/IChartDataWorkbook.h>
#include <DOM/Chart/IChartSeries.h>
#include <DOM/Chart/IChartSeriesCollection.h>
#include <DOM/Chart/IFormat.h>
#include <DOM/IChart.h>
#include <DOM/IColorFormat.h>
#include <DOM/IFillFormat.h>
#include <DOM/ILineFillFormat.h>
#include <DOM/ILineFormat.h>
#include <DOM/IShapeCollection.h>
#include <DOM/ISlide.h>
#include <DOM/Presentation.h>
#include <Export/SaveFormat.h>

using namespace System;
using namespace Aspose::Slides;
using namespace Aspose::Slides::Charts;
using namespace Aspose::Slides::Export;

auto presentation = MakeObject<Presentation>();
auto slide = presentation->get_Slide(0);

auto chart = slide->get_Shapes()->AddChart(ChartType::Histogram, 20, 20, 680, 200);

chart->set_HasLegend(false);
chart->set_HasTitle(false);

chart->get_ChartData()->get_Categories()->Clear();
chart->get_ChartData()->get_Series()->Clear();

auto workbook = chart->get_ChartData()->get_ChartDataWorkbook();
workbook->Clear(0);

auto series = chart->get_ChartData()->get_Series()->Add(ChartType::Histogram);
auto values = MakeArray<double>({ 5, 10, 10, 11, 15, 20, 20, 21, 25, 30, 30, 31, 35, 40, 40, 41, 50 });
for (auto i = 0; i < values->get_Length(); i++)
{
    auto valueCell = workbook->GetCell(0, i, 0, ObjectExt::Box(values[i]));
    series->get_DataPoints()->AddDataPointForHistogramSeries(valueCell);
}

auto axis = chart->get_Axes()->get_HorizontalAxis();
axis->set_AggregationType(AxisAggregationType::ByNumberOfBins);
axis->set_NumberOfBins(5);

presentation->Save(u"Histogram-bin-count.pptx", SaveFormat::Pptx);
I cinque bin hanno conteggi di 4, 4, 4, 4 e 1. Confronta questa distribuzione con il risultato a larghezza fissa sopra: i valori di input sono identici, ma i confini differiscono.
Crea grafici radar
Questo esempio utilizza AddChart per creare un grafico radar con le serie e le categorie predefinite, quindi salva la presentazione come PPTX.
#include <system/shared_ptr.h>
#include <DOM/Chart/ChartType.h>
#include <DOM/Chart/IChartCategoryCollection.h>
#include <DOM/Chart/IChartData.h>
#include <DOM/Chart/IChartSeriesCollection.h>
#include <DOM/Chart/IFormat.h>
#include <DOM/IChart.h>
#include <DOM/IColorFormat.h>
#include <DOM/IFillFormat.h>
#include <DOM/ILineFillFormat.h>
#include <DOM/ILineFormat.h>
#include <DOM/IShapeCollection.h>
#include <DOM/ISlide.h>
#include <DOM/Presentation.h>
#include <Export/SaveFormat.h>

using namespace System;
using namespace Aspose::Slides;
using namespace Aspose::Slides::Charts;
using namespace Aspose::Slides::Export;

auto presentation = MakeObject<Presentation>();
auto slide = presentation->get_Slide(0);

slide->get_Shapes()->AddChart(ChartType::Radar, 20, 20, 500, 300);

presentation->Save(u"Radar-chart.pptx", SaveFormat::Pptx);
Il risultato:

Crea grafici a più categorie
I grafici a più categorie visualizzano dati che coinvolgono più raggruppamenti categorici, permettendo di confrontare i valori attraverso più dimensioni simultaneamente. Sono particolarmente utili quando è necessario analizzare tendenze e relazioni in set di dati complessi e multilivello.
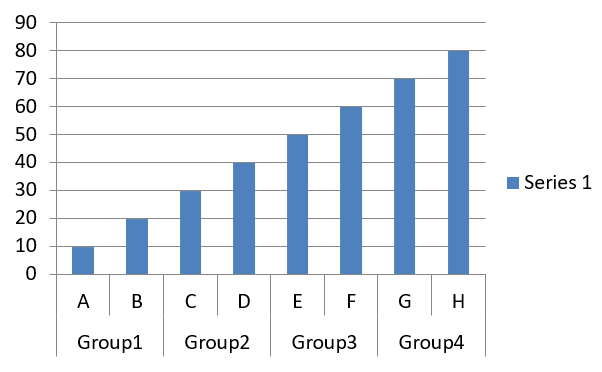
Questo esempio crea un grafico a colonne raggruppate con otto categorie disposte in quattro coppie. Il metodo SetGroupingItem assegna a ciascuna coppia un’etichetta condivisa al livello di raggruppamento 1, producendo un asse delle categorie con etichette sia individuali sia di gruppo.
#include <system/shared_ptr.h>
#include <system/object_ext.h>
#include <system/string.h>
#include <DOM/Chart/ChartType.h>
#include <DOM/Chart/IChartCategory.h>
#include <DOM/Chart/IChartCategoryCollection.h>
#include <DOM/Chart/IChartCategoryLevelsManager.h>
#include <DOM/Chart/IChartData.h>
#include <DOM/Chart/IChartDataCell.h>
#include <DOM/Chart/IChartDataPoint.h>
#include <DOM/Chart/IChartDataPointCollection.h>
#include <DOM/Chart/IChartDataWorkbook.h>
#include <DOM/Chart/IChartSeries.h>
#include <DOM/Chart/IChartSeriesCollection.h>
#include <DOM/Chart/IFormat.h>
#include <DOM/IChart.h>
#include <DOM/IColorFormat.h>
#include <DOM/IFillFormat.h>
#include <DOM/ILineFillFormat.h>
#include <DOM/ILineFormat.h>
#include <DOM/IShapeCollection.h>
#include <DOM/ISlide.h>
#include <DOM/Presentation.h>
#include <Export/SaveFormat.h>

using namespace System;
using namespace Aspose::Slides;
using namespace Aspose::Slides::Charts;
using namespace Aspose::Slides::Export;

auto presentation = MakeObject<Presentation>();
auto slide = presentation->get_Slide(0);

auto chart = slide->get_Shapes()->AddChart(ChartType::ClusteredColumn, 20, 20, 500, 300);

chart->get_ChartData()->get_Series()->Clear();
chart->get_ChartData()->get_Categories()->Clear();

auto workbook = chart->get_ChartData()->get_ChartDataWorkbook();
workbook->Clear(0);

auto worksheetIndex = 0;

auto categoryCell = workbook->GetCell(0, u"c2", ObjectExt::Box(String(u"A")));
auto category = chart->get_ChartData()->get_Categories()->Add(categoryCell);
category->get_GroupingLevels()->SetGroupingItem(1, ObjectExt::Box(String(u"Group1")));
categoryCell = workbook->GetCell(0, u"c3", ObjectExt::Box(String(u"B")));
category = chart->get_ChartData()->get_Categories()->Add(categoryCell);

categoryCell = workbook->GetCell(0, u"c4", ObjectExt::Box(String(u"C")));
category = chart->get_ChartData()->get_Categories()->Add(categoryCell);
category->get_GroupingLevels()->SetGroupingItem(1, ObjectExt::Box(String(u"Group2")));
categoryCell = workbook->GetCell(0, u"c5", ObjectExt::Box(String(u"D")));
category = chart->get_ChartData()->get_Categories()->Add(categoryCell);

categoryCell = workbook->GetCell(0, u"c6", ObjectExt::Box(String(u"E")));
category = chart->get_ChartData()->get_Categories()->Add(categoryCell);
category->get_GroupingLevels()->SetGroupingItem(1, ObjectExt::Box(String(u"Group3")));
categoryCell = workbook->GetCell(0, u"c7", ObjectExt::Box(String(u"F")));
category = chart->get_ChartData()->get_Categories()->Add(categoryCell);

categoryCell = workbook->GetCell(0, u"c8", ObjectExt::Box(String(u"G")));
category = chart->get_ChartData()->get_Categories()->Add(categoryCell);
category->get_GroupingLevels()->SetGroupingItem(1, ObjectExt::Box(String(u"Group4")));
categoryCell = workbook->GetCell(0, u"c9", ObjectExt::Box(String(u"H")));
category = chart->get_ChartData()->get_Categories()->Add(categoryCell);

auto seriesNameCell = workbook->GetCell(0, u"D1", ObjectExt::Box(String(u"Series 1")));
auto series = chart->get_ChartData()->get_Series()->Add(seriesNameCell, ChartType::ClusteredColumn);

auto valueCell = workbook->GetCell(worksheetIndex, u"D2", ObjectExt::Box(10));
series->get_DataPoints()->AddDataPointForBarSeries(valueCell);
valueCell = workbook->GetCell(worksheetIndex, u"D3", ObjectExt::Box(20));
series->get_DataPoints()->AddDataPointForBarSeries(valueCell);
valueCell = workbook->GetCell(worksheetIndex, u"D4", ObjectExt::Box(30));
series->get_DataPoints()->AddDataPointForBarSeries(valueCell);
valueCell = workbook->GetCell(worksheetIndex, u"D5", ObjectExt::Box(40));
series->get_DataPoints()->AddDataPointForBarSeries(valueCell);
valueCell = workbook->GetCell(worksheetIndex, u"D6", ObjectExt::Box(50));
series->get_DataPoints()->AddDataPointForBarSeries(valueCell);
valueCell = workbook->GetCell(worksheetIndex, u"D7", ObjectExt::Box(60));
series->get_DataPoints()->AddDataPointForBarSeries(valueCell);
valueCell = workbook->GetCell(worksheetIndex, u"D8", ObjectExt::Box(70));
series->get_DataPoints()->AddDataPointForBarSeries(valueCell);
valueCell = workbook->GetCell(worksheetIndex, u"D9", ObjectExt::Box(80));
series->get_DataPoints()->AddDataPointForBarSeries(valueCell);

presentation->Save(u"AsposeChart.pptx", SaveFormat::Pptx);
Il risultato:
Crea grafici cartografici
I grafici cartografici visualizzano dati geografici assegnando informazioni a posizioni specifiche come paesi, regioni o città. Sono particolarmente utili per analizzare tendenze regionali, dati demografici e distribuzioni spaziali in modo chiaro e coinvolgente.
Questo esempio utilizza AddChart per creare un grafico cartografico con i dati geografici predefiniti e lo salva per la visualizzazione in PowerPoint.
#include <system/shared_ptr.h>
#include <DOM/Chart/ChartType.h>
#include <DOM/Chart/IChartCategoryCollection.h>
#include <DOM/Chart/IChartData.h>
#include <DOM/Chart/IChartSeriesCollection.h>
#include <DOM/Chart/IFormat.h>
#include <DOM/IChart.h>
#include <DOM/IColorFormat.h>
#include <DOM/IFillFormat.h>
#include <DOM/ILineFillFormat.h>
#include <DOM/ILineFormat.h>
#include <DOM/IShapeCollection.h>
#include <DOM/ISlide.h>
#include <DOM/Presentation.h>
#include <Export/SaveFormat.h>

using namespace System;
using namespace Aspose::Slides;
using namespace Aspose::Slides::Charts;
using namespace Aspose::Slides::Export;

auto presentation = MakeObject<Presentation>();
auto slide = presentation->get_Slide(0);

auto chart = slide->get_Shapes()->AddChart(ChartType::Map, 20, 20, 500, 300);

presentation->Save(u"mapChart.pptx", SaveFormat::Pptx);
Il risultato:

Note
L’immagine sopra mostra la presentazione salvata aperta in PowerPoint. Aspose.Slides scrive correttamente il grafico cartografico e i suoi dati, ma non disegna i grafici cartografici da solo: quando una diapositiva contenente uno di questi è renderizzata in immagine o convertita in PDF o SVG, l’area del grafico risulta vuota. Le altre forme sulla stessa diapositiva non sono influenzate.Crea grafici combinati
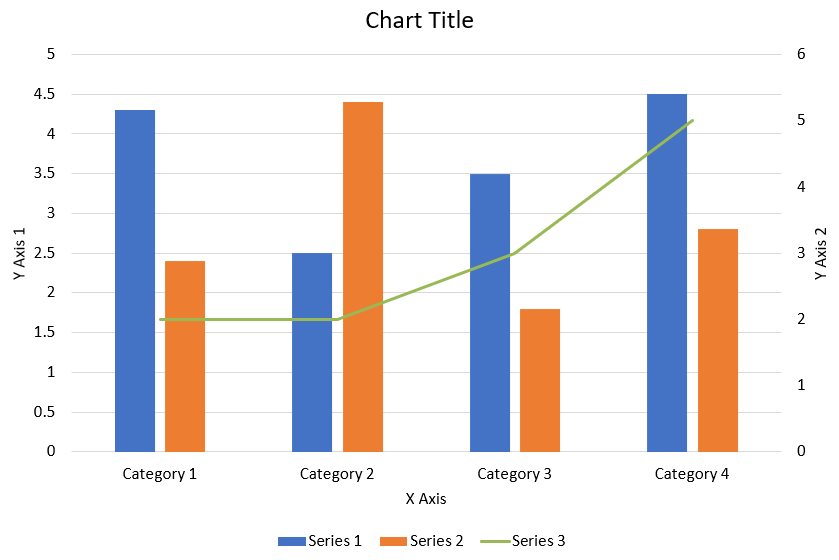
Questo esempio combina due serie a colonne raggruppate con una serie a linee su quattro categorie. Le colonne utilizzano l’asse verticale primario, mentre set_PlotOnSecondAxis posiziona la linea su un asse verticale secondario a destra. Le funzioni di supporto configurano il titolo, la leggenda, le etichette degli assi e le linee di griglia.
#include <DOM/Chart/IChartLinesFormat.h>
#include <DOM/Chart/IChartPortionFormat.h>
#include <DOM/Chart/IAxisFormat.h>
#include <system/shared_ptr.h>
#include <system/object_ext.h>
#include <system/string.h>
#include <drawing/color.h>
#include <DOM/Chart/AxisPositionType.h>
#include <DOM/Chart/ChartType.h>
#include <DOM/Chart/CrossesType.h>
#include <DOM/Chart/IAxesManager.h>
#include <DOM/Chart/IAxis.h>
#include <DOM/Chart/IChartCategoryCollection.h>
#include <DOM/Chart/IChartData.h>
#include <DOM/Chart/IChartDataCell.h>
#include <DOM/Chart/IChartDataPoint.h>
#include <DOM/Chart/IChartDataPointCollection.h>
#include <DOM/Chart/IChartDataWorkbook.h>
#include <DOM/Chart/IChartSeries.h>
#include <DOM/Chart/IChartSeriesCollection.h>
#include <DOM/Chart/IChartSeriesGroup.h>
#include <DOM/Chart/IChartSeriesGroupCollection.h>
#include <DOM/Chart/IChartTextFormat.h>
#include <DOM/Chart/IChartTitle.h>
#include <DOM/Chart/IFormat.h>
#include <DOM/Chart/ILegend.h>
#include <DOM/Chart/LegendPositionType.h>
#include <DOM/FillType.h>
#include <DOM/IChart.h>
#include <DOM/IColorFormat.h>
#include <DOM/IFillFormat.h>
#include <DOM/ILineFillFormat.h>
#include <DOM/ILineFormat.h>
#include <DOM/IParagraph.h>
#include <DOM/IParagraphCollection.h>
#include <DOM/IParagraphFormat.h>
#include <DOM/IPortionFormat.h>
#include <DOM/IShapeCollection.h>
#include <DOM/ISlide.h>
#include <DOM/ITextFrame.h>
#include <DOM/ITextFrameFormat.h>
#include <DOM/NullableBool.h>
#include <DOM/Presentation.h>
#include <Export/SaveFormat.h>

using namespace System;
using namespace System::Drawing;
using namespace Aspose::Slides;
using namespace Aspose::Slides::Charts;
using namespace Aspose::Slides::Export;

struct ComboChartExample
{
    static void CreateComboChart()
    {
        auto presentation = MakeObject<Presentation>();
        auto chart = CreateChartWithFirstSeries(presentation->get_Slide(0));

        AddSecondSeriesToChart(chart);
        AddThirdSeriesToChart(chart);

        SetPrimaryAxesFormat(chart);
        SetSecondaryAxesFormat(chart);

        presentation->Save(u"combo-chart.pptx", SaveFormat::Pptx);
    }

    static SharedPtr<IChart> CreateChartWithFirstSeries(SharedPtr<ISlide> slide)
    {
        auto chart = slide->get_Shapes()->AddChart(ChartType::ClusteredColumn, 50, 50, 600, 400);

        chart->set_HasTitle(true);
        chart->get_ChartTitle()->AddTextFrameForOverriding(u"Chart Title");
        chart->get_ChartTitle()->set_Overlay(false);
        auto portionFormat = chart->get_ChartTitle()->get_TextFrameForOverriding()->get_Paragraphs()->idx_get(0)->get_ParagraphFormat()->get_DefaultPortionFormat();
        portionFormat->set_FontBold(NullableBool::False);
        portionFormat->set_FontHeight(18.0f);

        chart->get_Legend()->set_Position(LegendPositionType::Bottom);
        chart->get_Legend()->get_TextFormat()->get_PortionFormat()->set_FontHeight(12.0f);

        chart->get_ChartData()->get_Series()->Clear();
        chart->get_ChartData()->get_Categories()->Clear();

        auto workbook = chart->get_ChartData()->get_ChartDataWorkbook();
        auto worksheetIndex = 0;

        auto categoryCell = workbook->GetCell(worksheetIndex, 1, 0, ObjectExt::Box(String(u"Category 1")));
        chart->get_ChartData()->get_Categories()->Add(categoryCell);
        categoryCell = workbook->GetCell(worksheetIndex, 2, 0, ObjectExt::Box(String(u"Category 2")));
        chart->get_ChartData()->get_Categories()->Add(categoryCell);
        categoryCell = workbook->GetCell(worksheetIndex, 3, 0, ObjectExt::Box(String(u"Category 3")));
        chart->get_ChartData()->get_Categories()->Add(categoryCell);
        categoryCell = workbook->GetCell(worksheetIndex, 4, 0, ObjectExt::Box(String(u"Category 4")));
        chart->get_ChartData()->get_Categories()->Add(categoryCell);

        auto seriesNameCell = workbook->GetCell(worksheetIndex, 0, 1, ObjectExt::Box(String(u"Series 1")));
        auto series = chart->get_ChartData()->get_Series()->Add(seriesNameCell, chart->get_Type());

        series->get_ParentSeriesGroup()->set_Overlap(-25);
        series->get_ParentSeriesGroup()->set_GapWidth(220);

        auto valueCell = workbook->GetCell(worksheetIndex, 1, 1, ObjectExt::Box(4.3));
        series->get_DataPoints()->AddDataPointForBarSeries(valueCell);
        valueCell = workbook->GetCell(worksheetIndex, 2, 1, ObjectExt::Box(2.5));
        series->get_DataPoints()->AddDataPointForBarSeries(valueCell);
        valueCell = workbook->GetCell(worksheetIndex, 3, 1, ObjectExt::Box(3.5));
        series->get_DataPoints()->AddDataPointForBarSeries(valueCell);
        valueCell = workbook->GetCell(worksheetIndex, 4, 1, ObjectExt::Box(4.5));
        series->get_DataPoints()->AddDataPointForBarSeries(valueCell);

        return chart;
    }

    static void AddSecondSeriesToChart(SharedPtr<IChart> chart)
    {
        auto workbook = chart->get_ChartData()->get_ChartDataWorkbook();
        const int worksheetIndex = 0;

        auto seriesNameCell = workbook->GetCell(worksheetIndex, 0, 2, ObjectExt::Box(String(u"Series 2")));
        auto series = chart->get_ChartData()->get_Series()->Add(seriesNameCell, ChartType::ClusteredColumn);

        series->get_ParentSeriesGroup()->set_Overlap(-25);
        series->get_ParentSeriesGroup()->set_GapWidth(220);

        auto valueCell = workbook->GetCell(worksheetIndex, 1, 2, ObjectExt::Box(2.4));
        series->get_DataPoints()->AddDataPointForBarSeries(valueCell);
        valueCell = workbook->GetCell(worksheetIndex, 2, 2, ObjectExt::Box(4.4));
        series->get_DataPoints()->AddDataPointForBarSeries(valueCell);
        valueCell = workbook->GetCell(worksheetIndex, 3, 2, ObjectExt::Box(1.8));
        series->get_DataPoints()->AddDataPointForBarSeries(valueCell);
        valueCell = workbook->GetCell(worksheetIndex, 4, 2, ObjectExt::Box(2.8));
        series->get_DataPoints()->AddDataPointForBarSeries(valueCell);
    }

    static void AddThirdSeriesToChart(SharedPtr<IChart> chart)
    {
        auto workbook = chart->get_ChartData()->get_ChartDataWorkbook();
        const int worksheetIndex = 0;

        auto seriesNameCell = workbook->GetCell(worksheetIndex, 0, 3, ObjectExt::Box(String(u"Series 3")));
        auto series = chart->get_ChartData()->get_Series()->Add(seriesNameCell, ChartType::Line);

        auto valueCell = workbook->GetCell(worksheetIndex, 1, 3, ObjectExt::Box(2.0));
        series->get_DataPoints()->AddDataPointForLineSeries(valueCell);
        valueCell = workbook->GetCell(worksheetIndex, 2, 3, ObjectExt::Box(2.0));
        series->get_DataPoints()->AddDataPointForLineSeries(valueCell);
        valueCell = workbook->GetCell(worksheetIndex, 3, 3, ObjectExt::Box(3.0));
        series->get_DataPoints()->AddDataPointForLineSeries(valueCell);
        valueCell = workbook->GetCell(worksheetIndex, 4, 3, ObjectExt::Box(5.0));
        series->get_DataPoints()->AddDataPointForLineSeries(valueCell);

        series->set_PlotOnSecondAxis(true);
    }

    static void SetPrimaryAxesFormat(SharedPtr<IChart> chart)
    {
        auto horizontalAxis = chart->get_Axes()->get_HorizontalAxis();
        horizontalAxis->get_TextFormat()->get_PortionFormat()->set_FontHeight(12.0f);
        horizontalAxis->get_Format()->get_Line()->get_FillFormat()->set_FillType(FillType::NoFill);

        SetAxisTitle(horizontalAxis, u"X Axis");

        auto verticalAxis = chart->get_Axes()->get_VerticalAxis();
        verticalAxis->get_TextFormat()->get_PortionFormat()->set_FontHeight(12.0f);
        verticalAxis->get_Format()->get_Line()->get_FillFormat()->set_FillType(FillType::NoFill);

        SetAxisTitle(verticalAxis, u"Y Axis 1");

        auto majorGridLinesFormat = verticalAxis->get_MajorGridLinesFormat()->get_Line()->get_FillFormat();
        majorGridLinesFormat->set_FillType(FillType::Solid);
        majorGridLinesFormat->get_SolidFillColor()->set_Color(Color::FromArgb(217, 217, 217));
    }

    static void SetSecondaryAxesFormat(SharedPtr<IChart> chart)
    {
        auto secondaryHorizontalAxis = chart->get_Axes()->get_SecondaryHorizontalAxis();
        secondaryHorizontalAxis->set_Position(AxisPositionType::Bottom);
        secondaryHorizontalAxis->set_CrossType(CrossesType::Maximum);
        secondaryHorizontalAxis->set_IsVisible(false);
        secondaryHorizontalAxis->get_MajorGridLinesFormat()->get_Line()->get_FillFormat()->set_FillType(FillType::NoFill);
        secondaryHorizontalAxis->get_MinorGridLinesFormat()->get_Line()->get_FillFormat()->set_FillType(FillType::NoFill);

        auto secondaryVerticalAxis = chart->get_Axes()->get_SecondaryVerticalAxis();
        secondaryVerticalAxis->set_Position(AxisPositionType::Right);
        secondaryVerticalAxis->get_TextFormat()->get_PortionFormat()->set_FontHeight(12.0f);
        secondaryVerticalAxis->get_Format()->get_Line()->get_FillFormat()->set_FillType(FillType::NoFill);
        secondaryVerticalAxis->get_MajorGridLinesFormat()->get_Line()->get_FillFormat()->set_FillType(FillType::NoFill);
        secondaryVerticalAxis->get_MinorGridLinesFormat()->get_Line()->get_FillFormat()->set_FillType(FillType::NoFill);

        SetAxisTitle(secondaryVerticalAxis, u"Y Axis 2");
    }

    static void SetAxisTitle(SharedPtr<IAxis> axis, String axisTitle)
    {
        axis->set_HasTitle(true);
        axis->get_Title()->set_Overlay(false);
        auto titlePortionFormat = axis->get_Title()->AddTextFrameForOverriding(axisTitle)->get_Paragraphs()->idx_get(0)->get_ParagraphFormat()->get_DefaultPortionFormat();
        titlePortionFormat->set_FontBold(NullableBool::False);
        titlePortionFormat->set_FontHeight(12.0f);
    }
};

ComboChartExample::CreateComboChart();
Aggiorna i grafici
Aspose.Slides per C++ consente di aggiornare i grafici di PowerPoint modificando i dati, la formattazione e lo stile. Questa funzionalità semplifica il mantenimento delle presentazioni aggiornate con contenuti dinamici e garantisce che i grafici riflettano accuratamente i dati e gli standard visuali correnti.
Questo esempio aggiorna il grafico denominato “My chart” nella prima diapositiva di una presentazione esistente. Richiede due serie di colonne con tre punti dati ciascuna, con etichette di categoria nella colonna A e nomi delle serie nella prima riga del primo foglio di lavoro. L’esempio utilizza GetCell per modificare le celle del workbook, aggiorna i valori delle serie, aggiunge una terza serie e cambia il tipo di grafico in cilindri raggruppati tramite set_Type.
#include <system/shared_ptr.h>
#include <system/object_ext.h>
#include <system/string.h>
#include <DOM/Chart/ChartType.h>
#include <DOM/Chart/IChartCategoryCollection.h>
#include <DOM/Chart/IChartData.h>
#include <DOM/Chart/IChartDataCell.h>
#include <DOM/Chart/IChartDataPoint.h>
#include <DOM/Chart/IChartDataPointCollection.h>
#include <DOM/Chart/IChartDataWorkbook.h>
#include <DOM/Chart/IChartSeries.h>
#include <DOM/Chart/IChartSeriesCollection.h>
#include <DOM/Chart/IDoubleChartValue.h>
#include <DOM/Chart/IFormat.h>
#include <DOM/IChart.h>
#include <DOM/IColorFormat.h>
#include <DOM/IFillFormat.h>
#include <DOM/ILineFillFormat.h>
#include <DOM/ILineFormat.h>
#include <DOM/IShape.h>
#include <DOM/IShapeCollection.h>
#include <DOM/ISlide.h>
#include <DOM/Presentation.h>
#include <Export/SaveFormat.h>

using namespace System;
using namespace Aspose::Slides;
using namespace Aspose::Slides::Charts;
using namespace Aspose::Slides::Export;

const String chartName = u"My chart";

auto presentation = MakeObject<Presentation>(u"ExistingChart.pptx");
auto slide = presentation->get_Slide(0);

for (auto shape : slide->get_Shapes())
{
    auto chart = System::DynamicCast<IChart>(shape);
    if (chart != nullptr && chart->get_Name() == chartName)
    {
        auto worksheetIndex = 0;

        auto workbook = chart->get_ChartData()->get_ChartDataWorkbook();

        workbook->GetCell(worksheetIndex, 1, 0, ObjectExt::Box(String(u"Modified Category 1")));
        workbook->GetCell(worksheetIndex, 2, 0, ObjectExt::Box(String(u"Modified Category 2")));

        auto series = chart->get_ChartData()->get_Series()->idx_get(0);

        workbook->GetCell(worksheetIndex, 0, 1, ObjectExt::Box(String(u"New_Series 1")));
        series->get_DataPoints()->idx_get(0)->get_Value()->set_Data(ObjectExt::Box(90));
        series->get_DataPoints()->idx_get(1)->get_Value()->set_Data(ObjectExt::Box(123));
        series->get_DataPoints()->idx_get(2)->get_Value()->set_Data(ObjectExt::Box(44));

        series = chart->get_ChartData()->get_Series()->idx_get(1);

        workbook->GetCell(worksheetIndex, 0, 2, ObjectExt::Box(String(u"New_Series 2")));
        series->get_DataPoints()->idx_get(0)->get_Value()->set_Data(ObjectExt::Box(23));
        series->get_DataPoints()->idx_get(1)->get_Value()->set_Data(ObjectExt::Box(67));
        series->get_DataPoints()->idx_get(2)->get_Value()->set_Data(ObjectExt::Box(99));

        auto seriesNameCell = workbook->GetCell(worksheetIndex, 0, 3, ObjectExt::Box(String(u"Series 3")));
        series = chart->get_ChartData()->get_Series()->Add(seriesNameCell, chart->get_Type());

        auto valueCell = workbook->GetCell(worksheetIndex, 1, 3, ObjectExt::Box(20));
        series->get_DataPoints()->AddDataPointForBarSeries(valueCell);
        valueCell = workbook->GetCell(worksheetIndex, 2, 3, ObjectExt::Box(50));
        series->get_DataPoints()->AddDataPointForBarSeries(valueCell);
        valueCell = workbook->GetCell(worksheetIndex, 3, 3, ObjectExt::Box(30));
        series->get_DataPoints()->AddDataPointForBarSeries(valueCell);

        chart->set_Type(ChartType::ClusteredCylinder);
    }
}

presentation->Save(u"AsposeChartModified.pptx", SaveFormat::Pptx);
Imposta l’intervallo di dati per un grafico
Per ispezionare l’intervallo già utilizzato da un grafico esistente, vedi Retrieve a Chart’s Data Range.
Aspose.Slides per C++ offre la flessibilità di definire un intervallo di dati specifico da un foglio di lavoro come origine per i dati del tuo grafico. Ciò consente di mappare direttamente una parte del foglio di lavoro al grafico, controllando quali celle contribuiscono alle serie e alle categorie del grafico. Di conseguenza, puoi aggiornare e sincronizzare facilmente i grafici con le ultime modifiche dei dati nel foglio di lavoro, assicurando che le presentazioni PowerPoint riflettano informazioni attuali e accurate.
Questo esempio utilizza SetRange per impostare la fonte dati del grafico denominato “My chart” nella prima diapositiva di una presentazione esistente su Sheet1!A1:B4. Il workbook del grafico deve contenere quel foglio di lavoro e un intervallo popolato con un’intestazione di serie nella prima riga, etichette di categoria nella colonna A e tre valori nella colonna B.
#include <system/shared_ptr.h>
#include <DOM/Chart/ChartType.h>
#include <DOM/Chart/IChartCategoryCollection.h>
#include <DOM/Chart/IChartData.h>
#include <DOM/Chart/IChartSeriesCollection.h>
#include <DOM/Chart/IFormat.h>
#include <DOM/IChart.h>
#include <DOM/IColorFormat.h>
#include <DOM/IFillFormat.h>
#include <DOM/ILineFillFormat.h>
#include <DOM/ILineFormat>
#include <DOM/IShape.h>
#include <DOM/IShapeCollection.h>
#include <DOM/ISlide.h>
#include <DOM/Presentation.h>
#include <Export/SaveFormat.h>

using namespace System;
using namespace Aspose::Slides;
using namespace Aspose::Slides::Charts;
using namespace Aspose::Slides::Export;

const String chartName = u"My chart";

auto presentation = MakeObject<Presentation>(u"ExistingChart.pptx");
auto
Usa i marcatori predefiniti nei grafici
Quando utilizzi i marcatori predefiniti nei grafici, ogni serie ottiene automaticamente un simbolo di marcatore predefinito diverso.
Questo esempio utilizza AddChart per creare un grafico con due serie a linee e una leggenda. Le impostazioni get_Marker mantengono i simboli di marcatore assegnati automaticamente. La prima serie include un valore negativo e un valore mancante, rappresentato da nullptr, mentre la seconda ha un valore per ogni categoria.
#include <system/shared_ptr.h>
#include <system/object_ext.h>
#include <system/string.h>
#include <DOM/Chart/ChartType.h>
#include <DOM/Chart/IChartCategoryCollection.h>
#include <DOM/Chart/IChartData.h>
#include <DOM/Chart/IChartDataCell.h>
#include <DOM/Chart/IChartDataPoint.h>
#include <DOM/Chart/IChartDataPointCollection.h>
#include <DOM/Chart/IChartDataWorkbook.h>
#include <DOM/Chart/IChartSeries.h>
#include <DOM/Chart/IChartSeriesCollection.h>
#include <DOM/Chart/IChartTextFormat.h>
#include <DOM/Chart/IFormat.h>
#include <DOM/Chart/ILegend.h>
#include <DOM/Chart/IMarker.h>
#include <DOM/IChart.h>
#include <DOM/IColorFormat.h>
#include <DOM/IFillFormat.h>
#include <DOM/ILineFillFormat.h>
#include <DOM/ILineFormat.h>
#include <DOM/IPortionFormat.h>
#include <DOM/IShapeCollection.h>
#include <DOM/ISlide.h>
#include <DOM/Presentation.h>
#include <Export/SaveFormat.h>

using namespace System;
using namespace Aspose::Slides;
using namespace Aspose::Slides::Charts;
using namespace Aspose::Slides::Export;

auto presentation = MakeObject<Presentation>();
auto slide = presentation->get_Slide(0);

auto chart = slide->get_Shapes()->AddChart(ChartType::LineWithMarkers, 10, 10, 400, 400);

chart->get_ChartData()->get_Series()->Clear();
chart->get_ChartData()->get_Categories()->Clear();

auto workbook = chart->get_ChartData()->get_ChartDataWorkbook();

auto seriesNameCell = workbook->GetCell(0, 0, 1, ObjectExt::Box(String(u"Series 1")));
auto series = chart->get_ChartData()->get_Series()->Add(seriesNameCell, chart->get_Type());

auto categoryCell = workbook->GetCell(0, 1, 0, ObjectExt::Box(String(u"C1")));
chart->get_ChartData()->get_Categories()->Add(categoryCell);
auto valueCell = workbook->GetCell(0, 1, 1, ObjectExt::Box(24));
series->get_DataPoints()->AddDataPointForLineSeries(valueCell);

categoryCell = workbook->GetCell(0, 2, 0, ObjectExt::Box(String(u"C2")));
chart->get_ChartData()->get_Categories()->Add(categoryCell);
valueCell = workbook->GetCell(0, 2, 1, ObjectExt::Box(23));
series->get_DataPoints()->AddDataPointForLineSeries(valueCell);

categoryCell = workbook->GetCell(0, 3, 0, ObjectExt::Box(String(u"C3")));
chart->get_ChartData()->get_Categories()->Add(categoryCell);
valueCell = workbook->GetCell(0, 3, 1, ObjectExt::Box(-10));
series->get_DataPoints()->AddDataPointForLineSeries(valueCell);

categoryCell = workbook->GetCell(0, 4, 0, ObjectExt::Box(String(u"C4")));
chart->get_ChartData()->get_Categories()->Add(categoryCell);
valueCell = workbook->GetCell(0, 4, 1, nullptr);
series->get_DataPoints()->AddDataPointForLineSeries(valueCell);

seriesNameCell = workbook->GetCell(0, 0, 2, ObjectExt::Box(String(u"Series 2")));
auto secondSeries = chart->get_ChartData()->get_Series()->Add(seriesNameCell, chart->get_Type());

valueCell = workbook->GetCell(0, 1, 2, ObjectExt::Box(30));
secondSeries->get_DataPoints()->AddDataPointForLineSeries(valueCell);
valueCell = workbook->GetCell(0, 2, 2, ObjectExt::Box(10));
secondSeries->get_DataPoints()->AddDataPointForLineSeries(valueCell);
valueCell = workbook->GetCell(0, 3, 2, ObjectExt::Box(60));
secondSeries->get_DataPoints()->AddDataPointForLineSeries(valueCell);
valueCell = workbook->GetCell(0, 4, 2, ObjectExt::Box(40));
secondSeries->get_DataPoints()->AddDataPointForLineSeries(valueCell);

chart->set_HasLegend(true);
chart->get_Legend()->set_Overlay(false);

presentation->Save(u"DefaultMarkersInChart.pptx", SaveFormat::Pptx);
FAQ
Quali tipi di grafico sono supportati da Aspose.Slides per C++?
Aspose.Slides per C++ supporta un’ampia gamma di tipi di grafico, tra cui a barre, a linee, a torta, ad area, a dispersione, istogramma, radar e molti altri. Questa flessibilità ti consente di scegliere il tipo di grafico più appropriato per le tue esigenze di visualizzazione dei dati.
Come aggiungo un nuovo grafico a una diapositiva?
Per aggiungere un grafico, crea innanzitutto un’istanza della classe Presentation e recupera la diapositiva desiderata usando il suo indice, quindi chiama il metodo per aggiungere un grafico, specificando il tipo di grafico e i dati iniziali. Questo processo integra il grafico direttamente nella tua presentazione.
Come posso aggiornare i dati visualizzati in un grafico?
Puoi aggiornare i dati di un grafico accedendo al suo workbook dei dati (IChartDataWorkbook), cancellando le serie e le categorie predefinite e aggiungendo i tuoi dati personalizzati. Questo consente di aggiornare programmaticamente il grafico per riflettere gli ultimi dati.
È possibile personalizzare l’aspetto del grafico?
Sì, Aspose.Slides per C++ offre ampie opzioni di personalizzazione. Puoi modificare colori, caratteri, etichette, leggende e altri elementi di formattazione per adattare l’aspetto del grafico ai requisiti di design specifici.