
Tworzenie lub aktualizacja wykresów w prezentacjach PowerPoint w C++
Przegląd
Ten artykuł dostarcza kompleksowego przewodnika, jak tworzyć i dostosowywać wykresy przy użyciu Aspose.Slides. Nauczysz się, jak programowo dodać wykres do slajdu, wypełnić go danymi oraz zastosować różne opcje formatowania, aby spełnić określone wymagania projektowe. W całym artykule szczegółowe przykłady kodu ilustrują każdy krok, od inicjalizacji obiektu Presentation i wykresu po konfigurację serii, osi i legend. Postępując zgodnie z tym przewodnikiem, zdobędziesz solidną wiedzę na temat integracji dynamicznego generowania wykresów w aplikacjach, usprawniając proces tworzenia prezentacji opartych na danych.
Utworzenie wykresu
Wykresy pomagają szybko wizualizować dane i uzyskać wnioski, które nie są od razu oczywiste z tabeli lub arkusza kalkulacyjnego.
Dlaczego tworzyć wykresy?
Używając wykresów, możesz
- agregować, kondensować lub podsumowywać duże ilości danych na jednym slajdzie prezentacji
- uwidaczniać wzorce i trendy w danych
- wyciągać wnioski o kierunku i dynamice danych w czasie lub w odniesieniu do określonej jednostki miary
- wykrywać odstające wartości, anomalie, odchylenia, błędy, niespójne dane itp.
- komunikować lub prezentować złożone dane
W programie PowerPoint możesz tworzyć wykresy za pomocą funkcji wstawiania, która udostępnia szablony używane do projektowania wielu typów wykresów. Korzystając z Aspose.Slides, możesz tworzyć standardowe wykresy (oparte na popularnych typach) oraz wykresy niestandardowe.
Utworzenie standardowych wykresów
- Utwórz instancję klasy Presentation.
- Uzyskaj referencję do slajdu poprzez jego indeks.
- Dodaj wykres z danymi i określ preferowany typ wykresu.
- Dodaj tytuł wykresu.
- Uzyskaj dostęp do arkusza danych wykresu.
- Wyczyść wszystkie domyślne serie i kategorie.
- Dodaj nowe serie i kategorie.
- Dodaj nowe dane wykresu dla serii.
- Dodaj kolor wypełnienia dla serii wykresu.
- Dodaj etykiety dla serii wykresu.
- Zapisz zmodyfikowaną prezentację jako plik PPTX.
Ten kod C++ pokazuje, jak utworzyć standardowy wykres:
#include <DOM/Chart/ChartType.h>
#include <DOM/Chart/IChartCategoryCollection.h>
#include <DOM/Chart/IChartData.h>
#include <DOM/Chart/IChartDataPoint.h>
#include <DOM/Chart/IChartDataPointCollection.h>
#include <DOM/Chart/IChartDataWorkbook.h>
#include <DOM/Chart/IChartSeries.h>
#include <DOM/Chart/IChartSeriesCollection.h>
#include <DOM/Chart/IChartTitle.h>
#include <DOM/Chart/IDataLabel.h>
#include <DOM/Chart/IDataLabelFormat.h>
#include <DOM/Chart/IFormat.h>
#include <DOM/FillType.h>
#include <DOM/IChart.h>
#include <DOM/IColorFormat.h>
#include <DOM/IFillFormat.h>
#include <DOM/IShapeCollection.h>
#include <DOM/ISlide.h>
#include <DOM/ISlideCollection.h>
#include <DOM/ITextFrame.h>
#include <DOM/ITextFrameFormat.h>
#include <DOM/NullableBool.h>
#include <DOM/Presentation.h>
#include <Export/SaveFormat.h>
#include <drawing/color.h>
#include <system/string.h>
using namespace Aspose::Slides;
using namespace Aspose::Slides::Charts;
using namespace Aspose::Slides::Export;
using namespace System;
using namespace System::Drawing;

// Ścieżka do katalogu dokumentów.
	const String outPath = u"../out/NormalCharts_out.pptx";

	// Tworzy instancję klasy prezentacji, która reprezentuje plik PPTX
	SharedPtr<Presentation> pres = MakeObject<Presentation>();

	// Uzyskuje dostęp do pierwszego slajdu
	SharedPtr<ISlide> slide = pres->get_Slides()->idx_get(0);

	// Dodaje wykres z domyślnymi danymi
	SharedPtr<IChart> chart = slide->get_Shapes()->AddChart(Aspose::Slides::Charts::ChartType::ClusteredColumn, 0, 0, 500, 500);


	// Ustawia indeks arkusza danych wykresu
	int defaultWorksheetIndex = 0;

	// Pobiera arkusz danych wykresu
	SharedPtr<IChartDataWorkbook> fact = chart->get_ChartData()->get_ChartDataWorkbook();

	// Ustawia tytuł wykresu
	chart->get_ChartTitle()->AddTextFrameForOverriding(u"Sample Title");
	chart->get_ChartTitle()->get_TextFrameForOverriding()->get_TextFrameFormat()->set_CenterText ( NullableBool::True);
	chart->get_ChartTitle()->set_Height(20);
	chart->set_HasTitle( true);

	// Usuwa domyślnie wygenerowane serie i kategorie
	chart->get_ChartData()->get_Series()->Clear();
	chart->get_ChartData()->get_Categories()->Clear();
	int s = chart->get_ChartData()->get_Series()->get_Count();
	s = chart->get_ChartData()->get_Categories()->get_Count();


	// Dodaje nową serię
	chart->get_ChartData()->get_Series()->Add(fact->GetCell(defaultWorksheetIndex, 0, 1, ObjectExt::Box<System::String>(u"Series 1")), chart->get_Type());
	chart->get_ChartData()->get_Series()->Add(fact->GetCell(defaultWorksheetIndex, 0, 2, ObjectExt::Box<System::String>(u"Series 2")), chart->get_Type());

	// Dodaje kategorie
	chart->get_ChartData()->get_Categories()->Add(fact->GetCell(defaultWorksheetIndex, 1, 0, ObjectExt::Box<System::String>(u"Caetegoty 1")));
	chart->get_ChartData()->get_Categories()->Add(fact->GetCell(defaultWorksheetIndex, 2, 0, ObjectExt::Box<System::String>(u"Caetegoty 2")));
	chart->get_ChartData()->get_Categories()->Add(fact->GetCell(defaultWorksheetIndex, 3, 0, ObjectExt::Box<System::String>(u"Caetegoty 3")));


	// Pobiera pierwszą serię wykresu
	SharedPtr<IChartSeries> series = chart->get_ChartData()->get_Series()->idx_get(0);

	// Wypełnia dane serii
	series->get_DataPoints()->AddDataPointForBarSeries(fact->GetCell(defaultWorksheetIndex, 1, 1, ObjectExt::Box<double>(20)));
	series->get_DataPoints()->AddDataPointForBarSeries(fact->GetCell(defaultWorksheetIndex, 2, 1, ObjectExt::Box<double>(50)));
	series->get_DataPoints()->AddDataPointForBarSeries(fact->GetCell(defaultWorksheetIndex, 3, 1, ObjectExt::Box<double>(30)));

	// Ustawia kolor wypełnienia dla serii
	series->get_Format()->get_Fill()->set_FillType(FillType::Solid);
	series->get_Format()->get_Fill()->get_SolidFillColor()->set_Color(System::Drawing::Color::get_Red());


	// Pobiera drugą serię wykresu
	 series = chart->get_ChartData()->get_Series()->idx_get(1);

	// Wypełnia dane serii
	series->get_DataPoints()->AddDataPointForBarSeries(fact->GetCell(defaultWorksheetIndex, 1, 2, ObjectExt::Box<double>(30)));
	series->get_DataPoints()->AddDataPointForBarSeries(fact->GetCell(defaultWorksheetIndex, 2, 2, ObjectExt::Box<double>(10)));
	series->get_DataPoints()->AddDataPointForBarSeries(fact->GetCell(defaultWorksheetIndex, 3, 2, ObjectExt::Box<double>(60)));

	// Ustawia kolor wypełnienia dla serii
	series->get_Format()->get_Fill()->set_FillType(FillType::Solid);
	series->get_Format()->get_Fill()->get_SolidFillColor()->set_Color(System::Drawing::Color::get_Green());


	// Pierwsza etykieta jest ustawiona, aby wyświetlać nazwę kategorii
	SharedPtr<IDataLabel> lbl = series->get_DataPoints()->idx_get(0)->get_Label();
	lbl->get_DataLabelFormat()->set_ShowCategoryName(true);

	lbl = series->get_DataPoints()->idx_get(1)->get_Label();
	lbl->get_DataLabelFormat()->set_ShowSeriesName (true);

	// Wyświetla wartość dla trzeciej etykiety
	lbl = series->get_DataPoints()->idx_get(2)->get_Label();
	lbl->get_DataLabelFormat()->set_ShowValue (true);
	lbl->get_DataLabelFormat()->set_ShowSeriesName(true);
	lbl->get_DataLabelFormat()->set_Separator (u"/");

	// Zapisuje prezentację
	pres->Save(outPath, Aspose::Slides::Export::SaveFormat::Pptx);
Utworzenie wykresów rozproszonych
Wykresy rozproszone (znane również jako wykresy punktowe lub wykresy x-y) są często używane do sprawdzania wzorców lub wykazywania korelacji między dwiema zmiennymi.
Możesz chcieć użyć wykresu rozproszonego, gdy
- masz sparowane dane numeryczne
- masz 2 zmienne, które dobrze ze sobą współgrają
- chcesz określić, czy 2 zmienne są ze sobą powiązane
- masz zmienną niezależną, która ma wiele wartości dla zmiennej zależnej
Ten kod C++ pokazuje, jak utworzyć wykres rozproszony z różnymi znacznikami serii:
#include <DOM/Chart/ChartType.h>
#include <DOM/Chart/IChartData.h>
#include <DOM/Chart/IChartDataPoint.h>
#include <DOM/Chart/IChartDataPointCollection.h>
#include <DOM/Chart/IChartDataWorkbook.h>
#include <DOM/Chart/IChartSeries.h>
#include <DOM/Chart/IChartSeriesCollection.h>
#include <DOM/Chart/IChartSeriesGroup.h>
#include <DOM/Chart/IChartSeriesGroupCollection.h>
#include <DOM/Chart/IChartTitle.h>
#include <DOM/Chart/IDataLabel.h>
#include <DOM/Chart/IDataLabelCollection.h>
#include <DOM/Chart/IDataLabelFormat.h>
#include <DOM/Chart/IFormat.h>
#include <DOM/Chart/IMarker.h>
#include <DOM/Chart/MarkerStyleType.h>
#include <DOM/FillType.h>
#include <DOM/IChart.h>
#include <DOM/IColorFormat.h>
#include <DOM/IFillFormat.h>
#include <DOM/ILineFillFormat.h>
#include <DOM/ILineFormat.h>
#include <DOM/IShapeCollection.h>
#include <DOM/ISlide.h>
#include <DOM/ISlideCollection.h>
#include <DOM/ITextFrame.h>
#include <DOM/ITextFrameFormat.h>
#include <DOM/LineDashStyle.h>
#include <DOM/LineStyle.h>
#include <DOM/NullableBool.h>
#include <DOM/Presentation.h>
#include <Export/SaveFormat.h>
#include <drawing/color.h>
#include <system/string.h>
using namespace Aspose::Slides;
using namespace Aspose::Slides::Charts;
using namespace System;

// Ścieżka do katalogu dokumentów.
	const String outPath = u"../out/ScatteredChart_out.pptx";

	// Tworzy instancję klasy prezentacji, która reprezentuje plik PPTX
	SharedPtr<Presentation> pres = MakeObject<Presentation>();

	// Uzyskuje dostęp do pierwszego slajdu
	SharedPtr<ISlide> slide = pres->get_Slides()->idx_get(0);

	// Dodaje wykres z domyślnymi danymi
	SharedPtr<IChart> chart = slide->get_Shapes()->AddChart(Aspose::Slides::Charts::ChartType::ScatterWithSmoothLines, 0, 0, 500, 500);

	// Ustawia tytuł wykresu
	chart->get_ChartTitle()->AddTextFrameForOverriding(u"Sample Title");
	chart->get_ChartTitle()->get_TextFrameForOverriding()->get_TextFrameFormat()->set_CenterText(NullableBool::True);
	chart->get_ChartTitle()->set_Height(20);
	chart->set_HasTitle(true);

	// Usuwa domyślnie wygenerowaną serię
	chart->get_ChartData()->get_Series()->Clear();

	//  Ustawia indeks arkusza danych wykresu
	int defaultWorksheetIndex = 0;

	// Pobiera arkusz danych wykresu
	SharedPtr<IChartDataWorkbook> fact = chart->get_ChartData()->get_ChartDataWorkbook();


	// Dodaje nową serię
	chart->get_ChartData()->get_Series()->Add(fact->GetCell(defaultWorksheetIndex, 1, 1, ObjectExt::Box<System::String>(u"Series 1")), chart->get_Type());
	chart->get_ChartData()->get_Series()->Add(fact->GetCell(defaultWorksheetIndex, 1, 3, ObjectExt::Box<System::String>(u"Series 2")), chart->get_Type());

	// Pobiera pierwszą serię wykresu
	SharedPtr<IChartSeries> series = chart->get_ChartData()->get_Series()->idx_get(0);

	// Dodaje nowy punkt (1:3)
	series->get_DataPoints()->AddDataPointForScatterSeries(fact->GetCell(defaultWorksheetIndex, 2, 1, ObjectExt::Box<double>(1)), fact->GetCell(defaultWorksheetIndex, 2, 2, ObjectExt::Box<double>(3)));

	// Dodaje nowy punkt (2:10)
	series->get_DataPoints()->AddDataPointForScatterSeries(fact->GetCell(defaultWorksheetIndex, 3, 1, ObjectExt::Box<double>(2)), fact->GetCell(defaultWorksheetIndex, 3, 2, ObjectExt::Box<double>(10)));

	// Edytuje typ serii
	series->set_Type (ChartType::ScatterWithStraightLinesAndMarkers);

	// Zmienia znacznik serii wykresu
	series->get_Marker()->set_Size  (10);
	series->get_Marker()->set_Symbol(MarkerStyleType::Star);


	// Pobiera drugą serię wykresu
	series  = chart->get_ChartData()->get_Series()->idx_get(1);

	// Dodaje nowy punkt (5:2)
	series->get_DataPoints()->AddDataPointForScatterSeries(fact->GetCell(defaultWorksheetIndex, 2, 3, ObjectExt::Box<double>(5)), fact->GetCell(defaultWorksheetIndex, 2, 4, ObjectExt::Box<double>(2)));

	// Dodaje nowy punkt (3:1)
	series->get_DataPoints()->AddDataPointForScatterSeries(fact->GetCell(defaultWorksheetIndex, 3, 3, ObjectExt::Box<double>(3)), fact->GetCell(defaultWorksheetIndex, 3, 4, ObjectExt::Box<double>(1)));

	// Dodaje nowy punkt (2:2)
	series->get_DataPoints()->AddDataPointForScatterSeries(fact->GetCell(defaultWorksheetIndex, 4, 3, ObjectExt::Box<double>(2)), fact->GetCell(defaultWorksheetIndex, 4, 4, ObjectExt::Box<double>(2)));

	// Dodaje nowy punkt (5:1)
	series->get_DataPoints()->AddDataPointForScatterSeries(fact->GetCell(defaultWorksheetIndex, 5, 3, ObjectExt::Box<double>(5)), fact->GetCell(defaultWorksheetIndex, 5, 4, ObjectExt::Box<double>(1)));

	// Zmienia znacznik serii wykresu
	series->get_Marker()->set_Size ( 10);
	series->get_Marker()->set_Symbol(MarkerStyleType::Circle);


	chart->get_ChartData()->get_SeriesGroups()->idx_get(0)->set_IsColorVaried(true);

	SharedPtr<IChartDataPoint> point = series->get_DataPoints()->idx_get(0);
	point->get_Format()->get_Fill()->set_FillType(FillType::Solid);
	point->get_Format()->get_Fill()->get_SolidFillColor()->set_Color(System::Drawing::Color::get_Cyan());
	// Ustawia obramowanie sektora
	point->get_Format()->get_Line()->get_FillFormat()->set_FillType(FillType::Solid);
	point->get_Format()->get_Line()->get_FillFormat()->get_SolidFillColor()->set_Color(System::Drawing::Color::get_Gray());
	point->get_Format()->get_Line()->set_Width ( 3.0);
	point->get_Format()->get_Line()->set_Style(LineStyle::ThinThick);
	point->get_Format()->get_Line()->set_DashStyle(LineDashStyle::DashDot);

	SharedPtr<IChartDataPoint> point1 = series->get_DataPoints()->idx_get(1);
	point1->get_Format()->get_Fill()->set_FillType(FillType::Solid);
	point1->get_Format()->get_Fill()->get_SolidFillColor()->set_Color(System::Drawing::Color::get_Brown());

	// Ustawia obramowanie sektora
	point1->get_Format()->get_Line()->get_FillFormat()->set_FillType(FillType::Solid);
	point1->get_Format()->get_Line()->get_FillFormat()->get_SolidFillColor()->set_Color(System::Drawing::Color::get_Blue());
	point1->get_Format()->get_Line()->set_Width (3.0);
	point1->get_Format()->get_Line()->set_Style(LineStyle::Single);
	point1->get_Format()->get_Line()->set_DashStyle(LineDashStyle::LargeDashDot);


	SharedPtr<IChartDataPoint> point2 = series->get_DataPoints()->idx_get(2);
	point2->get_Format()->get_Fill()->set_FillType(FillType::Solid);
	point2->get_Format()->get_Fill()->get_SolidFillColor()->set_Color(System::Drawing::Color::get_Coral());

	// Ustawia obramowanie sektora
	point2->get_Format()->get_Line()->get_FillFormat()->set_FillType(FillType::Solid);
	point2->get_Format()->get_Line()->get_FillFormat()->get_SolidFillColor()->set_Color(System::Drawing::Color::get_Red());
	point2->get_Format()->get_Line()->set_Width ( 2.0);
	point2->get_Format()->get_Line()->set_Style(LineStyle::ThickThin);
	point2->get_Format()->get_Line()->set_DashStyle(LineDashStyle::LargeDashDotDot);


	// Tworzy niestandardowe etykiety dla każdej kategorii nowej serii
	SharedPtr<IDataLabel> lbl1 = series->get_DataPoints()->idx_get(0)->get_Label();

	// lbl.ShowCategoryName = true;
	lbl1->get_DataLabelFormat()->set_ShowValue(true);


	SharedPtr<IDataLabel> lbl2 = series->get_DataPoints()->idx_get(1)->get_Label();
	lbl2->get_DataLabelFormat()->set_ShowValue(true);
	lbl2->get_DataLabelFormat()->set_ShowLegendKey(true);
	lbl2->get_DataLabelFormat()->set_ShowPercentage(true);

	SharedPtr<IDataLabel> lbl3 = series->get_DataPoints()->idx_get(2)->get_Label();

	lbl3->get_DataLabelFormat()->set_ShowSeriesName(true);
	lbl3->get_DataLabelFormat()->set_ShowPercentage(true);

	// Wyświetla linie prowadzące dla wykresu
	series->get_Labels()->get_DefaultDataLabelFormat()->set_ShowLeaderLines(true);

	// Ustawia kąt obrotu sektorów wykresu kołowego
	chart->get_ChartData()->get_SeriesGroups()->idx_get(0)->set_FirstSliceAngle(180);


	// Zapisuje prezentację
	pres->Save(outPath, Aspose::Slides::Export::SaveFormat::Pptx);
Utworzenie wykresów kołowych
Wykresy kołowe najlepiej nadają się do przedstawiania stosunku części do całości w danych, szczególnie gdy dane zawierają etykiety kategoryczne z wartościami liczbowymi. Jednak jeśli dane zawierają wiele części lub etykiet, warto rozważyć użycie wykresu słupkowego.
- Utwórz instancję klasy Presentation.
- Uzyskaj referencję do slajdu poprzez jego indeks.
- Dodaj wykres z domyślnymi danymi oraz żądanym typem (w tym przypadku
ChartType.Pie). - Uzyskaj dostęp do danych wykresu IChartDataWorkbook.
- Wyczyść domyślne serie i kategorie.
- Dodaj nowe serie i kategorie.
- Dodaj nowe dane wykresu dla serii.
- Dodaj nowe punkty do wykresu i niestandardowe kolory dla sektorów wykresu kołowego.
- Ustaw etykiety dla serii.
- Ustaw linie prowadzące dla etykiet serii.
- Ustaw kąt obrotu dla slajdów wykresu kołowego.
- Zapisz zmodyfikowaną prezentację jako plik PPTX
Ten kod C++ pokazuje, jak utworzyć wykres kołowy:
#include <DOM/Chart/ChartType.h>
#include <DOM/Chart/IChartCategoryCollection.h>
#include <DOM/Chart/IChartData.h>
#include <DOM/Chart/IChartDataPoint.h>
#include <DOM/Chart/IChartDataPointCollection.h>
#include <DOM/Chart/IChartDataWorkbook.h>
#include <DOM/Chart/IChartSeries.h>
#include <DOM/Chart/IChartSeriesCollection.h>
#include <DOM/Chart/IChartSeriesGroup.h>
#include <DOM/Chart/IChartSeriesGroupCollection.h>
#include <DOM/Chart/IChartTitle.h>
#include <DOM/Chart/IDataLabel.h>
#include <DOM/Chart/IDataLabelCollection.h>
#include <DOM/Chart/IDataLabelFormat.h>
#include <DOM/Chart/IFormat.h>
#include <DOM/FillType.h>
#include <DOM/IChart.h>
#include <DOM/IColorFormat.h>
#include <DOM/IFillFormat.h>
#include <DOM/ILineFillFormat.h>
#include <DOM/ILineFormat.h>
#include <DOM/IShapeCollection.h>
#include <DOM/ISlide.h>
#include <DOM/ISlideCollection.h>
#include <DOM/ITextFrame.h>
#include <DOM/ITextFrameFormat.h>
#include <DOM/LineDashStyle.h>
#include <DOM/LineStyle.h>
#include <DOM/NullableBool.h>
#include <DOM/Presentation.h>
#include <Export/SaveFormat.h>
#include <drawing/color.h>
#include <system/string.h>
using namespace Aspose::Slides;
using namespace Aspose::Slides::Charts;
using namespace System;

	// Ścieżka do katalogu dokumentów.
	const String outPath = u"../out/PieChart_out.pptx";

	//Instancja klasy Presentation, która reprezentuje plik PPTX
	SharedPtr<Presentation> pres = MakeObject<Presentation>();

	//Uzyskuje dostęp do pierwszego slajdu
	SharedPtr<ISlide> slide = pres->get_Slides()->idx_get(0);

	// Dodaje wykres z domyślnymi danymi
	SharedPtr<IChart> chart = slide->get_Shapes()->AddChart(Aspose::Slides::Charts::ChartType::Pie, 0, 0, 500, 500);

	// Ustawia tytuł wykresu
	chart->get_ChartTitle()->AddTextFrameForOverriding(u"Sample Title");
	chart->get_ChartTitle()->get_TextFrameForOverriding()->get_TextFrameFormat()->set_CenterText(NullableBool::True);
	chart->get_ChartTitle()->set_Height(20);
	chart->set_HasTitle(true);

	// Usuwa domyślnie wygenerowane serie i kategorie
	chart->get_ChartData()->get_Series()->Clear();
	chart->get_ChartData()->get_Categories()->Clear();

	// Ustawia indeks arkusza danych wykresu
	int defaultWorksheetIndex = 0;

	// Pobiera arkusz danych wykresu
	SharedPtr<IChartDataWorkbook> fact = chart->get_ChartData()->get_ChartDataWorkbook();

	// Dodaje kategorie
	chart->get_ChartData()->get_Categories()->Add(fact->GetCell(defaultWorksheetIndex, 1, 0, ObjectExt::Box<System::String>(u"First Qtr")));
	chart->get_ChartData()->get_Categories()->Add(fact->GetCell(defaultWorksheetIndex, 2, 0, ObjectExt::Box<System::String>(u"2nd Qtr")));
	chart->get_ChartData()->get_Categories()->Add(fact->GetCell(defaultWorksheetIndex, 3, 0, ObjectExt::Box<System::String>(u"3ed Qtr")));

	// Dodaje nową serię
	chart->get_ChartData()->get_Series()->Add(fact->GetCell(defaultWorksheetIndex, 0, 1, ObjectExt::Box<System::String>(u"Series 1")), chart->get_Type());

	// Pobiera pierwszą serię wykresu
	SharedPtr<IChartSeries> series = chart->get_ChartData()->get_Series()->idx_get(0);

	// Wypełnia dane serii
	series->get_DataPoints()->AddDataPointForPieSeries(fact->GetCell(defaultWorksheetIndex, 1, 1, ObjectExt::Box<double>(20)));
	series->get_DataPoints()->AddDataPointForPieSeries(fact->GetCell(defaultWorksheetIndex, 2, 1, ObjectExt::Box<double>(50)));
	series->get_DataPoints()->AddDataPointForPieSeries(fact->GetCell(defaultWorksheetIndex, 3, 1, ObjectExt::Box<double>(30)));

	chart->get_ChartData()->get_SeriesGroups()->idx_get(0)->set_IsColorVaried(true);

	SharedPtr<IChartDataPoint> point = series->get_DataPoints()->idx_get(0);
	point->get_Format()->get_Fill()->set_FillType(FillType::Solid);
	point->get_Format()->get_Fill()->get_SolidFillColor()->set_Color(System::Drawing::Color::get_Cyan());
	// Ustawia obramowanie sektora
	point->get_Format()->get_Line()->get_FillFormat()->set_FillType(FillType::Solid);
	point->get_Format()->get_Line()->get_FillFormat()->get_SolidFillColor()->set_Color(System::Drawing::Color::get_Gray());
	point->get_Format()->get_Line()->set_Width ( 3.0);
	point->get_Format()->get_Line()->set_Style( LineStyle::ThinThick);
	point->get_Format()->get_Line()->set_DashStyle ( LineDashStyle::DashDot);

	SharedPtr<IChartDataPoint> point1 = series->get_DataPoints()->idx_get(1);
	point1->get_Format()->get_Fill()->set_FillType(FillType::Solid);
	point1->get_Format()->get_Fill()->get_SolidFillColor()->set_Color(System::Drawing::Color::get_Brown());

	// Ustawia obramowanie sektora
	point1->get_Format()->get_Line()->get_FillFormat()->set_FillType(FillType::Solid);
	point1->get_Format()->get_Line()->get_FillFormat()->get_SolidFillColor()->set_Color(System::Drawing::Color::get_Blue());
	point1->get_Format()->get_Line()->set_Width (3.0);
	point1->get_Format()->get_Line()->set_Style(LineStyle::Single);
	point1->get_Format()->get_Line()->set_DashStyle(LineDashStyle::LargeDashDot);


	SharedPtr<IChartDataPoint> point2 = series->get_DataPoints()->idx_get(2);
	point2->get_Format()->get_Fill()->set_FillType(FillType::Solid);
	point2->get_Format()->get_Fill()->get_SolidFillColor()->set_Color(System::Drawing::Color::get_Coral());

	// Ustawia obramowanie sektora
	point2->get_Format()->get_Line()->get_FillFormat()->set_FillType(FillType::Solid);
	point2->get_Format()->get_Line()->get_FillFormat()->get_SolidFillColor()->set_Color(System::Drawing::Color::get_Red());
	point2->get_Format()->get_Line()->set_Width (2.0);
	point2->get_Format()->get_Line()->set_Style(LineStyle::ThickThin);
	point2->get_Format()->get_Line()->set_DashStyle(LineDashStyle::LargeDashDotDot);


	// Tworzy niestandardowe etykiety dla każdej kategorii nowej serii
	SharedPtr<IDataLabel> lbl1 = series->get_DataPoints()->idx_get(0)->get_Label();

	// lbl.ShowCategoryName = true;
	lbl1->get_DataLabelFormat()->set_ShowValue(true);


	SharedPtr<IDataLabel> lbl2 = series->get_DataPoints()->idx_get(1)->get_Label();
	lbl2->get_DataLabelFormat()->set_ShowValue(true);
	lbl2->get_DataLabelFormat()->set_ShowLegendKey(true);
	lbl2->get_DataLabelFormat()->set_ShowPercentage(true);

	SharedPtr<IDataLabel> lbl3 = series->get_DataPoints()->idx_get(2)->get_Label();

	lbl3->get_DataLabelFormat()->set_ShowSeriesName(true);
	lbl3->get_DataLabelFormat()->set_ShowPercentage(true);

	// Ustawia serię, aby wyświetlała linie prowadzące dla wykresu
	series->get_Labels()->get_DefaultDataLabelFormat()->set_ShowLeaderLines ( true);

	// Ustawia kąt obrotu sektorów wykresu kołowego
	chart->get_ChartData()->get_SeriesGroups()->idx_get(0)->set_FirstSliceAngle ( 180);


	// Zapisuje prezentację
	pres->Save(outPath, Aspose::Slides::Export::SaveFormat::Pptx);
Utworzenie wykresów liniowych
Wykresy liniowe (znane również jako wykresy liniowe) są najlepsze w sytuacjach, gdy chcesz pokazać zmiany wartości w czasie. Używając wykresu liniowego, możesz jednocześnie porównać wiele danych, śledzić zmiany i trendy w czasie, podkreślać anomalie w seriach danych itp.
- Utwórz instancję klasy Presentation.
- Uzyskaj referencję do slajdu poprzez jego indeks.
- Dodaj wykres z domyślnymi danymi oraz żądanym typem (w tym przypadku
ChartType::Line). - Uzyskaj dostęp do danych wykresu IChartDataWorkbook.
- Wyczyść domyślne serie i kategorie.
- Dodaj nowe serie i kategorie.
- Dodaj nowe dane wykresu dla serii.
- Zapisz zmodyfikowaną prezentację jako plik PPTX
Ten kod C++ pokazuje, jak utworzyć wykres liniowy:
#include <DOM/Chart/ChartType.h>
#include <DOM/IChart.h>
#include <DOM/IShapeCollection.h>
#include <DOM/ISlide.h>
#include <DOM/ISlideCollection.h>
#include <DOM/Presentation.h>
#include <Export/SaveFormat.h>
using namespace Aspose::Slides;
using namespace Aspose::Slides::Charts;
using namespace Aspose::Slides::Export;

auto pres = System::MakeObject<Presentation>();

System::SharedPtr<IChart> lineChart = pres->get_Slides()->idx_get(0)->get_Shapes()->AddChart(ChartType::Line, 10.0f, 50.0f, 600.0f, 350.0f);
pres->Save(u"lineChart.pptx", SaveFormat::Pptx);
Domyślnie punkty na wykresie liniowym są połączone prostymi ciągłymi liniami. Jeśli chcesz, aby punkty były łączone kreskami, możesz określić preferowany typ kreski w następujący sposób:
#include <DOM/Chart/ChartType.h>
#include <DOM/Chart/IChartData.h>
#include <DOM/Chart/IChartSeries.h>
#include <DOM/Chart/IChartSeriesCollection.h>
#include <DOM/Chart/IFormat.h>
#include <DOM/IChart.h>
#include <DOM/ILineFormat.h>
#include <DOM/IShapeCollection.h>
#include <DOM/ISlide.h>
#include <DOM/ISlideCollection.h>
#include <DOM/LineDashStyle.h>
#include <DOM/Presentation.h>
using namespace Aspose::Slides;
using namespace Aspose::Slides::Charts;

auto pres = System::MakeObject<Presentation>();

System::SharedPtr<IChart> lineChart = pres->get_Slides()->idx_get(0)->get_Shapes()->AddChart(ChartType::Line, 10.0f, 50.0f, 600.0f, 350.0f);
for (auto&& series : lineChart->get_ChartData()->get_Series())
{
    series->get_Format()->get_Line()->set_DashStyle(LineDashStyle::Dash);
}
Utworzenie wykresów mapy drzewa
Tree map charts są najlepsze dla danych sprzedażowych, gdy chcesz pokazać względny rozmiar kategorii danych i jednocześnie szybko zwrócić uwagę na pozycje, które są dużymi wkładami w każdą kategorię.
- Utwórz instancję klasy Presentation.
- Uzyskaj referencję do slajdu poprzez jego indeks.
- Dodaj wykres z domyślnymi danymi oraz żądanym typem (w tym przypadku
ChartType.TreeMap). - Uzyskaj dostęp do danych wykresu IChartDataWorkbook.
- Wyczyść domyślne serie i kategorie.
- Dodaj nowe serie i kategorie.
- Dodaj nowe dane wykresu dla serii.
- Zapisz zmodyfikowaną prezentację jako plik PPTX
Ten kod C++ pokazuje, jak utworzyć wykres mapy drzewa:
#include <DOM/Chart/ChartType.h>
#include <DOM/Chart/IChartCategory.h>
#include <DOM/Chart/IChartCategoryCollection.h>
#include <DOM/Chart/IChartCategoryLevelsManager.h>
#include <DOM/Chart/IChartData.h>
#include <DOM/Chart/IChartDataPointCollection.h>
#include <DOM/Chart/IChartDataWorkbook.h>
#include <DOM/Chart/IChartSeries.h>
#include <DOM/Chart/IChartSeriesCollection.h>
#include <DOM/Chart/IDataLabelCollection.h>
#include <DOM/Chart/IDataLabelFormat.h>
#include <DOM/Chart/ParentLabelLayoutType.h>
#include <DOM/IChart.h>
#include <DOM/IShapeCollection.h>
#include <DOM/ISlide.h>
#include <DOM/ISlideCollection.h>
#include <DOM/Presentation.h>
#include <Export/SaveFormat.h>
#include <system/string.h>
using namespace Aspose::Slides;
using namespace Aspose::Slides::Charts;
using namespace Aspose::Slides::Export;
using namespace System;

// Ścieżka do katalogu dokumentów.
	const String outPath = u"../out/TreemapChart_out.pptx";

	//Tworzy instancję klasy Presentation, która reprezentuje plik PPTX
	SharedPtr<Presentation> pres = MakeObject<Presentation>();

	// Uzyskuje dostęp do pierwszego slajdu
	SharedPtr<ISlide> slide = pres->get_Slides()->idx_get(0);

	System::SharedPtr<IChart> chart = slide->get_Shapes()->AddChart(Aspose::Slides::Charts::ChartType::Treemap, 50, 50, 500, 400);
	chart->get_ChartData()->get_Categories()->Clear();
	chart->get_ChartData()->get_Series()->Clear();

	System::SharedPtr<IChartDataWorkbook> wb = chart->get_ChartData()->get_ChartDataWorkbook();

	wb->Clear(0);

	// Gałąź 1
	System::SharedPtr<IChartCategory> leaf = chart->get_ChartData()->get_Categories()->Add(wb->GetCell(0, u"C1", System::ObjectExt::Box<System::String>(u"Leaf1")));
	leaf->get_GroupingLevels()->SetGroupingItem(1, System::ObjectExt::Box<System::String>(u"Stem1"));
	leaf->get_GroupingLevels()->SetGroupingItem(2, System::ObjectExt::Box<System::String>(u"Branch1"));

	chart->get_ChartData()->get_Categories()->Add(wb->GetCell(0, u"C2", System::ObjectExt::Box<System::String>(u"Leaf2")));

	leaf = chart->get_ChartData()->get_Categories()->Add(wb->GetCell(0, u"C3", System::ObjectExt::Box<System::String>(u"Leaf3")));
	leaf->get_GroupingLevels()->SetGroupingItem(1, System::ObjectExt::Box<System::String>(u"Stem2"));

	chart->get_ChartData()->get_Categories()->Add(wb->GetCell(0, u"C4", System::ObjectExt::Box<System::String>(u"Leaf4")));


	// Gałąź 2
	leaf = chart->get_ChartData()->get_Categories()->Add(wb->GetCell(0, u"C5", System::ObjectExt::Box<System::String>(u"Leaf5")));
	leaf->get_GroupingLevels()->SetGroupingItem(1, System::ObjectExt::Box<System::String>(u"Stem3"));
	leaf->get_GroupingLevels()->SetGroupingItem(2, System::ObjectExt::Box<System::String>(u"Branch2"));

	chart->get_ChartData()->get_Categories()->Add(wb->GetCell(0, u"C6", System::ObjectExt::Box<System::String>(u"Leaf6")));

	leaf = chart->get_ChartData()->get_Categories()->Add(wb->GetCell(0, u"C7", System::ObjectExt::Box<System::String>(u"Leaf7")));
	leaf->get_GroupingLevels()->SetGroupingItem(1, System::ObjectExt::Box<System::String>(u"Stem4"));

	chart->get_ChartData()->get_Categories()->Add(wb->GetCell(0, u"C8", System::ObjectExt::Box<System::String>(u"Leaf8")));

	System::SharedPtr<IChartSeries> series = chart->get_ChartData()->get_Series()->Add(Aspose::Slides::Charts::ChartType::Treemap);
	series->get_Labels()->get_DefaultDataLabelFormat()->set_ShowCategoryName(true);
	series->get_DataPoints()->AddDataPointForTreemapSeries(wb->GetCell(0, u"D1", System::ObjectExt::Box<int32_t>(4)));
	series->get_DataPoints()->AddDataPointForTreemapSeries(wb->GetCell(0, u"D2", System::ObjectExt::Box<int32_t>(5)));
	series->get_DataPoints()->AddDataPointForTreemapSeries(wb->GetCell(0, u"D3", System::ObjectExt::Box<int32_t>(3)));
	series->get_DataPoints()->AddDataPointForTreemapSeries(wb->GetCell(0, u"D4", System::ObjectExt::Box<int32_t>(6)));
	series->get_DataPoints()->AddDataPointForTreemapSeries(wb->GetCell(0, u"D5", System::ObjectExt::Box<int32_t>(9)));
	series->get_DataPoints()->AddDataPointForTreemapSeries(wb->GetCell(0, u"D6", System::ObjectExt::Box<int32_t>(9)));
	series->get_DataPoints()->AddDataPointForTreemapSeries(wb->GetCell(0, u"D7", System::ObjectExt::Box<int32_t>(4)));
	series->get_DataPoints()->AddDataPointForTreemapSeries(wb->GetCell(0, u"D8", System::ObjectExt::Box<int32_t>(3)));

	series->set_ParentLabelLayout(Aspose::Slides::Charts::ParentLabelLayoutType::Overlapping);

	// Zapisuje prezentację
	pres->Save(outPath, Aspose::Slides::Export::SaveFormat::Pptx);
Utworzenie wykresów giełdowych
- Utwórz instancję klasy Presentation.
- Uzyskaj referencję do slajdu poprzez jego indeks.
- Dodaj wykres z domyślnymi danymi oraz żądanym typem (ChartType.OpenHighLowClose).
- Uzyskaj dostęp do danych wykresu IChartDataWorkbook.
- Wyczyść domyślne serie i kategorie.
- Dodaj nowe serie i kategorie.
- Dodaj nowe dane wykresu dla serii.
- Określ format HiLowLines.
- Zapisz zmodyfikowaną prezentację jako plik PPTX
Przykładowy kod C++ używany do stworzenia wykresu giełdowego:
#include <DOM/Chart/ChartType.h>
#include <DOM/Chart/IChartCategoryCollection.h>
#include <DOM/Chart/IChartData.h>
#include <DOM/Chart/IChartDataPointCollection.h>
#include <DOM/Chart/IChartDataWorkbook.h>
#include <DOM/Chart/IChartLinesFormat.h>
#include <DOM/Chart/IChartSeries.h>
#include <DOM/Chart/IChartSeriesCollection.h>
#include <DOM/Chart/IChartSeriesGroup.h>
#include <DOM/Chart/IChartSeriesGroupCollection.h>
#include <DOM/Chart/IFormat.h>
#include <DOM/Chart/IUpDownBarsManager.h>
#include <DOM/FillType.h>
#include <DOM/IChart.h>
#include <DOM/ILineFillFormat.h>
#include <DOM/ILineFormat.h>
#include <DOM/IShapeCollection.h>
#include <DOM/ISlide.h>
#include <DOM/ISlideCollection.h>
#include <DOM/Presentation.h>
#include <Export/SaveFormat.h>
#include <system/string.h>
using namespace Aspose::Slides;
using namespace Aspose::Slides::Charts;
using namespace Aspose::Slides::Export;
using namespace System;

	// Ścieżka do katalogu dokumentów.
	const String outPath = u"../out/AddStockChart_out.pptx";

	//Tworzy instancję klasy Presentation, która reprezentuje plik PPTX
	SharedPtr<Presentation> pres = MakeObject<Presentation>();

	//Uzyskuje dostęp do pierwszego slajdu
	SharedPtr<ISlide> slide = pres->get_Slides()->idx_get(0);

	// Dodaje wykres z domyślnymi danymi
	SharedPtr<IChart> chart = slide->get_Shapes()->AddChart(Aspose::Slides::Charts::ChartType::OpenHighLowClose, 0, 0, 500, 500);


	// Ustawia indeks arkusza danych wykresu
	int defaultWorksheetIndex = 0;

	// Pobiera arkusz danych wykresu
	SharedPtr<IChartDataWorkbook> fact = chart->get_ChartData()->get_ChartDataWorkbook();


	// Usuwa domyślnie wygenerowane serie i kategorie
	chart->get_ChartData()->get_Series()->Clear();
	chart->get_ChartData()->get_Categories()->Clear();

	// Dodaje kategorie
	chart->get_ChartData()->get_Categories()->Add(fact->GetCell(defaultWorksheetIndex, 1, 0, ObjectExt::Box<System::String>(u"A")));
	chart->get_ChartData()->get_Categories()->Add(fact->GetCell(defaultWorksheetIndex, 2, 0, ObjectExt::Box<System::String>(u"B")));
	chart->get_ChartData()->get_Categories()->Add(fact->GetCell(defaultWorksheetIndex, 3, 0, ObjectExt::Box<System::String>(u"C")));

	// Dodaje nową serię
	chart->get_ChartData()->get_Series()->Add(fact->GetCell(defaultWorksheetIndex, 0, 1, ObjectExt::Box<System::String>(u"Open")), chart->get_Type());
	chart->get_ChartData()->get_Series()->Add(fact->GetCell(defaultWorksheetIndex, 0, 2, ObjectExt::Box<System::String>(u"High")), chart->get_Type());
	chart->get_ChartData()->get_Series()->Add(fact->GetCell(defaultWorksheetIndex, 0, 3, ObjectExt::Box<System::String>(u"Low")), chart->get_Type());
	chart->get_ChartData()->get_Series()->Add(fact->GetCell(defaultWorksheetIndex, 0, 4, ObjectExt::Box<System::String>(u"Close")), chart->get_Type());


	// Pobiera pierwszą serię wykresu
	SharedPtr<IChartSeries> series = chart->get_ChartData()->get_Series()->idx_get(0);
	// Wypełnia dane pierwszej serii
	series->get_DataPoints()->AddDataPointForStockSeries(fact->GetCell(defaultWorksheetIndex, 1, 1, ObjectExt::Box<double>(72)));
	series->get_DataPoints()->AddDataPointForStockSeries(fact->GetCell(defaultWorksheetIndex, 2, 1, ObjectExt::Box<double>(25)));
	series->get_DataPoints()->AddDataPointForStockSeries(fact->GetCell(defaultWorksheetIndex, 3, 1, ObjectExt::Box<double>(38)));


	series = chart->get_ChartData()->get_Series()->idx_get(1);
	// Wypełnia dane drugiej serii
	series->get_DataPoints()->AddDataPointForStockSeries(fact->GetCell(defaultWorksheetIndex, 1, 2, ObjectExt::Box<double>(172)));
	series->get_DataPoints()->AddDataPointForStockSeries(fact->GetCell(defaultWorksheetIndex, 2, 2, ObjectExt::Box<double>(57)));
	series->get_DataPoints()->AddDataPointForStockSeries(fact->GetCell(defaultWorksheetIndex, 3, 2, ObjectExt::Box<double>(57)));

	series = chart->get_ChartData()->get_Series()->idx_get(2);
	// Wypełnia dane drugiej serii
	series->get_DataPoints()->AddDataPointForStockSeries(fact->GetCell(defaultWorksheetIndex, 1, 3, ObjectExt::Box<double>(12)));
	series->get_DataPoints()->AddDataPointForStockSeries(fact->GetCell(defaultWorksheetIndex, 2, 3, ObjectExt::Box<double>(12)));
	series->get_DataPoints()->AddDataPointForStockSeries(fact->GetCell(defaultWorksheetIndex, 3, 3, ObjectExt::Box<double>(13)));


	series = chart->get_ChartData()->get_Series()->idx_get(3);
	// Wypełnia dane drugiej serii
	series->get_DataPoints()->AddDataPointForStockSeries(fact->GetCell(defaultWorksheetIndex, 1, 4, ObjectExt::Box<double>(25)));
	series->get_DataPoints()->AddDataPointForStockSeries(fact->GetCell(defaultWorksheetIndex, 2, 4, ObjectExt::Box<double>(38)));
	series->get_DataPoints()->AddDataPointForStockSeries(fact->GetCell(defaultWorksheetIndex, 3, 4, ObjectExt::Box<double>(50)));

	// Ustawia grupę serii
	chart->get_ChartData()->get_SeriesGroups()->idx_get(0)->get_UpDownBars()->set_HasUpDownBars (true);
	chart->get_ChartData()->get_SeriesGroups()->idx_get(0)->get_HiLowLinesFormat()->get_Line()->get_FillFormat()->set_FillType(FillType::Solid);


	for(int i=0;i<chart->get_ChartData()->get_Series()->get_Count();i++)
	{
		series = chart->get_ChartData()->get_Series()->idx_get(i);
		series->get_Format()->get_Line()->get_FillFormat()->set_FillType(FillType::NoFill);
	}

	// Zapisuje prezentację
	pres->Save(outPath, Aspose::Slides::Export::SaveFormat::Pptx);
Utworzenie wykresów pudełkowo-wąsowych
- Utwórz instancję klasy Presentation.
- Uzyskaj referencję do slajdu poprzez jego indeks.
- Dodaj wykres z domyślnymi danymi oraz żądanym typem (ChartType.BoxAndWhisker).
- Uzyskaj dostęp do danych wykresu IChartDataWorkbook.
- Wyczyść domyślne serie i kategorie.
- Dodaj nowe serie i kategorie.
- Dodaj nowe dane wykresu dla serii.
- Zapisz zmodyfikowaną prezentację jako plik PPTX
Ten kod C++ pokazuje, jak utworzyć wykres pudełkowo‑wąsowy:
#include <DOM/Chart/ChartType.h>
#include <DOM/Chart/IChartCategoryCollection.h>
#include <DOM/Chart/IChartData.h>
#include <DOM/Chart/IChartDataPointCollection.h>
#include <DOM/Chart/IChartDataWorkbook.h>
#include <DOM/Chart/IChartSeries.h>
#include <DOM/Chart/IChartSeriesCollection.h>
#include <DOM/Chart/QuartileMethodType.h>
#include <DOM/IChart.h>
#include <DOM/IShapeCollection.h>
#include <DOM/ISlide.h>
#include <DOM/ISlideCollection.h>
#include <DOM/Presentation.h>
#include <Export/SaveFormat.h>
#include <system/string.h>
using namespace Aspose::Slides;
using namespace Aspose::Slides::Charts;
using namespace Aspose::Slides::Export;
using namespace System;

	// Ścieżka do katalogu dokumentów.
	const String outPath = u"../out/BoxAndWhisker_out.pptx";

	//Tworzy instancję klasy Presentation, która reprezentuje plik PPTX
	SharedPtr<Presentation> pres = MakeObject<Presentation>();

	//Uzyskuje dostęp do pierwszego slajdu
	SharedPtr<ISlide> slide = pres->get_Slides()->idx_get(0);

	System::SharedPtr<IChart> chart = slide->get_Shapes()->AddChart(Aspose::Slides::Charts::ChartType::BoxAndWhisker, 50, 50, 500, 400);
	chart->get_ChartData()->get_Categories()->Clear();
	chart->get_ChartData()->get_Series()->Clear();

	System::SharedPtr<IChartDataWorkbook> wb = chart->get_ChartData()->get_ChartDataWorkbook();

	wb->Clear(0);

	chart->get_ChartData()->get_Categories()->Add(wb->GetCell(0, u"A1", System::ObjectExt::Box<System::String>(u"Category 1")));
	chart->get_ChartData()->get_Categories()->Add(wb->GetCell(0, u"A2", System::ObjectExt::Box<System::String>(u"Category 1")));
	chart->get_ChartData()->get_Categories()->Add(wb->GetCell(0, u"A3", System::ObjectExt::Box<System::String>(u"Category 1")));
	chart->get_ChartData()->get_Categories()->Add(wb->GetCell(0, u"A4", System::ObjectExt::Box<System::String>(u"Category 1")));
	chart->get_ChartData()->get_Categories()->Add(wb->GetCell(0, u"A5", System::ObjectExt::Box<System::String>(u"Category 1")));
	chart->get_ChartData()->get_Categories()->Add(wb->GetCell(0, u"A6", System::ObjectExt::Box<System::String>(u"Category 1")));

	System::SharedPtr<IChartSeries> series = chart->get_ChartData()->get_Series()->Add(Aspose::Slides::Charts::ChartType::BoxAndWhisker);

	series->set_QuartileMethod(Aspose::Slides::Charts::QuartileMethodType::Exclusive);
	series->set_ShowMeanLine(true);
	series->set_ShowMeanMarkers(true);
	series->set_ShowInnerPoints(true);
	series->set_ShowOutlierPoints(true);

	series->get_DataPoints()->AddDataPointForBoxAndWhiskerSeries(wb->GetCell(0, u"B1", System::ObjectExt::Box<int32_t>(15)));
	series->get_DataPoints()->AddDataPointForBoxAndWhiskerSeries(wb->GetCell(0, u"B2", System::ObjectExt::Box<int32_t>(41)));
	series->get_DataPoints()->AddDataPointForBoxAndWhiskerSeries(wb->GetCell(0, u"B3", System::ObjectExt::Box<int32_t>(16)));
	series->get_DataPoints()->AddDataPointForBoxAndWhiskerSeries(wb->GetCell(0, u"B4", System::ObjectExt::Box<int32_t>(10)));
	series->get_DataPoints()->AddDataPointForBoxAndWhiskerSeries(wb->GetCell(0, u"B5", System::ObjectExt::Box<int32_t>(23)));
	series->get_DataPoints()->AddDataPointForBoxAndWhiskerSeries(wb->GetCell(0, u"B6", System::ObjectExt::Box<int32_t>(16)));


	// Zapisuje prezentację
	pres->Save(outPath, Aspose::Slides::Export::SaveFormat::Pptx);
Utworzenie wykresów lejkowych
- Utwórz instancję klasy Presentation.
- Uzyskaj referencję do slajdu poprzez jego indeks.
- Dodaj wykres z domyślnymi danymi oraz żądanym typem (ChartType.Funnel).
- Zapisz zmodyfikowaną prezentację jako plik PPTX
Ten kod C++ pokazuje, jak utworzyć wykres lejkowy:
#include <DOM/Chart/ChartType.h>
#include <DOM/Chart/IChartCategoryCollection.h>
#include <DOM/Chart/IChartData.h>
#include <DOM/Chart/IChartDataPointCollection.h>
#include <DOM/Chart/IChartDataWorkbook.h>
#include <DOM/Chart/IChartSeries.h>
#include <DOM/Chart/IChartSeriesCollection.h>
#include <DOM/IChart.h>
#include <DOM/IShapeCollection.h>
#include <DOM/ISlide.h>
#include <DOM/ISlideCollection.h>
#include <DOM/Presentation.h>
#include <Export/SaveFormat.h>
#include <system/string.h>
using namespace Aspose::Slides;
using namespace Aspose::Slides::Charts;
using namespace Aspose::Slides::Export;
using namespace System;

	// Ścieżka do katalogu dokumentów.
	const String outPath = u"../out/FunnelChart_out.pptx";

	// Tworzy instancję klasy Presentation, która reprezentuje plik PPTX
	SharedPtr<Presentation> pres = MakeObject<Presentation>();

	// Uzyskuje dostęp do pierwszego slajdu
	SharedPtr<ISlide> slide = pres->get_Slides()->idx_get(0);

	System::SharedPtr<IChart> chart = slide->get_Shapes()->AddChart(Aspose::Slides::Charts::ChartType::Funnel, 50, 50, 500, 400);
	chart->get_ChartData()->get_Categories()->Clear();
	chart->get_ChartData()->get_Series()->Clear();

	System::SharedPtr<IChartDataWorkbook> wb = chart->get_ChartData()->get_ChartDataWorkbook();

	wb->Clear(0);

	chart->get_ChartData()->get_Categories()->Add(wb->GetCell(0, u"A1", System::ObjectExt::Box<System::String>(u"Category 1")));
	chart->get_ChartData()->get_Categories()->Add(wb->GetCell(0, u"A2", System::ObjectExt::Box<System::String>(u"Category 2")));
	chart->get_ChartData()->get_Categories()->Add(wb->GetCell(0, u"A3", System::ObjectExt::Box<System::String>(u"Category 3")));
	chart->get_ChartData()->get_Categories()->Add(wb->GetCell(0, u"A4", System::ObjectExt::Box<System::String>(u"Category 4")));
	chart->get_ChartData()->get_Categories()->Add(wb->GetCell(0, u"A5", System::ObjectExt::Box<System::String>(u"Category 5")));
	chart->get_ChartData()->get_Categories()->Add(wb->GetCell(0, u"A6", System::ObjectExt::Box<System::String>(u"Category 6")));

	System::SharedPtr<IChartSeries> series = chart->get_ChartData()->get_Series()->Add(Aspose::Slides::Charts::ChartType::Funnel);

	series->get_DataPoints()->AddDataPointForFunnelSeries(wb->GetCell(0, u"B1", System::ObjectExt::Box<int32_t>(50)));
	series->get_DataPoints()->AddDataPointForFunnelSeries(wb->GetCell(0, u"B2", System::ObjectExt::Box<int32_t>(100)));
	series->get_DataPoints()->AddDataPointForFunnelSeries(wb->GetCell(0, u"B3", System::ObjectExt::Box<int32_t>(200)));
	series->get_DataPoints()->AddDataPointForFunnelSeries(wb->GetCell(0, u"B4", System::ObjectExt::Box<int32_t>(300)));
	series->get_DataPoints()->AddDataPointForFunnelSeries(wb->GetCell(0, u"B5", System::ObjectExt::Box<int32_t>(400)));
	series->get_DataPoints()->AddDataPointForFunnelSeries(wb->GetCell(0, u"B6", System::ObjectExt::Box<int32_t>(500)));


	// Zapisuje prezentację
	pres->Save(outPath, Aspose::Slides::Export::SaveFormat::Pptx);
Utworzenie wykresów promieniowych
- Utwórz instancję klasy Presentation.
- Uzyskaj referencję do slajdu poprzez jego indeks.
- Dodaj wykres z domyślnymi danymi oraz żądanym typem (w tym przypadku
ChartType.sunburst). - Zapisz zmodyfikowaną prezentację jako plik PPTX
Ten kod C++ pokazuje, jak utworzyć wykres promieniowy:
#include <DOM/Chart/ChartType.h>
#include <DOM/Chart/IChartCategory.h>
#include <DOM/Chart/IChartCategoryCollection.h>
#include <DOM/Chart/IChartCategoryLevelsManager.h>
#include <DOM/Chart/IChartData.h>
#include <DOM/Chart/IChartDataPointCollection.h>
#include <DOM/Chart/IChartDataWorkbook.h>
#include <DOM/Chart/IChartSeries.h>
#include <DOM/Chart/IChartSeriesCollection.h>
#include <DOM/Chart/IDataLabelCollection.h>
#include <DOM/Chart/IDataLabelFormat.h>
#include <DOM/IChart.h>
#include <DOM/IShapeCollection.h>
#include <DOM/ISlide.h>
#include <DOM/ISlideCollection.h>
#include <DOM/Presentation.h>
#include <Export/SaveFormat.h>
#include <system/string.h>
using namespace Aspose::Slides;
using namespace Aspose::Slides::Charts;
using namespace Aspose::Slides::Export;
using namespace System;

	// Ścieżka do katalogu dokumentów.
	const String outPath = u"../out/SunburstChart_out.pptx";

	// Tworzy instancję klasy Presentation, która reprezentuje plik PPTX
	SharedPtr<Presentation> pres = MakeObject<Presentation>();

	// Uzyskuje dostęp do pierwszego slajdu
	SharedPtr<ISlide> slide = pres->get_Slides()->idx_get(0);

	System::SharedPtr<IChart> chart=slide->get_Shapes()->AddChart(Aspose::Slides::Charts::ChartType::Sunburst, 50, 50, 500, 400);
	chart->get_ChartData()->get_Categories()->Clear();
	chart->get_ChartData()->get_Series()->Clear();

	System::SharedPtr<IChartDataWorkbook> wb = chart->get_ChartData()->get_ChartDataWorkbook();

	wb->Clear(0);

	// Gałąź 1
	System::SharedPtr<IChartCategory> leaf = chart->get_ChartData()->get_Categories()->Add(wb->GetCell(0, u"C1", System::ObjectExt::Box<System::String>(u"Leaf1")));
	leaf->get_GroupingLevels()->SetGroupingItem(1, System::ObjectExt::Box<System::String>(u"Stem1"));
	leaf->get_GroupingLevels()->SetGroupingItem(2, System::ObjectExt::Box<System::String>(u"Branch1"));

	chart->get_ChartData()->get_Categories()->Add(wb->GetCell(0, u"C2", System::ObjectExt::Box<System::String>(u"Leaf2")));

	leaf = chart->get_ChartData()->get_Categories()->Add(wb->GetCell(0, u"C3", System::ObjectExt::Box<System::String>(u"Leaf3")));
	leaf->get_GroupingLevels()->SetGroupingItem(1, System::ObjectExt::Box<System::String>(u"Stem2"));

	chart->get_ChartData()->get_Categories()->Add(wb->GetCell(0, u"C4", System::ObjectExt::Box<System::String>(u"Leaf4")));

	// Gałąź 2
	leaf = chart->get_ChartData()->get_Categories()->Add(wb->GetCell(0, u"C5", System::ObjectExt::Box<System::String>(u"Leaf5")));
	leaf->get_GroupingLevels()->SetGroupingItem(1, System::ObjectExt::Box<System::String>(u"Stem3"));
	leaf->get_GroupingLevels()->SetGroupingItem(2, System::ObjectExt::Box<System::String>(u"Branch2"));

	chart->get_ChartData()->get_Categories()->Add(wb->GetCell(0, u"C6", System::ObjectExt::Box<System::String>(u"Leaf6")));

	leaf = chart->get_ChartData()->get_Categories()->Add(wb->GetCell(0, u"C7", System::ObjectExt::Box<System::String>(u"Leaf7")));
	leaf->get_GroupingLevels()->SetGroupingItem(1, System::ObjectExt::Box<System::String>(u"Stem4"));

	chart->get_ChartData()->get_Categories()->Add(wb->GetCell(0, u"C8", System::ObjectExt::Box<System::String>(u"Leaf8")));

	System::SharedPtr<IChartSeries> series = chart->get_ChartData()->get_Series()->Add(Aspose::Slides::Charts::ChartType::Sunburst);
	series->get_Labels()->get_DefaultDataLabelFormat()->set_ShowCategoryName(true);
	series->get_DataPoints()->AddDataPointForSunburstSeries(wb->GetCell(0, u"D1", System::ObjectExt::Box<int32_t>(4)));
	series->get_DataPoints()->AddDataPointForSunburstSeries(wb->GetCell(0, u"D2", System::ObjectExt::Box<int32_t>(5)));
	series->get_DataPoints()->AddDataPointForSunburstSeries(wb->GetCell(0, u"D3", System::ObjectExt::Box<int32_t>(3)));
	series->get_DataPoints()->AddDataPointForSunburstSeries(wb->GetCell(0, u"D4", System::ObjectExt::Box<int32_t>(6)));
	series->get_DataPoints()->AddDataPointForSunburstSeries(wb->GetCell(0, u"D5", System::ObjectExt::Box<int32_t>(9)));
	series->get_DataPoints()->AddDataPointForSunburstSeries(wb->GetCell(0, u"D6", System::ObjectExt::Box<int32_t>(9)));
	series->get_DataPoints()->AddDataPointForSunburstSeries(wb->GetCell(0, u"D7", System::ObjectExt::Box<int32_t>(4)));
	series->get_DataPoints()->AddDataPointForSunburstSeries(wb->GetCell(0, u"D8", System::ObjectExt::Box<int32_t>(3)));

	// Zapisuje plik prezentacji na dysk
	pres->Save(outPath, Aspose::Slides::Export::SaveFormat::Pptx);
Utworzenie wykresów histogramu
- Utwórz instancję klasy Presentation.
- Uzyskaj referencję do slajdu poprzez jego indeks.
- Dodaj wykres z danymi i określ preferowany typ wykresu (
ChartType.Histogramw tym przypadku). - Uzyskaj dostęp do danych wykresu
IChartDataWorkbook. - Wyczyść domyślne serie i kategorie.
- Dodaj nowe serie i kategorie.
- Zapisz zmodyfikowaną prezentację jako plik PPTX.
Ten kod C++ pokazuje, jak utworzyć wykres histogramu:
#include <DOM/Chart/AxisAggregationType.h>
#include <DOM/Chart/ChartType.h>
#include <DOM/Chart/IAxesManager.h>
#include <DOM/Chart/IAxis.h>
#include <DOM/Chart/IChartCategoryCollection.h>
#include <DOM/Chart/IChartData.h>
#include <DOM/Chart/IChartDataPointCollection.h>
#include <DOM/Chart/IChartDataWorkbook.h>
#include <DOM/Chart/IChartSeries.h>
#include <DOM/Chart/IChartSeriesCollection.h>
#include <DOM/IChart.h>
#include <DOM/IShapeCollection.h>
#include <DOM/ISlide.h>
#include <DOM/ISlideCollection.h>
#include <DOM/Presentation.h>
#include <Export/SaveFormat.h>
#include <system/string.h>
using namespace Aspose::Slides;
using namespace Aspose::Slides::Charts;
using namespace Aspose::Slides::Export;
using namespace System;

	// Ścieżka do katalogu dokumentów.
	const String outPath = u"../out/HistogramChart_out.pptx";

	// Tworzy instancję klasy Presentation, która reprezentuje plik PPTX
	SharedPtr<Presentation> pres = MakeObject<Presentation>();

	// Uzyskuje dostęp do pierwszego slajdu
	SharedPtr<ISlide> slide = pres->get_Slides()->idx_get(0);

	System::SharedPtr<IChart> chart = slide->get_Shapes()->AddChart(Aspose::Slides::Charts::ChartType::Histogram, 50, 50, 500, 400);
	chart->get_ChartData()->get_Categories()->Clear();
	chart->get_ChartData()->get_Series()->Clear();

	System::SharedPtr<IChartDataWorkbook> wb = chart->get_ChartData()->get_ChartDataWorkbook();

	wb->Clear(0);

	System::SharedPtr<IChartSeries> series = chart->get_ChartData()->get_Series()->Add(Aspose::Slides::Charts::ChartType::Histogram);
	series->get_DataPoints()->AddDataPointForHistogramSeries(wb->GetCell(0, u"A1", System::ObjectExt::Box<int32_t>(15)));
	series->get_DataPoints()->AddDataPointForHistogramSeries(wb->GetCell(0, u"A2", System::ObjectExt::Box<int32_t>(-41)));
	series->get_DataPoints()->AddDataPointForHistogramSeries(wb->GetCell(0, u"A3", System::ObjectExt::Box<int32_t>(16)));
	series->get_DataPoints()->AddDataPointForHistogramSeries(wb->GetCell(0, u"A4", System::ObjectExt::Box<int32_t>(10)));
	series->get_DataPoints()->AddDataPointForHistogramSeries(wb->GetCell(0, u"A5", System::ObjectExt::Box<int32_t>(-23)));
	series->get_DataPoints()->AddDataPointForHistogramSeries(wb->GetCell(0, u"A6", System::ObjectExt::Box<int32_t>(16)));

	chart->get_Axes()->get_HorizontalAxis()->set_AggregationType(Aspose::Slides::Charts::AxisAggregationType::Automatic);

	// Zapisuje prezentację
	pres->Save(outPath, Aspose::Slides::Export::SaveFormat::Pptx);
Utworzenie wykresów radarowych
- Utwórz instancję klasy Presentation.
- Uzyskaj referencję do slajdu poprzez jego indeks.
- Dodaj wykres z danymi i określ preferowany typ wykresu (
ChartType.Radarw tym przypadku). - Zapisz zmodyfikowaną prezentację jako plik PPTX
Ten kod C++ pokazuje, jak utworzyć wykres radarowy:
#include <DOM/Chart/ChartType.h>
#include <DOM/IShapeCollection.h>
#include <DOM/ISlide.h>
#include <DOM/ISlideCollection.h>
#include <DOM/Presentation.h>
#include <Export/SaveFormat.h>
using namespace Aspose::Slides;

System::SharedPtr<Presentation> presentation = System::MakeObject<Presentation>();

presentation->get_Slides()->idx_get(0)->get_Shapes()->AddChart(Aspose::Slides::Charts::ChartType::Radar, 20.0f, 20.0f, 400.0f, 300.0f);
presentation->Save(u"Radar-chart.pptx", Aspose::Slides::Export::SaveFormat::Pptx);
Utworzenie wykresów wielokategorialnych
- Utwórz instancję klasy Presentation.
- Uzyskaj referencję do slajdu poprzez jego indeks.
- Dodaj wykres z domyślnymi danymi oraz żądanym typem (ChartType.ClusteredColumn).
- Uzyskaj dostęp do danych wykresu IChartDataWorkbook.
- Wyczyść domyślne serie i kategorie.
- Dodaj nowe serie i kategorie.
- Dodaj nowe dane wykresu dla serii.
- Zapisz zmodyfikowaną prezentację jako plik PPTX.
Ten kod C++ pokazuje, jak utworzyć wykres wielokategorialny:
#include <DOM/Chart/ChartType.h>
#include <DOM/Chart/IChartCategory.h>
#include <DOM/Chart/IChartCategoryCollection.h>
#include <DOM/Chart/IChartCategoryLevelsManager.h>
#include <DOM/Chart/IChartData.h>
#include <DOM/Chart/IChartDataPointCollection.h>
#include <DOM/Chart/IChartDataWorkbook.h>
#include <DOM/Chart/IChartSeries.h>
#include <DOM/Chart/IChartSeriesCollection.h>
#include <DOM/IChart.h>
#include <DOM/IShapeCollection.h>
#include <DOM/ISlide.h>
#include <DOM/ISlideCollection.h>
#include <DOM/Presentation.h>
#include <Export/SaveFormat.h>
#include <system/object_ext.h>
#include <system/string.h>
using namespace Aspose::Slides;
using namespace Aspose::Slides::Charts;
using namespace Aspose::Slides::Export;
using namespace System;

	// Ścieżka do katalogu dokumentów.
	const String outPath = u"../out/MultiCategoryChart_out.pptx";

	//Tworzy instancję klasy Presentation, która reprezentuje plik PPTX
	SharedPtr<Presentation> pres = MakeObject<Presentation>();

	//Uzyskuje dostęp do pierwszego slajdu
	SharedPtr<ISlide> slide = pres->get_Slides()->idx_get(0);

	// Dodaje wykres z domyślnymi danymi
	SharedPtr<IChart> chart = slide->get_Shapes()->AddChart(Aspose::Slides::Charts::ChartType::ClusteredColumn, 0, 0, 500, 500);

	// Ustawia indeks arkusza danych wykresu
	int defaultWorksheetIndex = 0;

	// Pobiera arkusz danych wykresu
	SharedPtr<IChartDataWorkbook> fact = chart->get_ChartData()->get_ChartDataWorkbook();

	// Czyści skoroszyt
	fact->Clear(defaultWorksheetIndex);

	chart->get_ChartData()->get_Series()->Clear();
	chart->get_ChartData()->get_Categories()->Clear();


	// Dodaje kategorie
	SharedPtr<IChartCategory> category = chart->get_ChartData()->get_Categories()->Add(fact->GetCell(defaultWorksheetIndex, u"c2", ObjectExt::Box<System::String>(u"A")));
	category->get_GroupingLevels()->SetGroupingItem(1, ObjectExt::Box<System::String>(u"Group1"));
	chart->get_ChartData()->get_Categories()->Add(fact->GetCell(defaultWorksheetIndex, u"c3", ObjectExt::Box<System::String>(u"B")));

	category = chart->get_ChartData()->get_Categories()->Add(fact->GetCell(defaultWorksheetIndex, u"c4", ObjectExt::Box<System::String>(u"C")));
	category->get_GroupingLevels()->SetGroupingItem(1, ObjectExt::Box<System::String>(u"Group2"));
	chart->get_ChartData()->get_Categories()->Add(fact->GetCell(defaultWorksheetIndex, u"c5", ObjectExt::Box<System::String>(u"D")));

	category = chart->get_ChartData()->get_Categories()->Add(fact->GetCell(defaultWorksheetIndex, u"c6", ObjectExt::Box<System::String>(u"E")));
	category->get_GroupingLevels()->SetGroupingItem(1, ObjectExt::Box<System::String>(u"Group3"));
	chart->get_ChartData()->get_Categories()->Add(fact->GetCell(defaultWorksheetIndex, u"c7", ObjectExt::Box<System::String>(u"F")));


	category = chart->get_ChartData()->get_Categories()->Add(fact->GetCell(defaultWorksheetIndex, u"c8", ObjectExt::Box<System::String>(u"G")));
	category->get_GroupingLevels()->SetGroupingItem(1, ObjectExt::Box<System::String>(u"Group4"));
	chart->get_ChartData()->get_Categories()->Add(fact->GetCell(defaultWorksheetIndex, u"c9", ObjectExt::Box<System::String>(u"H")));

	// Dodaje nową serię
	SharedPtr<IChartSeries>  series = chart->get_ChartData()->get_Series()->Add(fact->GetCell(0, u"D1", ObjectExt::Box<System::String>(u"Series 1")),
		ChartType::ClusteredColumn);

	series->get_DataPoints()->AddDataPointForBarSeries(fact->GetCell(defaultWorksheetIndex, u"D2", ObjectExt::Box<double>(10)));
	series->get_DataPoints()->AddDataPointForBarSeries(fact->GetCell(defaultWorksheetIndex, u"D3", ObjectExt::Box<double>(20)));
	series->get_DataPoints()->AddDataPointForBarSeries(fact->GetCell(defaultWorksheetIndex, u"D4", ObjectExt::Box<double>(30)));
	series->get_DataPoints()->AddDataPointForBarSeries(fact->GetCell(defaultWorksheetIndex, u"D5", ObjectExt::Box<double>(40)));
	series->get_DataPoints()->AddDataPointForBarSeries(fact->GetCell(defaultWorksheetIndex, u"D6", ObjectExt::Box<double>(50)));
	series->get_DataPoints()->AddDataPointForBarSeries(fact->GetCell(defaultWorksheetIndex, u"D7", ObjectExt::Box<double>(60)));
	series->get_DataPoints()->AddDataPointForBarSeries(fact->GetCell(defaultWorksheetIndex, u"D8", ObjectExt::Box<double>(70)));
	series->get_DataPoints()->AddDataPointForBarSeries(fact->GetCell(defaultWorksheetIndex, u"D9", ObjectExt::Box<double>(80)));

	// Zapisuje prezentację
	pres->Save(outPath, Aspose::Slides::Export::SaveFormat::Pptx);
Utworzenie wykresów mapowych
Wykres mapowy jest wizualizacją obszaru zawierającego dane. Wykresy mapowe są najlepsze do porównywania danych lub wartości w różnych regionach geograficznych.
Ten kod C++ pokazuje, jak utworzyć wykres mapowy:
#include <DOM/Chart/ChartType.h>
#include <DOM/IShapeCollection.h>
#include <DOM/ISlide.h>
#include <DOM/ISlideCollection.h>
#include <DOM/Presentation.h>
#include <Export/SaveFormat.h>
using namespace Aspose::Slides;
using namespace Aspose::Slides::Charts;
using namespace Aspose::Slides::Export;

auto pres = System::MakeObject<Presentation>();
auto slide = pres->get_Slides()->idx_get(0);
auto chart = slide->get_Shapes()->AddChart(ChartType::Map, 50.0f, 50.0f, 500.0f, 400.0f);
pres->Save(u"mapChart.pptx", SaveFormat::Pptx);
Utworzenie wykresów kombinowanych
Wykres kombinowany (lub wykres combo) łączy dwa lub więcej typów wykresów w jednym diagramie. Ten wykres pozwala podkreślić, porównać lub zbadać różnice między dwoma lub więcej zestawami danych, pomagając zidentyfikować zależności między nimi.
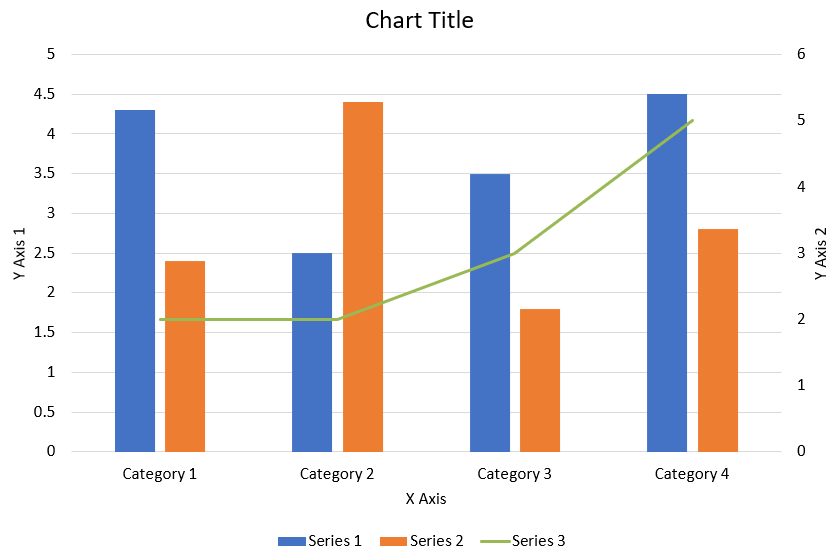
Poniższy kod C++ pokazuje, jak utworzyć kombinowany wykres przedstawiony powyżej w prezentacji PowerPoint:
#include <DOM/Chart/AxisPositionType.h>
#include <DOM/Chart/ChartType.h>
#include <DOM/Chart/CrossesType.h>
#include <DOM/Chart/IAxesManager.h>
#include <DOM/Chart/IAxis.h>
#include <DOM/Chart/IAxisFormat.h>
#include <DOM/Chart/IChartCategoryCollection.h>
#include <DOM/Chart/IChartData.h>
#include <DOM/Chart/IChartDataPointCollection.h>
#include <DOM/Chart/IChartDataWorkbook.h>
#include <DOM/Chart/IChartLinesFormat.h>
#include <DOM/Chart/IChartPortionFormat.h>
#include <DOM/Chart/IChartSeries.h>
#include <DOM/Chart/IChartSeriesCollection.h>
#include <DOM/Chart/IChartSeriesGroup.h>
#include <DOM/Chart/IChartTextFormat.h>
#include <DOM/Chart/IChartTitle.h>
#include <DOM/Chart/ILegend.h>
#include <DOM/Chart/LegendPositionType.h>
#include <DOM/FillType.h>
#include <DOM/IChart.h>
#include <DOM/IColorFormat.h>
#include <DOM/ILineFillFormat.h>
#include <DOM/ILineFormat.h>
#include <DOM/IParagraph.h>
#include <DOM/IParagraphFormat.h>
#include <DOM/IPortionFormat.h>
#include <DOM/IShapeCollection.h>
#include <DOM/ISlide.h>
#include <DOM/ITextFrame.h>
#include <DOM/NullableBool.h>
#include <DOM/Presentation.h>
#include <Export/SaveFormat.h>
#include <drawing/color.h>
#include <system/string.h>
using namespace Aspose::Slides;
using namespace Aspose::Slides::Charts;
using namespace Aspose::Slides::Export;
using namespace System;
using namespace System::Drawing;

static SharedPtr<IChart> CreateChartWithFirstSeries(SharedPtr<ISlide> slide)
{
    auto chart = slide->get_Shapes()->AddChart(ChartType::ClusteredColumn, 50, 50, 600, 400);

    // Ustaw tytuł wykresu.
    chart->set_HasTitle(true);
    chart->get_ChartTitle()->AddTextFrameForOverriding(u"Chart Title");
    chart->get_ChartTitle()->set_Overlay(false);
    auto titleParagraph = chart->get_ChartTitle()->get_TextFrameForOverriding()->get_Paragraph(0);
    auto titleFormat = titleParagraph->get_ParagraphFormat()->get_DefaultPortionFormat();
    titleFormat->set_FontBold(NullableBool::False);
    titleFormat->set_FontHeight(18.0);

    // Ustaw legendę wykresu.
    chart->get_Legend()->set_Position(LegendPositionType::Bottom);
    chart->get_Legend()->get_TextFormat()->get_PortionFormat()->set_FontHeight(12.0);

    // Usuń domyślnie wygenerowane serie i kategorie.
    chart->get_ChartData()->get_Series()->Clear();
    chart->get_ChartData()->get_Categories()->Clear();

    const int worksheetIndex = 0;
    auto workbook = chart->get_ChartData()->get_ChartDataWorkbook();

    // Dodaj nowe kategorie.
    chart->get_ChartData()->get_Categories()->Add(workbook->GetCell(worksheetIndex, 1, 0, ObjectExt::Box<String>(u"Category 1")));
    chart->get_ChartData()->get_Categories()->Add(workbook->GetCell(worksheetIndex, 2, 0, ObjectExt::Box<String>(u"Category 2")));
    chart->get_ChartData()->get_Categories()->Add(workbook->GetCell(worksheetIndex, 3, 0, ObjectExt::Box<String>(u"Category 3")));
    chart->get_ChartData()->get_Categories()->Add(workbook->GetCell(worksheetIndex, 4, 0, ObjectExt::Box<String>(u"Category 4")));

    // Dodaj pierwszą serię.
    auto seriesNameCell = workbook->GetCell(worksheetIndex, 0, 1, ObjectExt::Box<String>(u"Series 1"));
    auto series = chart->get_ChartData()->get_Series()->Add(seriesNameCell, chart->get_Type());

    series->get_ParentSeriesGroup()->set_Overlap(-25);
    series->get_ParentSeriesGroup()->set_GapWidth(220);

    series->get_DataPoints()->AddDataPointForBarSeries(workbook->GetCell(worksheetIndex, 1, 1, ObjectExt::Box<double>(4.3)));
    series->get_DataPoints()->AddDataPointForBarSeries(workbook->GetCell(worksheetIndex, 2, 1, ObjectExt::Box<double>(2.5)));
    series->get_DataPoints()->AddDataPointForBarSeries(workbook->GetCell(worksheetIndex, 3, 1, ObjectExt::Box<double>(3.5)));
    series->get_DataPoints()->AddDataPointForBarSeries(workbook->GetCell(worksheetIndex, 4, 1, ObjectExt::Box<double>(4.5)));

    return chart;
}

static void AddSecondSeriesToChart(SharedPtr<IChart> chart)
{
    auto workbook = chart->get_ChartData()->get_ChartDataWorkbook();
    const int worksheetIndex = 0;

    auto seriesNameCell = workbook->GetCell(worksheetIndex, 0, 2, ObjectExt::Box<String>(u"Series 2"));
    auto series = chart->get_ChartData()->get_Series()->Add(seriesNameCell, ChartType::ClusteredColumn);

    series->get_ParentSeriesGroup()->set_Overlap(-25);
    series->get_ParentSeriesGroup()->set_GapWidth(220);

    series->get_DataPoints()->AddDataPointForBarSeries(workbook->GetCell(worksheetIndex, 1, 2, ObjectExt::Box<double>(2.4)));
    series->get_DataPoints()->AddDataPointForBarSeries(workbook->GetCell(worksheetIndex, 2, 2, ObjectExt::Box<double>(4.4)));
    series->get_DataPoints()->AddDataPointForBarSeries(workbook->GetCell(worksheetIndex, 3, 2, ObjectExt::Box<double>(1.8)));
    series->get_DataPoints()->AddDataPointForBarSeries(workbook->GetCell(worksheetIndex, 4, 2, ObjectExt::Box<double>(2.8)));
}

static void AddThirdSeriesToChart(SharedPtr<IChart> chart)
{
    auto workbook = chart->get_ChartData()->get_ChartDataWorkbook();
    const int worksheetIndex = 0;

    auto seriesNameCell = workbook->GetCell(worksheetIndex, 0, 3, ObjectExt::Box<String>(u"Series 3"));
    auto series = chart->get_ChartData()->get_Series()->Add(seriesNameCell, ChartType::Line);

    series->get_DataPoints()->AddDataPointForLineSeries(workbook->GetCell(worksheetIndex, 1, 3, ObjectExt::Box<double>(2.0)));
    series->get_DataPoints()->AddDataPointForLineSeries(workbook->GetCell(worksheetIndex, 2, 3, ObjectExt::Box<double>(2.0)));
    series->get_DataPoints()->AddDataPointForLineSeries(workbook->GetCell(worksheetIndex, 3, 3, ObjectExt::Box<double>(3.0)));
    series->get_DataPoints()->AddDataPointForLineSeries(workbook->GetCell(worksheetIndex, 4, 3, ObjectExt::Box<double>(5.0)));

    series->set_PlotOnSecondAxis(true);
}

static void SetAxisTitle(SharedPtr<IAxis> axis, String axisTitle)
{
    axis->set_HasTitle(true);
    axis->get_Title()->set_Overlay(false);
    auto titleParagraph = axis->get_Title()->AddTextFrameForOverriding(axisTitle)->get_Paragraph(0);
    auto titleFormat = titleParagraph->get_ParagraphFormat()->get_DefaultPortionFormat();
    titleFormat->set_FontBold(NullableBool::False);
    titleFormat->set_FontHeight(12.0);
}

static void SetPrimaryAxesFormat(SharedPtr<IChart> chart)
{
    // Ustaw oś poziomą.
    auto horizontalAxis = chart->get_Axes()->get_HorizontalAxis();
    horizontalAxis->get_TextFormat()->get_PortionFormat()->set_FontHeight(12.0);
    horizontalAxis->get_Format()->get_Line()->get_FillFormat()->set_FillType(FillType::NoFill);

    SetAxisTitle(horizontalAxis, u"X Axis");

    // Ustaw oś pionową.
    auto verticalAxis = chart->get_Axes()->get_VerticalAxis();
    verticalAxis->get_TextFormat()->get_PortionFormat()->set_FontHeight(12.0);
    verticalAxis->get_Format()->get_Line()->get_FillFormat()->set_FillType(FillType::NoFill);

    SetAxisTitle(verticalAxis, u"Y Axis 1");

    // Ustaw kolor głównych linii siatki pionowej.
    auto majorGridLinesFormat = verticalAxis->get_MajorGridLinesFormat()->get_Line()->get_FillFormat();
    majorGridLinesFormat->set_FillType(FillType::Solid);
    majorGridLinesFormat->get_SolidFillColor()->set_Color(Color::FromArgb(217, 217, 217));
}

static void SetSecondaryAxesFormat(SharedPtr<IChart> chart)
{
    // Ustaw drugą oś poziomą.
    auto secondaryHorizontalAxis = chart->get_Axes()->get_SecondaryHorizontalAxis();
    secondaryHorizontalAxis->set_Position(AxisPositionType::Bottom);
    secondaryHorizontalAxis->set_CrossType(CrossesType::Maximum);
    secondaryHorizontalAxis->set_IsVisible(false);
    secondaryHorizontalAxis->get_MajorGridLinesFormat()->get_Line()->get_FillFormat()->set_FillType(FillType::NoFill);
    secondaryHorizontalAxis->get_MinorGridLinesFormat()->get_Line()->get_FillFormat()->set_FillType(FillType::NoFill);

    // Ustaw drugą oś pionową.
    auto secondaryVerticalAxis = chart->get_Axes()->get_SecondaryVerticalAxis();
    secondaryVerticalAxis->set_Position(AxisPositionType::Right);
    secondaryVerticalAxis->get_TextFormat()->get_PortionFormat()->set_FontHeight(12.0);
    secondaryVerticalAxis->get_Format()->get_Line()->get_FillFormat()->set_FillType(FillType::NoFill);
    secondaryVerticalAxis->get_MajorGridLinesFormat()->get_Line()->get_FillFormat()->set_FillType(FillType::NoFill);
    secondaryVerticalAxis->get_MinorGridLinesFormat()->get_Line()->get_FillFormat()->set_FillType(FillType::NoFill);

    SetAxisTitle(secondaryVerticalAxis, u"Y Axis 2");
}

static void CreateComboChart()
{
    auto presentation = MakeObject<Presentation>();
    auto slide = presentation->get_Slide(0);

    auto chart = CreateChartWithFirstSeries(slide);

    AddSecondSeriesToChart(chart);
    AddThirdSeriesToChart(chart);

    SetPrimaryAxesFormat(chart);
    SetSecondaryAxesFormat(chart);

    presentation->Save(u"combo-chart.pptx", SaveFormat::Pptx);
    presentation->Dispose();
}
Aktualizacja wykresów
- Zainstaluj klasę Presentation, która reprezentuje prezentację zawierającą wykres.
- Uzyskaj referencję do slajdu poprzez jego indeks.
- Przejdź przez wszystkie kształty, aby znaleźć żądany wykres.
- Uzyskaj dostęp do arkusza danych wykresu.
- Zmodyfikuj dane serii wykresu, zmieniając wartości serii.
- Dodaj nową serię i wypełnij ją danymi.
- Zapisz zmodyfikowaną prezentację jako plik PPTX.
Ten kod C++ pokazuje, jak zaktualizować wykres:
#include <DOM/Chart/ChartType.h>
#include <DOM/Chart/IChartData.h>
#include <DOM/Chart/IChartDataPoint.h>
#include <DOM/Chart/IChartDataPointCollection.h>
#include <DOM/Chart/IChartDataWorkbook.h>
#include <DOM/Chart/IChartSeries.h>
#include <DOM/Chart/IChartSeriesCollection.h>
#include <DOM/Chart/IDoubleChartValue.h>
#include <DOM/IChart.h>
#include <DOM/IShapeCollection.h>
#include <DOM/ISlide.h>
#include <DOM/ISlideCollection.h>
#include <DOM/Presentation.h>
#include <Export/SaveFormat.h>
using namespace Aspose::Slides;
using namespace Aspose::Slides::Charts;

// Tworzy instancję klasy Presentation, która reprezentuje plik PPTX
System::SharedPtr<Presentation> pres = System::MakeObject<Presentation>(u"ExistingChart.pptx");

// Uzyskuje dostęp do pierwszego slajdu
System::SharedPtr<ISlide> sld = pres->get_Slides()->idx_get(0);

// Dodaje wykres z domyślnymi danymi
System::SharedPtr<IChart> chart = System::ExplicitCast<Aspose::Slides::Charts::IChart>(sld->get_Shapes()->idx_get(0));

// Ustawia indeks arkusza danych wykresu
int32_t defaultWorksheetIndex = 0;

// Pobiera arkusz danych wykresu
System::SharedPtr<IChartDataWorkbook> fact = chart->get_ChartData()->get_ChartDataWorkbook();


// Zmienia nazwę kategorii wykresu
fact->GetCell(defaultWorksheetIndex, 1, 0, System::ObjectExt::Box<System::String>(u"Modified Category 1"));
fact->GetCell(defaultWorksheetIndex, 2, 0, System::ObjectExt::Box<System::String>(u"Modified Category 2"));

// Pobiera pierwszą serię wykresu
System::SharedPtr<IChartSeries> series = chart->get_ChartData()->get_Series()->idx_get(0);

// Aktualizuje dane serii
fact->GetCell(defaultWorksheetIndex, 0, 1, System::ObjectExt::Box<System::String>(u"New_Series1"));
// Modyfikowanie nazwy serii
series->get_DataPoints()->idx_get(0)->get_Value()->set_Data(System::ObjectExt::Box<int32_t>(90));
series->get_DataPoints()->idx_get(1)->get_Value()->set_Data(System::ObjectExt::Box<int32_t>(123));
series->get_DataPoints()->idx_get(2)->get_Value()->set_Data(System::ObjectExt::Box<int32_t>(44));

// Pobiera drugą serię wykresu
series = chart->get_ChartData()->get_Series()->idx_get(1);

// Teraz aktualizuje dane serii
fact->GetCell(defaultWorksheetIndex, 0, 2, System::ObjectExt::Box<System::String>(u"New_Series2"));
// Modyfikowanie nazwy serii
series->get_DataPoints()->idx_get(0)->get_Value()->set_Data(System::ObjectExt::Box<int32_t>(23));
series->get_DataPoints()->idx_get(1)->get_Value()->set_Data(System::ObjectExt::Box<int32_t>(67));
series->get_DataPoints()->idx_get(2)->get_Value()->set_Data(System::ObjectExt::Box<int32_t>(99));


// Teraz dodaje nową serię
chart->get_ChartData()->get_Series()->Add(fact->GetCell(defaultWorksheetIndex, 0, 3, System::ObjectExt::Box<System::String>(u"Series 3")), chart->get_Type());

// Pobiera trzecią serię wykresu
series = chart->get_ChartData()->get_Series()->idx_get(2);

// Teraz wypełnia dane serii
series->get_DataPoints()->AddDataPointForBarSeries(fact->GetCell(defaultWorksheetIndex, 1, 3, System::ObjectExt::Box<int32_t>(20)));
series->get_DataPoints()->AddDataPointForBarSeries(fact->GetCell(defaultWorksheetIndex, 2, 3, System::ObjectExt::Box<int32_t>(50)));
series->get_DataPoints()->AddDataPointForBarSeries(fact->GetCell(defaultWorksheetIndex, 3, 3, System::ObjectExt::Box<int32_t>(30)));

chart->set_Type(Aspose::Slides::Charts::ChartType::ClusteredCylinder);

// Zapisuje prezentację z wykresem
pres->Save(u"AsposeChartModified_out.pptx", Aspose::Slides::Export::SaveFormat::Pptx);
Ustawienie zakresu danych dla wykresów
- Otwórz instancję klasy Presentation zawierającą wykres.
- Uzyskaj referencję do slajdu poprzez jego indeks.
- Przejdź przez wszystkie kształty, aby znaleźć żądany wykres.
- Uzyskaj dostęp do danych wykresu i ustaw zakres.
- Zapisz zmodyfikowaną prezentację jako plik PPTX.
Ten kod C++ pokazuje, jak ustawić zakres danych dla wykresu:
#include <DOM/Chart/IChartData.h>
#include <DOM/IChart.h>
#include <DOM/IShapeCollection.h>
#include <DOM/ISlide.h>
#include <DOM/ISlideCollection.h>
#include <DOM/Presentation.h>
#include <Export/SaveFormat.h>
#include <system/string.h>
using namespace Aspose::Slides;
using namespace Aspose::Slides::Charts;
using namespace Aspose::Slides::Export;
using namespace System;

// Ścieżka do katalogu dokumentów.
String dataDir = u"../documents/";

// Tworzy instancję klasy Presentation, która reprezentuje plik PPTX
auto presentation = System::MakeObject<Presentation>(dataDir + u"ExistingChart.pptx");

// Uzyskuje dostęp do pierwszego slajdu i dodaje wykres z domyślnymi danymi
auto slide = presentation->get_Slides()->idx_get(0);
auto chart = System::ExplicitCast<IChart>(slide->get_Shapes()->idx_get(0));
chart->get_ChartData()->SetRange(u"Sheet1!A1:B4");
presentation->Save(dataDir + u"SetDataRange_out.pptx", SaveFormat::Pptx);
Użycie domyślnych znaczników w wykresach
Gdy używasz domyślnego znacznika w wykresach, każda seria wykresu automatycznie otrzymuje inny domyślny symbol znacznika.
Ten kod C++ pokazuje, jak automatycznie ustawić znacznik serii wykresu:
#include <DOM/Chart/ChartType.h>
#include <DOM/Chart/IChartCategoryCollection.h>
#include <DOM/Chart/IChartData.h>
#include <DOM/Chart/IChartDataPointCollection.h>
#include <DOM/Chart/IChartDataWorkbook.h>
#include <DOM/Chart/IChartSeries.h>
#include <DOM/Chart/IChartSeriesCollection.h>
#include <DOM/Chart/ILegend.h>
#include <DOM/IChart.h>
#include <DOM/IShapeCollection.h>
#include <DOM/ISlide.h>
#include <DOM/ISlideCollection.h>
#include <DOM/Presentation.h>
#include <Export/SaveFormat.h>
#include <system/object_ext.h>
#include <system/string.h>
using namespace Aspose::Slides;
using namespace Aspose::Slides::Charts;
using namespace Aspose::Slides::Export;
using namespace System;

// Ścieżka do katalogu dokumentów.
String dataDir = u"../documents/";

auto pres = System::MakeObject<Presentation>();

auto slide = pres->get_Slides()->idx_get(0);
auto chart = slide->get_Shapes()->AddChart(ChartType::LineWithMarkers, 10.0f, 10.0f, 400.0f, 400.0f);

chart->get_ChartData()->get_Series()->Clear();
chart->get_ChartData()->get_Categories()->Clear();

auto wb = chart->get_ChartData()->get_ChartDataWorkbook();
chart->get_ChartData()->get_Series()->Add(wb->GetCell(0, 0, 1, ObjectExt::Box<String>(u"Series 1")), chart->get_Type());
auto series = chart->get_ChartData()->get_Series()->idx_get(0);

chart->get_ChartData()->get_Categories()->Add(wb->GetCell(0, 1, 0, ObjectExt::Box<String>(u"C1")));
series->get_DataPoints()->AddDataPointForLineSeries(wb->GetCell(0, 1, 1, ObjectExt::Box<int32_t>(24)));
chart->get_ChartData()->get_Categories()->Add(wb->GetCell(0, 2, 0, ObjectExt::Box<String>(u"C2")));
series->get_DataPoints()->AddDataPointForLineSeries(wb->GetCell(0, 2, 1, ObjectExt::Box<int32_t>(23)));
chart->get_ChartData()->get_Categories()->Add(wb->GetCell(0, 3, 0, ObjectExt::Box<String>(u"C3")));
series->get_DataPoints()->AddDataPointForLineSeries(wb->GetCell(0, 3, 1, ObjectExt::Box<int32_t>(-10)));
chart->get_ChartData()->get_Categories()->Add(wb->GetCell(0, 4, 0, ObjectExt::Box<String>(u"C4")));
series->get_DataPoints()->AddDataPointForLineSeries(wb->GetCell(0, 4, 1, nullptr));

chart->get_ChartData()->get_Series()->Add(wb->GetCell(0, 0, 2, ObjectExt::Box<String>(u"Series 2")), chart->get_Type());

// Pobiera drugą serię wykresu
auto series2 = chart->get_ChartData()->get_Series()->idx_get(1);

// Wypełnia dane serii
series2->get_DataPoints()->AddDataPointForLineSeries(wb->GetCell(0, 1, 2, ObjectExt::Box<int32_t>(30)));
series2->get_DataPoints()->AddDataPointForLineSeries(wb->GetCell(0, 2, 2, ObjectExt::Box<int32_t>(10)));
series2->get_DataPoints()->AddDataPointForLineSeries(wb->GetCell(0, 3, 2, ObjectExt::Box<int32_t>(60)));
series2->get_DataPoints()->AddDataPointForLineSeries(wb->GetCell(0, 4, 2, ObjectExt::Box<int32_t>(40)));

chart->set_HasLegend(true);
chart->get_Legend()->set_Overlay(false);

pres->Save(dataDir + u"DefaultMarkersInChart.pptx", SaveFormat::Pptx);
FAQ
Jakie typy wykresów są obsługiwane przez Aspose.Slides?
Aspose.Slides obsługuje szeroką gamę typów wykresów, w tym słupkowe, liniowe, kołowe, powierzchniowe, punktowe, histogram, radar i wiele innych. Ta elastyczność pozwala wybrać najodpowiedniejszy typ wykresu do potrzeb wizualizacji danych.
Jak dodać nowy wykres do slajdu?
Aby dodać wykres, najpierw tworzysz instancję klasy Presentation, pobierasz żądany slajd przy użyciu jego indeksu, a następnie wywołujesz metodę dodania wykresu, określając typ wykresu i początkowe dane. Proces ten integruje wykres bezpośrednio w Twojej prezentacji.
Jak mogę zaktualizować dane wyświetlane w wykresie?
Możesz zaktualizować dane wykresu, uzyskując dostęp do jego skoroszytu danych (IChartDataWorkbook), czyszcząc domyślne serie i kategorie, a następnie dodając własne dane. Umożliwia to programowe odświeżenie wykresu, aby odzwierciedlił najnowsze dane.
Czy można dostosować wygląd wykresu?
Tak, Aspose.Slides oferuje rozbudowane opcje personalizacji. Możesz modyfikować kolory, czcionki, etykiety, legendy i inne elementy formatowania, aby dopasować wygląd wykresu do konkretnych wymagań projektowych.