
Membuat atau Memperbarui Diagram Presentasi PowerPoint dalam C++
Ikhtisar
Artikel ini menyediakan panduan komprehensif tentang cara membuat dan menyesuaikan diagram menggunakan Aspose.Slides. Anda akan belajar cara menambahkan diagram secara programatik ke slide, mengisinya dengan data, dan menerapkan berbagai opsi pemformatan untuk memenuhi kebutuhan desain spesifik Anda. Sepanjang artikel, contoh kode terperinci menggambarkan setiap langkah, mulai dari menginisialisasi presentasi dan objek diagram hingga mengonfigurasi seri, sumbu, dan legenda. Dengan mengikuti panduan ini, Anda akan memperoleh pemahaman yang kuat tentang cara mengintegrasikan pembuatan diagram dinamis ke dalam aplikasi Anda, mempermudah proses pembuatan presentasi berbasis data.
Buat Diagram
Diagram membantu orang dengan cepat memvisualisasikan data dan memperoleh wawasan, yang mungkin tidak langsung terlihat dari tabel atau spreadsheet.
Mengapa Membuat Diagram?
Dengan diagram, Anda dapat
- menggabungkan, merangkum, atau menyimpulkan sejumlah besar data pada satu slide dalam presentasi
- menampilkan pola dan tren dalam data
- menyimpulkan arah dan momentum data seiring waktu atau terhadap satuan pengukuran tertentu
- menemukan outlier, penyimpangan, deviasi, kesalahan, data yang tidak masuk akal, dll.
- mengkomunikasikan atau menyajikan data yang kompleks
Di PowerPoint, Anda dapat membuat diagram melalui fungsi sisipkan, yang menyediakan templat untuk merancang banyak jenis diagram. Menggunakan Aspose.Slides, Anda dapat membuat diagram reguler (berdasarkan jenis diagram populer) dan diagram khusus.
Buat Diagram Normal
- Buat instance kelas Presentation.
- Dapatkan referensi slide melalui indeksnya.
- Tambahkan diagram dengan beberapa data dan tentukan tipe diagram yang Anda inginkan.
- Tambahkan judul untuk diagram.
- Akses lembar kerja data diagram.
- Hapus semua seri dan kategori default.
- Tambahkan seri dan kategori baru.
- Tambahkan data diagram baru untuk seri diagram.
- Tambahkan warna isi untuk seri diagram.
- Tambahkan label untuk seri diagram.
- Tulis presentasi yang telah dimodifikasi sebagai file PPTX.
Kode C++ berikut menunjukkan cara membuat diagram normal:
#include <DOM/Chart/ChartType.h>
#include <DOM/Chart/IChartCategoryCollection.h>
#include <DOM/Chart/IChartData.h>
#include <DOM/Chart/IChartDataPoint.h>
#include <DOM/Chart/IChartDataPointCollection.h>
#include <DOM/Chart/IChartDataWorkbook.h>
#include <DOM/Chart/IChartSeries.h>
#include <DOM/Chart/IChartSeriesCollection.h>
#include <DOM/Chart/IChartTitle.h>
#include <DOM/Chart/IDataLabel.h>
#include <DOM/Chart/IDataLabelFormat.h>
#include <DOM/Chart/IFormat.h>
#include <DOM/FillType.h>
#include <DOM/IChart.h>
#include <DOM/IColorFormat.h>
#include <DOM/IFillFormat.h>
#include <DOM/IShapeCollection.h>
#include <DOM/ISlide.h>
#include <DOM/ISlideCollection.h>
#include <DOM/ITextFrame.h>
#include <DOM/ITextFrameFormat.h>
#include <DOM/NullableBool.h>
#include <DOM/Presentation.h>
#include <Export/SaveFormat.h>
#include <drawing/color.h>
#include <system/string.h>
using namespace Aspose::Slides;
using namespace Aspose::Slides::Charts;
using namespace Aspose::Slides::Export;
using namespace System;
using namespace System::Drawing;

// The path to the documents directory.
	const String outPath = u"../out/NormalCharts_out.pptx";

	//Instantiates a presentation class that represents a PPTX file
	SharedPtr<Presentation> pres = MakeObject<Presentation>();

	//Accesses first slide
	SharedPtr<ISlide> slide = pres->get_Slides()->idx_get(0);

	// Adds a chart with default data
	SharedPtr<IChart> chart = slide->get_Shapes()->AddChart(Aspose::Slides::Charts::ChartType::ClusteredColumn, 0, 0, 500, 500);


	// Sets the index of chart data sheet
	int defaultWorksheetIndex = 0;

	// Gets the chart data worksheet
	SharedPtr<IChartDataWorkbook> fact = chart->get_ChartData()->get_ChartDataWorkbook();

	// Sets the chart Title
	chart->get_ChartTitle()->AddTextFrameForOverriding(u"Sample Title");
	chart->get_ChartTitle()->get_TextFrameForOverriding()->get_TextFrameFormat()->set_CenterText ( NullableBool::True);
	chart->get_ChartTitle()->set_Height(20);
	chart->set_HasTitle( true);

	// Deletes the default generated series and categories
	chart->get_ChartData()->get_Series()->Clear();
	chart->get_ChartData()->get_Categories()->Clear();
	int s = chart->get_ChartData()->get_Series()->get_Count();
	s = chart->get_ChartData()->get_Categories()->get_Count();


	// Adds a new series
	chart->get_ChartData()->get_Series()->Add(fact->GetCell(defaultWorksheetIndex, 0, 1, ObjectExt::Box<System::String>(u"Series 1")), chart->get_Type());
	chart->get_ChartData()->get_Series()->Add(fact->GetCell(defaultWorksheetIndex, 0, 2, ObjectExt::Box<System::String>(u"Series 2")), chart->get_Type());

	// Adds catrgories
	chart->get_ChartData()->get_Categories()->Add(fact->GetCell(defaultWorksheetIndex, 1, 0, ObjectExt::Box<System::String>(u"Caetegoty 1")));
	chart->get_ChartData()->get_Categories()->Add(fact->GetCell(defaultWorksheetIndex, 2, 0, ObjectExt::Box<System::String>(u"Caetegoty 2")));
	chart->get_ChartData()->get_Categories()->Add(fact->GetCell(defaultWorksheetIndex, 3, 0, ObjectExt::Box<System::String>(u"Caetegoty 3")));


	// Takes the first chart series
	SharedPtr<IChartSeries> series = chart->get_ChartData()->get_Series()->idx_get(0);

	// Populates the series data
	series->get_DataPoints()->AddDataPointForBarSeries(fact->GetCell(defaultWorksheetIndex, 1, 1, ObjectExt::Box<double>(20)));
	series->get_DataPoints()->AddDataPointForBarSeries(fact->GetCell(defaultWorksheetIndex, 2, 1, ObjectExt::Box<double>(50)));
	series->get_DataPoints()->AddDataPointForBarSeries(fact->GetCell(defaultWorksheetIndex, 3, 1, ObjectExt::Box<double>(30)));

	// Sets the fill color for series
	series->get_Format()->get_Fill()->set_FillType(FillType::Solid);
	series->get_Format()->get_Fill()->get_SolidFillColor()->set_Color(System::Drawing::Color::get_Red());


	// Takes the second chart series
	 series = chart->get_ChartData()->get_Series()->idx_get(1);

	// Populates the series data
	series->get_DataPoints()->AddDataPointForBarSeries(fact->GetCell(defaultWorksheetIndex, 1, 2, ObjectExt::Box<double>(30)));
	series->get_DataPoints()->AddDataPointForBarSeries(fact->GetCell(defaultWorksheetIndex, 2, 2, ObjectExt::Box<double>(10)));
	series->get_DataPoints()->AddDataPointForBarSeries(fact->GetCell(defaultWorksheetIndex, 3, 2, ObjectExt::Box<double>(60)));

	// Sets the fill color for series
	series->get_Format()->get_Fill()->set_FillType(FillType::Solid);
	series->get_Format()->get_Fill()->get_SolidFillColor()->set_Color(System::Drawing::Color::get_Green());


	// First label is set to show category name
	SharedPtr<IDataLabel> lbl = series->get_DataPoints()->idx_get(0)->get_Label();
	lbl->get_DataLabelFormat()->set_ShowCategoryName(true);

	lbl = series->get_DataPoints()->idx_get(1)->get_Label();
	lbl->get_DataLabelFormat()->set_ShowSeriesName (true);

	// Shows the value for third label
	lbl = series->get_DataPoints()->idx_get(2)->get_Label();
	lbl->get_DataLabelFormat()->set_ShowValue (true);
	lbl->get_DataLabelFormat()->set_ShowSeriesName(true);
	lbl->get_DataLabelFormat()->set_Separator (u"/");

	// Saves the presentation
	pres->Save(outPath, Aspose::Slides::Export::SaveFormat::Pptx);
Buat Diagram Sebaran
Diagram sebar (juga dikenal sebagai scatter plot atau grafik x‑y) sering digunakan untuk memeriksa pola atau menunjukkan korelasi antara dua variabel.
Anda mungkin ingin menggunakan diagram sebar ketika
- Anda memiliki data numerik berpasangan
- Anda memiliki 2 variabel yang saling berpasangan dengan baik
- Anda ingin menentukan apakah 2 variabel saling terkait
- Anda memiliki variabel independen yang memiliki banyak nilai untuk variabel dependen
Kode C++ berikut menunjukkan cara membuat diagram sebar dengan serangkaian penanda yang berbeda:
#include <DOM/Chart/ChartType.h>
#include <DOM/Chart/IChartData.h>
#include <DOM/Chart/IChartDataPoint.h>
#include <DOM/Chart/IChartDataPointCollection.h>
#include <DOM/Chart/IChartDataWorkbook.h>
#include <DOM/Chart/IChartSeries.h>
#include <DOM/Chart/IChartSeriesCollection.h>
#include <DOM/Chart/IChartSeriesGroup.h>
#include <DOM/Chart/IChartSeriesGroupCollection.h>
#include <DOM/Chart/IChartTitle.h>
#include <DOM/Chart/IDataLabel.h>
#include <DOM/Chart/IDataLabelCollection.h>
#include <DOM/Chart/IDataLabelFormat.h>
#include <DOM/Chart/IFormat.h>
#include <DOM/Chart/IMarker.h>
#include <DOM/Chart/MarkerStyleType.h>
#include <DOM/FillType.h>
#include <DOM/IChart.h>
#include <DOM/IColorFormat.h>
#include <DOM/IFillFormat.h>
#include <DOM/ILineFillFormat.h>
#include <DOM/ILineFormat.h>
#include <DOM/IShapeCollection.h>
#include <DOM/ISlide.h>
#include <DOM/ISlideCollection.h>
#include <DOM/ITextFrame.h>
#include <DOM/ITextFrameFormat.h>
#include <DOM/LineDashStyle.h>
#include <DOM/LineStyle.h>
#include <DOM/NullableBool.h>
#include <DOM/Presentation.h>
#include <Export/SaveFormat.h>
#include <drawing/color.h>
#include <system/string.h>
using namespace Aspose::Slides;
using namespace Aspose::Slides::Charts;
using namespace System;

// Jalur ke direktori dokumen.
	const String outPath = u"../out/ScatteredChart_out.pptx";

	//Membuat instance kelas presentasi yang mewakili file PPTX
	SharedPtr<Presentation> pres = MakeObject<Presentation>();

	//Mengakses slide pertama
	SharedPtr<ISlide> slide = pres->get_Slides()->idx_get(0);

	// Menambahkan diagram dengan data default
	SharedPtr<IChart> chart = slide->get_Shapes()->AddChart(Aspose::Slides::Charts::ChartType::ScatterWithSmoothLines, 0, 0, 500, 500);

	// Mengatur Judul diagram
	chart->get_ChartTitle()->AddTextFrameForOverriding(u"Sample Title");
	chart->get_ChartTitle()->get_TextFrameForOverriding()->get_TextFrameFormat()->set_CenterText(NullableBool::True);
	chart->get_ChartTitle()->set_Height(20);
	chart->set_HasTitle(true);

	// Menghapus seri yang dihasilkan secara default
	chart->get_ChartData()->get_Series()->Clear();

	// Mengatur indeks untuk lembar data diagram
	int defaultWorksheetIndex = 0;

	// Mendapatkan lembar kerja data diagram
	SharedPtr<IChartDataWorkbook> fact = chart->get_ChartData()->get_ChartDataWorkbook();


	// Menambahkan seri baru
	chart->get_ChartData()->get_Series()->Add(fact->GetCell(defaultWorksheetIndex, 1, 1, ObjectExt::Box<System::String>(u"Series 1")), chart->get_Type());
	chart->get_ChartData()->get_Series()->Add(fact->GetCell(defaultWorksheetIndex, 1, 3, ObjectExt::Box<System::String>(u"Series 2")), chart->get_Type());

	// Mengambil seri diagram pertama
	SharedPtr<IChartSeries> series = chart->get_ChartData()->get_Series()->idx_get(0);

	// Menambahkan titik baru (1:3)
	series->get_DataPoints()->AddDataPointForScatterSeries(fact->GetCell(defaultWorksheetIndex, 2, 1, ObjectExt::Box<double>(1)), fact->GetCell(defaultWorksheetIndex, 2, 2, ObjectExt::Box<double>(3)));

	// Menambahkan titik baru (2:10)
	series->get_DataPoints()->AddDataPointForScatterSeries(fact->GetCell(defaultWorksheetIndex, 3, 1, ObjectExt::Box<double>(2)), fact->GetCell(defaultWorksheetIndex, 3, 2, ObjectExt::Box<double>(10)));

	// Mengedit tipe seri
	series->set_Type (ChartType::ScatterWithStraightLinesAndMarkers);

	// Mengubah penanda seri diagram
	series->get_Marker()->set_Size  (10);
	series->get_Marker()->set_Symbol(MarkerStyleType::Star);


	// Mengambil seri diagram kedua
	series  = chart->get_ChartData()->get_Series()->idx_get(1);

	// Menambahkan titik baru (5:2)
	series->get_DataPoints()->AddDataPointForScatterSeries(fact->GetCell(defaultWorksheetIndex, 2, 3, ObjectExt::Box<double>(5)), fact->GetCell(defaultWorksheetIndex, 2, 4, ObjectExt::Box<double>(2)));

	// Menambahkan titik baru (3:1)
	series->get_DataPoints()->AddDataPointForScatterSeries(fact->GetCell(defaultWorksheetIndex, 3, 3, ObjectExt::Box<double>(3)), fact->GetCell(defaultWorksheetIndex, 3, 4, ObjectExt::Box<double>(1)));

	// Menambahkan titik baru (2:2)
	series->get_DataPoints()->AddDataPointForScatterSeries(fact->GetCell(defaultWorksheetIndex, 4, 3, ObjectExt::Box<double>(2)), fact->GetCell(defaultWorksheetIndex, 4, 4, ObjectExt::Box<double>(2)));

	// Menambahkan titik baru (5:1)
	series->get_DataPoints()->AddDataPointForScatterSeries(fact->GetCell(defaultWorksheetIndex, 5, 3, ObjectExt::Box<double>(5)), fact->GetCell(defaultWorksheetIndex, 5, 4, ObjectExt::Box<double>(1)));

	// Mengubah penanda seri diagram
	series->get_Marker()->set_Size ( 10);
	series->get_Marker()->set_Symbol(MarkerStyleType::Circle);


	chart->get_ChartData()->get_SeriesGroups()->idx_get(0)->set_IsColorVaried(true);

	SharedPtr<IChartDataPoint> point = series->get_DataPoints()->idx_get(0);
	point->get_Format()->get_Fill()->set_FillType(FillType::Solid);
	point->get_Format()->get_Fill()->get_SolidFillColor()->set_Color(System::Drawing::Color::get_Cyan());
	// Mengatur batas sektor
	point->get_Format()->get_Line()->get_FillFormat()->set_FillType(FillType::Solid);
	point->get_Format()->get_Line()->get_FillFormat()->get_SolidFillColor()->set_Color(System::Drawing::Color::get_Gray());
	point->get_Format()->get_Line()->set_Width ( 3.0);
	point->get_Format()->get_Line()->set_Style(LineStyle::ThinThick);
	point->get_Format()->get_Line()->set_DashStyle(LineDashStyle::DashDot);

	SharedPtr<IChartDataPoint> point1 = series->get_DataPoints()->idx_get(1);
	point1->get_Format()->get_Fill()->set_FillType(FillType::Solid);
	point1->get_Format()->get_Fill()->get_SolidFillColor()->set_Color(System::Drawing::Color::get_Brown());

	// Mengatur batas sektor
	point1->get_Format()->get_Line()->get_FillFormat()->set_FillType(FillType::Solid);
	point1->get_Format()->get_Line()->get_FillFormat()->get_SolidFillColor()->set_Color(System::Drawing::Color::get_Blue());
	point1->get_Format()->get_Line()->set_Width (3.0);
	point1->get_Format()->get_Line()->set_Style(LineStyle::Single);
	point1->get_Format()->get_Line()->set_DashStyle(LineDashStyle::LargeDashDot);


	SharedPtr<IChartDataPoint> point2 = series->get_DataPoints()->idx_get(2);
	point2->get_Format()->get_Fill()->set_FillType(FillType::Solid);
	point2->get_Format()->get_Fill()->get_SolidFillColor()->set_Color(System::Drawing::Color::get_Coral());

	// Mengatur batas sektor
	point2->get_Format()->get_Line()->get_FillFormat()->set_FillType(FillType::Solid);
	point2->get_Format()->get_Line()->get_FillFormat()->get_SolidFillColor()->set_Color(System::Drawing::Color::get_Red());
	point2->get_Format()->get_Line()->set_Width ( 2.0);
	point2->get_Format()->get_Line()->set_Style(LineStyle::ThickThin);
	point2->get_Format()->get_Line()->set_DashStyle(LineDashStyle::LargeDashDotDot);


	// Membuat label khusus untuk setiap kategori seri baru
	SharedPtr<IDataLabel> lbl1 = series->get_DataPoints()->idx_get(0)->get_Label();

	// lbl.ShowCategoryName = true;
	lbl1->get_DataLabelFormat()->set_ShowValue(true);


	SharedPtr<IDataLabel> lbl2 = series->get_DataPoints()->idx_get(1)->get_Label();
	lbl2->get_DataLabelFormat()->set_ShowValue(true);
	lbl2->get_DataLabelFormat()->set_ShowLegendKey(true);
	lbl2->get_DataLabelFormat()->set_ShowPercentage(true);

	SharedPtr<IDataLabel> lbl3 = series->get_DataPoints()->idx_get(2)->get_Label();

	lbl3->get_DataLabelFormat()->set_ShowSeriesName(true);
	lbl3->get_DataLabelFormat()->set_ShowPercentage(true);

	// Menampilkan garis pemimpin untuk Diagram
	series->get_Labels()->get_DefaultDataLabelFormat()->set_ShowLeaderLines(true);

	// Mengatur sudut rotasi untuk sektor diagram pai
	chart->get_ChartData()->get_SeriesGroups()->idx_get(0)->set_FirstSliceAngle(180);


	// Menyimpan presentasi
	pres->Save(outPath, Aspose::Slides::Export::SaveFormat::Pptx);
Buat Diagram Pai
Diagram pai paling cocok untuk menunjukkan hubungan bagian‑dengan‑keseluruhan dalam data, terutama ketika data berisi label kategori dengan nilai numerik. Namun, jika data Anda memiliki banyak bagian atau label, Anda mungkin ingin mempertimbangkan menggunakan diagram batang sebagai gantinya.
- Buat instance kelas Presentation.
- Dapatkan referensi slide melalui indeksnya.
- Tambahkan diagram dengan data default beserta tipe yang diinginkan (dalam kasus ini,
ChartType.Pie). - Akses data diagram IChartDataWorkbook.
- Hapus seri dan kategori default.
- Tambahkan seri dan kategori baru.
- Tambahkan data diagram baru untuk seri diagram.
- Tambahkan titik baru untuk diagram dan tambahkan warna khusus untuk sektor diagram pai.
- Atur label untuk seri.
- Atur garis pemimpin untuk label seri.
- Atur sudut rotasi untuk slide diagram pai.
- Tulis presentasi yang telah dimodifikasi ke file PPTX
Kode C++ berikut menunjukkan cara membuat diagram pai:
#include <DOM/Chart/ChartType.h>
#include <DOM/Chart/IChartCategoryCollection.h>
#include <DOM/Chart/IChartData.h>
#include <DOM/Chart/IChartDataPoint.h>
#include <DOM/Chart/IChartDataPointCollection.h>
#include <DOM/Chart/IChartDataWorkbook.h>
#include <DOM/Chart/IChartSeries.h>
#include <DOM/Chart/IChartSeriesCollection.h>
#include <DOM/Chart/IChartSeriesGroup.h>
#include <DOM/Chart/IChartSeriesGroupCollection.h>
#include <DOM/Chart/IChartTitle.h>
#include <DOM/Chart/IDataLabel.h>
#include <DOM/Chart/IDataLabelCollection.h>
#include <DOM/Chart/IDataLabelFormat.h>
#include <DOM/Chart/IFormat.h>
#include <DOM/FillType.h>
#include <DOM/IChart.h>
#include <DOM/IColorFormat.h>
#include <DOM/IFillFormat.h>
#include <DOM/ILineFillFormat.h>
#include <DOM/ILineFormat.h>
#include <DOM/IShapeCollection.h>
#include <DOM/ISlide.h>
#include <DOM/ISlideCollection.h>
#include <DOM/ITextFrame.h>
#include <DOM/ITextFrameFormat.h>
#include <DOM/LineDashStyle.h>
#include <DOM/LineStyle.h>
#include <DOM/NullableBool.h>
#include <DOM/Presentation.h>
#include <Export/SaveFormat.h>
#include <drawing/color.h>
#include <system/string.h>
using namespace Aspose::Slides;
using namespace Aspose::Slides::Charts;
using namespace System;

	// Jalur ke direktori dokumen.
	const String outPath = u"../out/PieChart_out.pptx";

	//Instantiates a Presentation class that represents a PPTX file
	SharedPtr<Presentation> pres = MakeObject<Presentation>();

	//Accesses first slide
	SharedPtr<ISlide> slide = pres->get_Slides()->idx_get(0);

	// Adds a chart with default data
	SharedPtr<IChart> chart = slide->get_Shapes()->AddChart(Aspose::Slides::Charts::ChartType::Pie, 0, 0, 500, 500);

	// Sets the chart Title
	chart->get_ChartTitle()->AddTextFrameForOverriding(u"Sample Title");
	chart->get_ChartTitle()->get_TextFrameForOverriding()->get_TextFrameFormat()->set_CenterText(NullableBool::True);
	chart->get_ChartTitle()->set_Height(20);
	chart->set_HasTitle(true);

	// Deletes the default generated series and categories
	chart->get_ChartData()->get_Series()->Clear();
	chart->get_ChartData()->get_Categories()->Clear();

	// Sets the index of chart data sheet
	int defaultWorksheetIndex = 0;

	// Gets the chart data worksheet
	SharedPtr<IChartDataWorkbook> fact = chart->get_ChartData()->get_ChartDataWorkbook();

	// Adds Catrgories
	chart->get_ChartData()->get_Categories()->Add(fact->GetCell(defaultWorksheetIndex, 1, 0, ObjectExt::Box<System::String>(u"First Qtr")));
	chart->get_ChartData()->get_Categories()->Add(fact->GetCell(defaultWorksheetIndex, 2, 0, ObjectExt::Box<System::String>(u"2nd Qtr")));
	chart->get_ChartData()->get_Categories()->Add(fact->GetCell(defaultWorksheetIndex, 3, 0, ObjectExt::Box<System::String>(u"3ed Qtr")));

	// Adds a new series
	chart->get_ChartData()->get_Series()->Add(fact->GetCell(defaultWorksheetIndex, 0, 1, ObjectExt::Box<System::String>(u"Series 1")), chart->get_Type());

	// Takes the first chart series
	SharedPtr<IChartSeries> series = chart->get_ChartData()->get_Series()->idx_get(0);

	// Populates the series data
	series->get_DataPoints()->AddDataPointForPieSeries(fact->GetCell(defaultWorksheetIndex, 1, 1, ObjectExt::Box<double>(20)));
	series->get_DataPoints()->AddDataPointForPieSeries(fact->GetCell(defaultWorksheetIndex, 2, 1, ObjectExt::Box<double>(50)));
	series->get_DataPoints()->AddDataPointForPieSeries(fact->GetCell(defaultWorksheetIndex, 3, 1, ObjectExt::Box<double>(30)));

	chart->get_ChartData()->get_SeriesGroups()->idx_get(0)->set_IsColorVaried(true);

	SharedPtr<IChartDataPoint> point = series->get_DataPoints()->idx_get(0);
	point->get_Format()->get_Fill()->set_FillType(FillType::Solid);
	point->get_Format()->get_Fill()->get_SolidFillColor()->set_Color(System::Drawing::Color::get_Cyan());
	// Sets the Sector border
	point->get_Format()->get_Line()->get_FillFormat()->set_FillType(FillType::Solid);
	point->get_Format()->get_Line()->get_FillFormat()->get_SolidFillColor()->set_Color(System::Drawing::Color::get_Gray());
	point->get_Format()->get_Line()->set_Width ( 3.0);
	point->get_Format()->get_Line()->set_Style( LineStyle::ThinThick);
	point->get_Format()->get_Line()->set_DashStyle ( LineDashStyle::DashDot);

	SharedPtr<IChartDataPoint> point1 = series->get_DataPoints()->idx_get(1);
	point1->get_Format()->get_Fill()->set_FillType(FillType::Solid);
	point1->get_Format()->get_Fill()->get_SolidFillColor()->set_Color(System::Drawing::Color::get_Brown());

	// Sets the Sector border
	point1->get_Format()->get_Line()->get_FillFormat()->set_FillType(FillType::Solid);
	point1->get_Format()->get_Line()->get_FillFormat()->get_SolidFillColor()->set_Color(System::Drawing::Color::get_Blue());
	point1->get_Format()->get_Line()->set_Width (3.0);
	point1->get_Format()->get_Line()->set_Style(LineStyle::Single);
	point1->get_Format()->get_Line()->set_DashStyle(LineDashStyle::LargeDashDot);


	SharedPtr<IChartDataPoint> point2 = series->get_DataPoints()->idx_get(2);
	point2->get_Format()->get_Fill()->set_FillType(FillType::Solid);
	point2->get_Format()->get_Fill()->get_SolidFillColor()->set_Color(System::Drawing::Color::get_Coral());

	// Sets the Sector border
	point2->get_Format()->get_Line()->get_FillFormat()->set_FillType(FillType::Solid);
	point2->get_Format()->get_Line()->get_FillFormat()->get_SolidFillColor()->set_Color(System::Drawing::Color::get_Red());
	point2->get_Format()->get_Line()->set_Width (2.0);
	point2->get_Format()->get_Line()->set_Style(LineStyle::ThickThin);
	point2->get_Format()->get_Line()->set_DashStyle(LineDashStyle::LargeDashDotDot);


	// Creates custom labels for each of categories for new series
	SharedPtr<IDataLabel> lbl1 = series->get_DataPoints()->idx_get(0)->get_Label();

	// lbl.ShowCategoryName = true;
	lbl1->get_DataLabelFormat()->set_ShowValue(true);


	SharedPtr<IDataLabel> lbl2 = series->get_DataPoints()->idx_get(1)->get_Label();
	lbl2->get_DataLabelFormat()->set_ShowValue(true);
	lbl2->get_DataLabelFormat()->set_ShowLegendKey(true);
	lbl2->get_DataLabelFormat()->set_ShowPercentage(true);

	SharedPtr<IDataLabel> lbl3 = series->get_DataPoints()->idx_get(2)->get_Label();

	lbl3->get_DataLabelFormat()->set_ShowSeriesName(true);
	lbl3->get_DataLabelFormat()->set_ShowPercentage(true);

	// Sets the series to show leader lines for the chart
	series->get_Labels()->get_DefaultDataLabelFormat()->set_ShowLeaderLines ( true);

	// Sets the rotation angle for the pie chart sectors
	chart->get_ChartData()->get_SeriesGroups()->idx_get(0)->set_FirstSliceAngle ( 180);


	// Saves the presentation
	pres->Save(outPath, Aspose::Slides::Export::SaveFormat::Pptx);
Buat Diagram Garis
Diagram garis (juga dikenal sebagai grafik garis) paling cocok untuk situasi di mana Anda ingin menunjukkan perubahan nilai seiring waktu. Menggunakan diagram garis, Anda dapat membandingkan banyak data sekaligus, melacak perubahan dan tren seiring waktu, menyoroti anomali dalam seri data, dll.
- Buat instance kelas Presentation.
- Dapatkan referensi slide melalui indeksnya.
- Tambahkan diagram dengan data default beserta tipe yang diinginkan (dalam kasus ini,
ChartType::Line). - Akses data diagram IChartDataWorkbook.
- Hapus seri dan kategori default.
- Tambahkan seri dan kategori baru.
- Tambahkan data diagram baru untuk seri diagram.
- Tulis presentasi yang telah dimodifikasi ke file PPTX
Kode C++ berikut menunjukkan cara membuat diagram garis:
#include <DOM/Chart/ChartType.h>
#include <DOM/IChart.h>
#include <DOM/IShapeCollection.h>
#include <DOM/ISlide.h>
#include <DOM/ISlideCollection.h>
#include <DOM/Presentation.h>
#include <Export/SaveFormat.h>
using namespace Aspose::Slides;
using namespace Aspose::Slides::Charts;
using namespace Aspose::Slides::Export;

auto pres = System::MakeObject<Presentation>();

System::SharedPtr<IChart> lineChart = pres->get_Slides()->idx_get(0)->get_Shapes()->AddChart(ChartType::Line, 10.0f, 50.0f, 600.0f, 350.0f);
pres->Save(u"lineChart.pptx", SaveFormat::Pptx);
Secara default, titik pada diagram garis dihubungkan oleh garis lurus berkelanjutan. Jika Anda ingin titik‑titik tersebut dihubungkan oleh garis putus‑putus, Anda dapat menentukan tipe dash yang diinginkan seperti berikut:
#include <DOM/Chart/ChartType.h>
#include <DOM/Chart/IChartData.h>
#include <DOM/Chart/IChartSeries.h>
#include <DOM/Chart/IChartSeriesCollection.h>
#include <DOM/Chart/IFormat.h>
#include <DOM/IChart.h>
#include <DOM/ILineFormat.h>
#include <DOM/IShapeCollection.h>
#include <DOM/ISlide.h>
#include <DOM/ISlideCollection.h>
#include <DOM/LineDashStyle.h>
#include <DOM/Presentation.h>
using namespace Aspose::Slides;
using namespace Aspose::Slides::Charts;

auto pres = System::MakeObject<Presentation>();

System::SharedPtr<IChart> lineChart = pres->get_Slides()->idx_get(0)->get_Shapes()->AddChart(ChartType::Line, 10.0f, 50.0f, 600.0f, 350.0f);
for (auto&& series : lineChart->get_ChartData()->get_Series())
{
    series->get_Format()->get_Line()->set_DashStyle(LineDashStyle::Dash);
}
Buat Diagram Tree Map
Diagram tree map paling cocok untuk data penjualan ketika Anda ingin menunjukkan ukuran relatif kategori data dan (pada saat yang sama) dengan cepat menarik perhatian ke item yang menjadi kontributor besar bagi setiap kategori.
- Buat instance kelas Presentation.
- Dapatkan referensi slide melalui indeksnya.
- Tambahkan diagram dengan data default beserta tipe yang diinginkan (dalam kasus ini,
ChartType.TreeMap). - Akses data diagram IChartDataWorkbook.
- Hapus seri dan kategori default.
- Tambahkan seri dan kategori baru.
- Tambahkan data diagram baru untuk seri diagram.
- Tulis presentasi yang telah dimodifikasi ke file PPTX
Kode C++ berikut menunjukkan cara membuat diagram tree map:
#include <DOM/Chart/ChartType.h>
#include <DOM/Chart/IChartCategory.h>
#include <DOM/Chart/IChartCategoryCollection.h>
#include <DOM/Chart/IChartCategoryLevelsManager.h>
#include <DOM/Chart/IChartData.h>
#include <DOM/Chart/IChartDataPointCollection.h>
#include <DOM/Chart/IChartDataWorkbook.h>
#include <DOM/Chart/IChartSeries.h>
#include <DOM/Chart/IChartSeriesCollection.h>
#include <DOM/Chart/IDataLabelCollection.h>
#include <DOM/Chart/IDataLabelFormat.h>
#include <DOM/Chart/ParentLabelLayoutType.h>
#include <DOM/IChart.h>
#include <DOM/IShapeCollection.h>
#include <DOM/ISlide.h>
#include <DOM/ISlideCollection.h>
#include <DOM/Presentation.h>
#include <Export/SaveFormat.h>
#include <system/string.h>
using namespace Aspose::Slides;
using namespace Aspose::Slides::Charts;
using namespace Aspose::Slides::Export;
using namespace System;

// Jalur ke direktori dokumen.
	const String outPath = u"../out/TreemapChart_out.pptx";

	//Membuat instance kelas Presentation yang mewakili file PPTX
	SharedPtr<Presentation> pres = MakeObject<Presentation>();

	// Mengakses slide pertama
	SharedPtr<ISlide> slide = pres->get_Slides()->idx_get(0);

	System::SharedPtr<IChart> chart = slide->get_Shapes()->AddChart(Aspose::Slides::Charts::ChartType::Treemap, 50, 50, 500, 400);
	chart->get_ChartData()->get_Categories()->Clear();
	chart->get_ChartData()->get_Series()->Clear();

	System::SharedPtr<IChartDataWorkbook> wb = chart->get_ChartData()->get_ChartDataWorkbook();

	wb->Clear(0);

	// Cabang 1
	System::SharedPtr<IChartCategory> leaf = chart->get_ChartData()->get_Categories()->Add(wb->GetCell(0, u"C1", System::ObjectExt::Box<System::String>(u"Leaf1")));
	leaf->get_GroupingLevels()->SetGroupingItem(1, System::ObjectExt::Box<System::String>(u"Stem1"));
	leaf->get_GroupingLevels()->SetGroupingItem(2, System::ObjectExt::Box<System::String>(u"Branch1"));

	chart->get_ChartData()->get_Categories()->Add(wb->GetCell(0, u"C2", System::ObjectExt::Box<System::String>(u"Leaf2")));

	leaf = chart->get_ChartData()->get_Categories()->Add(wb->GetCell(0, u"C3", System::ObjectExt::Box<System::String>(u"Leaf3")));
	leaf->get_GroupingLevels()->SetGroupingItem(1, System::ObjectExt::Box<System::String>(u"Stem2"));

	chart->get_ChartData()->get_Categories()->Add(wb->GetCell(0, u"C4", System::ObjectExt::Box<System::String>(u"Leaf4")));


	// Cabang 2
	leaf = chart->get_ChartData()->get_Categories()->Add(wb->GetCell(0, u"C5", System::ObjectExt::Box<System::String>(u"Leaf5")));
	leaf->get_GroupingLevels()->SetGroupingItem(1, System::ObjectExt::Box<System::String>(u"Stem3"));
	leaf->get_GroupingLevels()->SetGroupingItem(2, System::ObjectExt::Box<System::String>(u"Branch2"));

	chart->get_ChartData()->get_Categories()->Add(wb->GetCell(0, u"C6", System::ObjectExt::Box<System::String>(u"Leaf6")));

	leaf = chart->get_ChartData()->get_Categories()->Add(wb->GetCell(0, u"C7", System::ObjectExt::Box<System::String>(u"Leaf7")));
	leaf->get_GroupingLevels()->SetGroupingItem(1, System::ObjectExt::Box<System::String>(u"Stem4"));

	chart->get_ChartData()->get_Categories()->Add(wb->GetCell(0, u"C8", System::ObjectExt::Box<System::String>(u"Leaf8")));

	System::SharedPtr<IChartSeries> series = chart->get_ChartData()->get_Series()->Add(Aspose::Slides::Charts::ChartType::Treemap);
	series->get_Labels()->get_DefaultDataLabelFormat()->set_ShowCategoryName(true);
	series->get_DataPoints()->AddDataPointForTreemapSeries(wb->GetCell(0, u"D1", System::ObjectExt::Box<int32_t>(4)));
	series->get_DataPoints()->AddDataPointForTreemapSeries(wb->GetCell(0, u"D2", System::ObjectExt::Box<int32_t>(5)));
	series->get_DataPoints()->AddDataPointForTreemapSeries(wb->GetCell(0, u"D3", System::ObjectExt::Box<int32_t>(3)));
	series->get_DataPoints()->AddDataPointForTreemapSeries(wb->GetCell(0, u"D4", System::ObjectExt::Box<int32_t>(6)));
	series->get_DataPoints()->AddDataPointForTreemapSeries(wb->GetCell(0, u"D5", System::ObjectExt::Box<int32_t>(9)));
	series->get_DataPoints()->AddDataPointForTreemapSeries(wb->GetCell(0, u"D6", System::ObjectExt::Box<int32_t>(9)));
	series->get_DataPoints()->AddDataPointForTreemapSeries(wb->GetCell(0, u"D7", System::ObjectExt::Box<int32_t>(4)));
	series->get_DataPoints()->AddDataPointForTreemapSeries(wb->GetCell(0, u"D8", System::ObjectExt::Box<int32_t>(3)));

	series->set_ParentLabelLayout(Aspose::Slides::Charts::ParentLabelLayoutType::Overlapping);

	// Menyimpan presentasi
	pres->Save(outPath, Aspose::Slides::Export::SaveFormat::Pptx);
Buat Diagram Saham
- Buat instance kelas Presentation.
- Dapatkan referensi slide melalui indeksnya.
- Tambahkan diagram dengan data default beserta tipe yang diinginkan (ChartType.OpenHighLowClose).
- Akses data diagram IChartDataWorkbook.
- Hapus seri dan kategori default.
- Tambahkan seri dan kategori baru.
- Tambahkan data diagram baru untuk seri diagram.
- Tentukan format HiLowLines.
- Tulis presentasi yang telah dimodifikasi ke file PPTX
Contoh kode C++ yang digunakan untuk membuat diagram saham:
#include <DOM/Chart/ChartType.h>
#include <DOM/Chart/IChartCategoryCollection.h>
#include <DOM/Chart/IChartData.h>
#include <DOM/Chart/IChartDataPointCollection.h>
#include <DOM/Chart/IChartDataWorkbook.h>
#include <DOM/Chart/IChartLinesFormat.h>
#include <DOM/Chart/IChartSeries.h>
#include <DOM/Chart/IChartSeriesCollection.h>
#include <DOM/Chart/IChartSeriesGroup.h>
#include <DOM/Chart/IChartSeriesGroupCollection.h>
#include <DOM/Chart/IFormat.h>
#include <DOM/Chart/IUpDownBarsManager.h>
#include <DOM/FillType.h>
#include <DOM/IChart.h>
#include <DOM/ILineFillFormat.h>
#include <DOM/ILineFormat.h>
#include <DOM/IShapeCollection.h>
#include <DOM/ISlide.h>
#include <DOM/ISlideCollection.h>
#include <DOM/Presentation.h>
#include <Export/SaveFormat.h>
#include <system/string.h>
using namespace Aspose::Slides;
using namespace Aspose::Slides::Charts;
using namespace Aspose::Slides::Export;
using namespace System;

	// Jalur ke direktori dokumen.
	const String outPath = u"../out/AddStockChart_out.pptx";

	// Membuat instance kelas Presentation yang mewakili file PPTX
	SharedPtr<Presentation> pres = MakeObject<Presentation>();

	// Mengakses slide pertama
	SharedPtr<ISlide> slide = pres->get_Slides()->idx_get(0);

	// Menambahkan diagram dengan data default
	SharedPtr<IChart> chart = slide->get_Shapes()->AddChart(Aspose::Slides::Charts::ChartType::OpenHighLowClose, 0, 0, 500, 500);


	// Mengatur indeks untuk lembar data diagram
	int defaultWorksheetIndex = 0;

	// Mendapatkan lembar kerja data diagram
	SharedPtr<IChartDataWorkbook> fact = chart->get_ChartData()->get_ChartDataWorkbook();


	// Menghapus seri dan kategori yang dihasilkan secara default
	chart->get_ChartData()->get_Series()->Clear();
	chart->get_ChartData()->get_Categories()->Clear();

	// Menambahkan kategori
	chart->get_ChartData()->get_Categories()->Add(fact->GetCell(defaultWorksheetIndex, 1, 0, ObjectExt::Box<System::String>(u"A")));
	chart->get_ChartData()->get_Categories()->Add(fact->GetCell(defaultWorksheetIndex, 2, 0, ObjectExt::Box<System::String>(u"B")));
	chart->get_ChartData()->get_Categories()->Add(fact->GetCell(defaultWorksheetIndex, 3, 0, ObjectExt::Box<System::String>(u"C")));

	// Menambahkan seri baru
	chart->get_ChartData()->get_Series()->Add(fact->GetCell(defaultWorksheetIndex, 0, 1, ObjectExt::Box<System::String>(u"Open")), chart->get_Type());
	chart->get_ChartData()->get_Series()->Add(fact->GetCell(defaultWorksheetIndex, 0, 2, ObjectExt::Box<System::String>(u"High")), chart->get_Type());
	chart->get_ChartData()->get_Series()->Add(fact->GetCell(defaultWorksheetIndex, 0, 3, ObjectExt::Box<System::String>(u"Low")), chart->get_Type());
	chart->get_ChartData()->get_Series()->Add(fact->GetCell(defaultWorksheetIndex, 0, 4, ObjectExt::Box<System::String>(u"Close")), chart->get_Type());


	// Mengambil seri diagram pertama
	SharedPtr<IChartSeries> series = chart->get_ChartData()->get_Series()->idx_get(0);
	// Mengisi data seri pertama
	series->get_DataPoints()->AddDataPointForStockSeries(fact->GetCell(defaultWorksheetIndex, 1, 1, ObjectExt::Box<double>(72)));
	series->get_DataPoints()->AddDataPointForStockSeries(fact->GetCell(defaultWorksheetIndex, 2, 1, ObjectExt::Box<double>(25)));
	series->get_DataPoints()->AddDataPointForStockSeries(fact->GetCell(defaultWorksheetIndex, 3, 1, ObjectExt::Box<double>(38)));


	series = chart->get_ChartData()->get_Series()->idx_get(1);
	// Mengisi data seri kedua
	series->get_DataPoints()->AddDataPointForStockSeries(fact->GetCell(defaultWorksheetIndex, 1, 2, ObjectExt::Box<double>(172)));
	series->get_DataPoints()->AddDataPointForStockSeries(fact->GetCell(defaultWorksheetIndex, 2, 2, ObjectExt::Box<double>(57)));
	series->get_DataPoints()->AddDataPointForStockSeries(fact->GetCell(defaultWorksheetIndex, 3, 2, ObjectExt::Box<double>(57)));

	series = chart->get_ChartData()->get_Series()->idx_get(2);
	// Mengisi data seri kedua
	series->get_DataPoints()->AddDataPointForStockSeries(fact->GetCell(defaultWorksheetIndex, 1, 3, ObjectExt::Box<double>(12)));
	series->get_DataPoints()->AddDataPointForStockSeries(fact->GetCell(defaultWorksheetIndex, 2, 3, ObjectExt::Box<double>(12)));
	series->get_DataPoints()->AddDataPointForStockSeries(fact->GetCell(defaultWorksheetIndex, 3, 3, ObjectExt::Box<double>(13)));


	series = chart->get_ChartData()->get_Series()->idx_get(3);
	// Mengisi data seri kedua
	series->get_DataPoints()->AddDataPointForStockSeries(fact->GetCell(defaultWorksheetIndex, 1, 4, ObjectExt::Box<double>(25)));
	series->get_DataPoints()->AddDataPointForStockSeries(fact->GetCell(defaultWorksheetIndex, 2, 4, ObjectExt::Box<double>(38)));
	series->get_DataPoints()->AddDataPointForStockSeries(fact->GetCell(defaultWorksheetIndex, 3, 4, ObjectExt::Box<double>(50)));

	// Mengatur grup seri
	chart->get_ChartData()->get_SeriesGroups()->idx_get(0)->get_UpDownBars()->set_HasUpDownBars (true);
	chart->get_ChartData()->get_SeriesGroups()->idx_get(0)->get_HiLowLinesFormat()->get_Line()->get_FillFormat()->set_FillType(FillType::Solid);


	for(int i=0;i<chart->get_ChartData()->get_Series()->get_Count();i++)
	{
		series = chart->get_ChartData()->get_Series()->idx_get(i);
		series->get_Format()->get_Line()->get_FillFormat()->set_FillType(FillType::NoFill);
	}

	// Menyimpan presentasi
	pres->Save(outPath, Aspose::Slides::Export::SaveFormat::Pptx);
Buat Diagram Box and Whisker
- Buat instance kelas Presentation.
- Dapatkan referensi slide melalui indeksnya.
- Tambahkan diagram dengan data default beserta tipe yang diinginkan (ChartType.BoxAndWhisker).
- Akses data diagram IChartDataWorkbook.
- Hapus seri dan kategori default.
- Tambahkan seri dan kategori baru.
- Tambahkan data diagram baru untuk seri diagram.
- Tulis presentasi yang telah dimodifikasi ke file PPTX
Kode C++ berikut menunjukkan cara membuat diagram box and whisker:
#include <DOM/Chart/ChartType.h>
#include <DOM/Chart/IChartCategoryCollection.h>
#include <DOM/Chart/IChartData.h>
#include <DOM/Chart/IChartDataPointCollection.h>
#include <DOM/Chart/IChartDataWorkbook.h>
#include <DOM/Chart/IChartSeries.h>
#include <DOM/Chart/IChartSeriesCollection.h>
#include <DOM/Chart/QuartileMethodType.h>
#include <DOM/IChart.h>
#include <DOM/IShapeCollection.h>
#include <DOM/ISlide.h>
#include <DOM/ISlideCollection.h>
#include <DOM/Presentation.h>
#include <Export/SaveFormat.h>
#include <system/string.h>
using namespace Aspose::Slides;
using namespace Aspose::Slides::Charts;
using namespace Aspose::Slides::Export;
using namespace System;

	// Jalur ke direktori dokumen.
	const String outPath = u"../out/BoxAndWhisker_out.pptx";

	// Membuat instance kelas Presentation yang mewakili file PPTX
	SharedPtr<Presentation> pres = MakeObject<Presentation>();

	// Mengakses slide pertama
	SharedPtr<ISlide> slide = pres->get_Slides()->idx_get(0);

	System::SharedPtr<IChart> chart = slide->get_Shapes()->AddChart(Aspose::Slides::Charts::ChartType::BoxAndWhisker, 50, 50, 500, 400);
	chart->get_ChartData()->get_Categories()->Clear();
	chart->get_ChartData()->get_Series()->Clear();

	System::SharedPtr<IChartDataWorkbook> wb = chart->get_ChartData()->get_ChartDataWorkbook();

	wb->Clear(0);

	chart->get_ChartData()->get_Categories()->Add(wb->GetCell(0, u"A1", System::ObjectExt::Box<System::String>(u"Category 1")));
	chart->get_ChartData()->get_Categories()->Add(wb->GetCell(0, u"A2", System::ObjectExt::Box<System::String>(u"Category 1")));
	chart->get_ChartData()->get_Categories()->Add(wb->GetCell(0, u"A3", System::ObjectExt::Box<System::String>(u"Category 1")));
	chart->get_ChartData()->get_Categories()->Add(wb->GetCell(0, u"A4", System::ObjectExt::Box<System::String>(u"Category 1")));
	chart->get_ChartData()->get_Categories()->Add(wb->GetCell(0, u"A5", System::ObjectExt::Box<System::String>(u"Category 1")));
	chart->get_ChartData()->get_Categories()->Add(wb->GetCell(0, u"A6", System::ObjectExt::Box<System::String>(u"Category 1")));

	System::SharedPtr<IChartSeries> series = chart->get_ChartData()->get_Series()->Add(Aspose::Slides::Charts::ChartType::BoxAndWhisker);

	series->set_QuartileMethod(Aspose::Slides::Charts::QuartileMethodType::Exclusive);
	series->set_ShowMeanLine(true);
	series->set_ShowMeanMarkers(true);
	series->set_ShowInnerPoints(true);
	series->set_ShowOutlierPoints(true);

	series->get_DataPoints()->AddDataPointForBoxAndWhiskerSeries(wb->GetCell(0, u"B1", System::ObjectExt::Box<int32_t>(15)));
	series->get_DataPoints()->AddDataPointForBoxAndWhiskerSeries(wb->GetCell(0, u"B2", System::ObjectExt::Box<int32_t>(41)));
	series->get_DataPoints()->AddDataPointForBoxAndWhiskerSeries(wb->GetCell(0, u"B3", System::ObjectExt::Box<int32_t>(16)));
	series->get_DataPoints()->AddDataPointForBoxAndWhiskerSeries(wb->GetCell(0, u"B4", System::ObjectExt::Box<int32_t>(10)));
	series->get_DataPoints()->AddDataPointForBoxAndWhiskerSeries(wb->GetCell(0, u"B5", System::ObjectExt::Box<int32_t>(23)));
	series->get_DataPoints()->AddDataPointForBoxAndWhiskerSeries(wb->GetCell(0, u"B6", System::ObjectExt::Box<int32_t>(16)));


	// Menyimpan presentasi
	pres->Save(outPath, Aspose::Slides::Export::SaveFormat::Pptx);
Buat Diagram Funnel
- Buat instance kelas Presentation.
- Dapatkan referensi slide melalui indeksnya.
- Tambahkan diagram dengan data default beserta tipe yang diinginkan (ChartType.Funnel).
- Tulis presentasi yang telah dimodifikasi ke file PPTX
Kode C++ berikut menunjukkan cara membuat diagram funnel:
#include <DOM/Chart/ChartType.h>
#include <DOM/Chart/IChartCategoryCollection.h>
#include <DOM/Chart/IChartData.h>
#include <DOM/Chart/IChartDataPointCollection.h>
#include <DOM/Chart/IChartDataWorkbook.h>
#include <DOM/Chart/IChartSeries.h>
#include <DOM/Chart/IChartSeriesCollection.h>
#include <DOM/IChart.h>
#include <DOM/IShapeCollection.h>
#include <DOM/ISlide.h>
#include <DOM/ISlideCollection.h>
#include <DOM/Presentation.h>
#include <Export/SaveFormat.h>
#include <system/string.h>
using namespace Aspose::Slides;
using namespace Aspose::Slides::Charts;
using namespace Aspose::Slides::Export;
using namespace System;

	// Jalur ke direktori dokumen.
	const String outPath = u"../out/FunnelChart_out.pptx";

	// Membuat instance kelas Presentation yang mewakili file PPTX
	SharedPtr<Presentation> pres = MakeObject<Presentation>();

	// Mengakses slide pertama
	SharedPtr<ISlide> slide = pres->get_Slides()->idx_get(0);

	System::SharedPtr<IChart> chart = slide->get_Shapes()->AddChart(Aspose::Slides::Charts::ChartType::Funnel, 50, 50, 500, 400);
	chart->get_ChartData()->get_Categories()->Clear();
	chart->get_ChartData()->get_Series()->Clear();

	System::SharedPtr<IChartDataWorkbook> wb = chart->get_ChartData()->get_ChartDataWorkbook();

	wb->Clear(0);

	chart->get_ChartData()->get_Categories()->Add(wb->GetCell(0, u"A1", System::ObjectExt::Box<System::String>(u"Category 1")));
	chart->get_ChartData()->get_Categories()->Add(wb->GetCell(0, u"A2", System::ObjectExt::Box<System::String>(u"Category 2")));
	chart->get_ChartData()->get_Categories()->Add(wb->GetCell(0, u"A3", System::ObjectExt::Box<System::String>(u"Category 3")));
	chart->get_ChartData()->get_Categories()->Add(wb->GetCell(0, u"A4", System::ObjectExt::Box<System::String>(u"Category 4")));
	chart->get_ChartData()->get_Categories()->Add(wb->GetCell(0, u"A5", System::ObjectExt::Box<System::String>(u"Category 5")));
	chart->get_ChartData()->get_Categories()->Add(wb->GetCell(0, u"A6", System::ObjectExt::Box<System::String>(u"Category 6")));

	System::SharedPtr<IChartSeries> series = chart->get_ChartData()->get_Series()->Add(Aspose::Slides::Charts::ChartType::Funnel);

	series->get_DataPoints()->AddDataPointForFunnelSeries(wb->GetCell(0, u"B1", System::ObjectExt::Box<int32_t>(50)));
	series->get_DataPoints()->AddDataPointForFunnelSeries(wb->GetCell(0, u"B2", System::ObjectExt::Box<int32_t>(100)));
	series->get_DataPoints()->AddDataPointForFunnelSeries(wb->GetCell(0, u"B3", System::ObjectExt::Box<int32_t>(200)));
	series->get_DataPoints()->AddDataPointForFunnelSeries(wb->GetCell(0, u"B4", System::ObjectExt::Box<int32_t>(300)));
	series->get_DataPoints()->AddDataPointForFunnelSeries(wb->GetCell(0, u"B5", System::ObjectExt::Box<int32_t>(400)));
	series->get_DataPoints()->AddDataPointForFunnelSeries(wb->GetCell(0, u"B6", System::ObjectExt::Box<int32_t>(500)));


	// Menyimpan presentasi
	pres->Save(outPath, Aspose::Slides::Export::SaveFormat::Pptx);
Buat Diagram Sunburst
- Buat instance kelas Presentation.
- Dapatkan referensi slide melalui indeksnya.
- Tambahkan diagram dengan data default beserta tipe yang diinginkan (dalam kasus ini,
ChartType.sunburst). - Tulis presentasi yang telah dimodifikasi ke file PPTX
Kode C++ berikut menunjukkan cara membuat diagram sunburst:
#include <DOM/Chart/ChartType.h>
#include <DOM/Chart/IChartCategory.h>
#include <DOM/Chart/IChartCategoryCollection.h>
#include <DOM/Chart/IChartCategoryLevelsManager.h>
#include <DOM/Chart/IChartData.h>
#include <DOM/Chart/IChartDataPointCollection.h>
#include <DOM/Chart/IChartDataWorkbook.h>
#include <DOM/Chart/IChartSeries.h>
#include <DOM/Chart/IChartSeriesCollection.h>
#include <DOM/Chart/IDataLabelCollection.h>
#include <DOM/Chart/IDataLabelFormat.h>
#include <DOM/IChart.h>
#include <DOM/IShapeCollection.h>
#include <DOM/ISlide.h>
#include <DOM/ISlideCollection.h>
#include <DOM/Presentation.h>
#include <Export/SaveFormat.h>
#include <system/string.h>
using namespace Aspose::Slides;
using namespace Aspose::Slides::Charts;
using namespace Aspose::Slides::Export;
using namespace System;

	// Jalur ke direktori dokumen.
	const String outPath = u"../out/SunburstChart_out.pptx";

	// Membuat instance kelas Presentation yang mewakili file PPTX
	SharedPtr<Presentation> pres = MakeObject<Presentation>();

	// Mengakses slide pertama
	SharedPtr<ISlide> slide = pres->get_Slides()->idx_get(0);

	System::SharedPtr<IChart> chart=slide->get_Shapes()->AddChart(Aspose::Slides::Charts::ChartType::Sunburst, 50, 50, 500, 400);
	chart->get_ChartData()->get_Categories()->Clear();
	chart->get_ChartData()->get_Series()->Clear();

	System::SharedPtr<IChartDataWorkbook> wb = chart->get_ChartData()->get_ChartDataWorkbook();

	wb->Clear(0);

	// Cabang 1
	System::SharedPtr<IChartCategory> leaf = chart->get_ChartData()->get_Categories()->Add(wb->GetCell(0, u"C1", System::ObjectExt::Box<System::String>(u"Leaf1")));
	leaf->get_GroupingLevels()->SetGroupingItem(1, System::ObjectExt::Box<System::String>(u"Stem1"));
	leaf->get_GroupingLevels()->SetGroupingItem(2, System::ObjectExt::Box<System::String>(u"Branch1"));

	chart->get_ChartData()->get_Categories()->Add(wb->GetCell(0, u"C2", System::ObjectExt::Box<System::String>(u"Leaf2")));

	leaf = chart->get_ChartData()->get_Categories()->Add(wb->GetCell(0, u"C3", System::ObjectExt::Box<System::String>(u"Leaf3")));
	leaf->get_GroupingLevels()->SetGroupingItem(1, System::ObjectExt::Box<System::String>(u"Stem2"));

	chart->get_ChartData()->get_Categories()->Add(wb->GetCell(0, u"C4", System::ObjectExt::Box<System::String>(u"Leaf4")));

	// Cabang 2
	leaf = chart->get_ChartData()->get_Categories()->Add(wb->GetCell(0, u"C5", System::ObjectExt::Box<System::String>(u"Leaf5")));
	leaf->get_GroupingLevels()->SetGroupingItem(1, System::ObjectExt::Box<System::String>(u"Stem3"));
	leaf->get_GroupingLevels()->SetGroupingItem(2, System::ObjectExt::Box<System::String>(u"Branch2"));

	chart->get_ChartData()->get_Categories()->Add(wb->GetCell(0, u"C6", System::ObjectExt::Box<System::String>(u"Leaf6")));

	leaf = chart->get_ChartData()->get_Categories()->Add(wb->GetCell(0, u"C7", System::ObjectExt::Box<System::String>(u"Leaf7")));
	leaf->get_GroupingLevels()->SetGroupingItem(1, System::ObjectExt::Box<System::String>(u"Stem4"));

	chart->get_ChartData()->get_Categories()->Add(wb->GetCell(0, u"C8", System::ObjectExt::Box<System::String>(u"Leaf8")));

	System::SharedPtr<IChartSeries> series = chart->get_ChartData()->get_Series()->Add(Aspose::Slides::Charts::ChartType::Sunburst);
	series->get_Labels()->get_DefaultDataLabelFormat()->set_ShowCategoryName(true);
	series->get_DataPoints()->AddDataPointForSunburstSeries(wb->GetCell(0, u"D1", System::ObjectExt::Box<int32_t>(4)));
	series->get_DataPoints()->AddDataPointForSunburstSeries(wb->GetCell(0, u"D2", System::ObjectExt::Box<int32_t>(5)));
	series->get_DataPoints()->AddDataPointForSunburstSeries(wb->GetCell(0, u"D3", System::ObjectExt::Box<int32_t>(3)));
	series->get_DataPoints()->AddDataPointForSunburstSeries(wb->GetCell(0, u"D4", System::ObjectExt::Box<int32_t>(6)));
	series->get_DataPoints()->AddDataPointForSunburstSeries(wb->GetCell(0, u"D5", System::ObjectExt::Box<int32_t>(9)));
	series->get_DataPoints()->AddDataPointForSunburstSeries(wb->GetCell(0, u"D6", System::ObjectExt::Box<int32_t>(9)));
	series->get_DataPoints()->AddDataPointForSunburstSeries(wb->GetCell(0, u"D7", System::ObjectExt::Box<int32_t>(4)));
	series->get_DataPoints()->AddDataPointForSunburstSeries(wb->GetCell(0, u"D8", System::ObjectExt::Box<int32_t>(3)));

	// Menulis file presentasi ke disk
	pres->Save(outPath, Aspose::Slides::Export::SaveFormat::Pptx);
Buat Diagram Histogram
- Buat instance kelas Presentation.
- Dapatkan referensi slide melalui indeksnya.
- Tambahkan diagram dengan beberapa data dan tentukan tipe diagram yang Anda inginkan (
ChartType.Histogramdalam kasus ini). - Akses data diagram
IChartDataWorkbook. - Hapus seri dan kategori default.
- Tambahkan seri dan kategori baru.
- Tulis presentasi yang telah dimodifikasi ke file PPTX.
Kode C++ berikut menunjukkan cara membuat diagram histogram:
#include <DOM/Chart/AxisAggregationType.h>
#include <DOM/Chart/ChartType.h>
#include <DOM/Chart/IAxesManager.h>
#include <DOM/Chart/IAxis.h>
#include <DOM/Chart/IChartCategoryCollection.h>
#include <DOM/Chart/IChartData.h>
#include <DOM/Chart/IChartDataPointCollection.h>
#include <DOM/Chart/IChartDataWorkbook.h>
#include <DOM/Chart/IChartSeries.h>
#include <DOM/Chart/IChartSeriesCollection.h>
#include <DOM/IChart.h>
#include <DOM/IShapeCollection.h>
#include <DOM/ISlide.h>
#include <DOM/ISlideCollection.h>
#include <DOM/Presentation.h>
#include <Export/SaveFormat.h>
#include <system/string.h>
using namespace Aspose::Slides;
using namespace Aspose::Slides::Charts;
using namespace Aspose::Slides::Export;
using namespace System;

	// Jalur ke direktori dokumen.
	const String outPath = u"../out/HistogramChart_out.pptx";

	// Membuat instance kelas Presentation yang mewakili file PPTX
	SharedPtr<Presentation> pres = MakeObject<Presentation>();

	// Mengakses slide pertama
	SharedPtr<ISlide> slide = pres->get_Slides()->idx_get(0);

	System::SharedPtr<IChart> chart = slide->get_Shapes()->AddChart(Aspose::Slides::Charts::ChartType::Histogram, 50, 50, 500, 400);
	chart->get_ChartData()->get_Categories()->Clear();
	chart->get_ChartData()->get_Series()->Clear();

	System::SharedPtr<IChartDataWorkbook> wb = chart->get_ChartData()->get_ChartDataWorkbook();

	wb->Clear(0);

	System::SharedPtr<IChartSeries> series = chart->get_ChartData()->get_Series()->Add(Aspose::Slides::Charts::ChartType::Histogram);
	series->get_DataPoints()->AddDataPointForHistogramSeries(wb->GetCell(0, u"A1", System::ObjectExt::Box<int32_t>(15)));
	series->get_DataPoints()->AddDataPointForHistogramSeries(wb->GetCell(0, u"A2", System::ObjectExt::Box<int32_t>(-41)));
	series->get_DataPoints()->AddDataPointForHistogramSeries(wb->GetCell(0, u"A3", System::ObjectExt::Box<int32_t>(16)));
	series->get_DataPoints()->AddDataPointForHistogramSeries(wb->GetCell(0, u"A4", System::ObjectExt::Box<int32_t>(10)));
	series->get_DataPoints()->AddDataPointForHistogramSeries(wb->GetCell(0, u"A5", System::ObjectExt::Box<int32_t>(-23)));
	series->get_DataPoints()->AddDataPointForHistogramSeries(wb->GetCell(0, u"A6", System::ObjectExt::Box<int32_t>(16)));

	chart->get_Axes()->get_HorizontalAxis()->set_AggregationType(Aspose::Slides::Charts::AxisAggregationType::Automatic);

	// Menyimpan presentasi
	pres->Save(outPath, Aspose::Slides::Export::SaveFormat::Pptx);
Buat Diagram Radar
- Buat instance kelas Presentation.
- Dapatkan referensi slide melalui indeksnya.
- Tambahkan diagram dengan beberapa data dan tentukan tipe diagram yang Anda inginkan (
ChartType.Radardalam kasus ini). - Tulis presentasi yang telah dimodifikasi ke file PPTX
Kode C++ berikut menunjukkan cara membuat diagram radar:
#include <DOM/Chart/ChartType.h>
#include <DOM/IShapeCollection.h>
#include <DOM/ISlide.h>
#include <DOM/ISlideCollection.h>
#include <DOM/Presentation.h>
#include <Export/SaveFormat.h>
using namespace Aspose::Slides;

System::SharedPtr<Presentation> presentation = System::MakeObject<Presentation>();

presentation->get_Slides()->idx_get(0)->get_Shapes()->AddChart(Aspose::Slides::Charts::ChartType::Radar, 20.0f, 20.0f, 400.0f, 300.0f);
presentation->Save(u"Radar-chart.pptx", Aspose::Slides::Export::SaveFormat::Pptx);
Buat Diagram Multi‑Kategori
- Buat instance kelas Presentation.
- Dapatkan referensi slide melalui indeksnya.
- Tambahkan diagram dengan data default beserta tipe yang diinginkan (ChartType.ClusteredColumn).
- Akses data diagram IChartDataWorkbook.
- Hapus seri dan kategori default.
- Tambahkan seri dan kategori baru.
- Tambahkan data diagram baru untuk seri diagram.
- Tulis presentasi yang telah dimodifikasi ke file PPTX.
Kode C++ berikut menunjukkan cara membuat diagram multi‑kategori:
#include <DOM/Chart/ChartType.h>
#include <DOM/IShapeCollection.h>
#include <DOM/ISlide.h>
#include <DOM/ISlideCollection.h>
#include <DOM/Presentation.h>
#include <Export/SaveFormat.h>
using namespace Aspose::Slides;

System::SharedPtr<Presentation> presentation = System::MakeObject<Presentation>();

presentation->get_Slides()->idx_get(0)->get_Shapes()->AddChart(Aspose::Slides::Charts::ChartType::Radar, 20.0f, 20.0f, 400.0f, 300.0f);
presentation->Save(u"Radar-chart.pptx", Aspose::Slides::Export::SaveFormat::Pptx);
Buat Diagram Peta
Diagram peta adalah visualisasi area yang berisi data. Diagram peta paling cocok untuk membandingkan data atau nilai di seluruh wilayah geografis.
Kode C++ berikut menunjukkan cara membuat diagram peta:
#include <DOM/Chart/ChartType.h>
#include <DOM/IShapeCollection.h>
#include <DOM/ISlide.h>
#include <DOM/ISlideCollection.h>
#include <DOM/Presentation.h>
#include <Export/SaveFormat.h>
using namespace Aspose::Slides;
using namespace Aspose::Slides::Charts;
using namespace Aspose::Slides::Export;

auto pres = System::MakeObject<Presentation>();
auto slide = pres->get_Slides()->idx_get(0);
auto chart = slide->get_Shapes()->AddChart(ChartType::Map, 50.0f, 50.0f, 500.0f, 400.0f);
pres->Save(u"mapChart.pptx", SaveFormat::Pptx);
Buat Diagram Kombinasi
Diagram kombinasi (atau combo chart) menggabungkan dua atau lebih tipe diagram dalam satu grafik. Diagram ini memungkinkan Anda menyoroti, membandingkan, atau memeriksa perbedaan antara dua atau lebih set data, membantu mengidentifikasi hubungan di antara mereka.
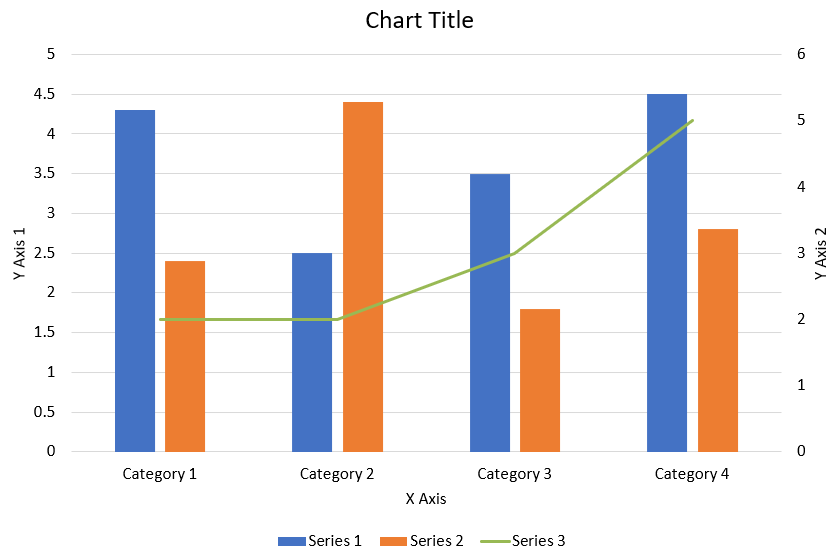
Kode C++ berikut menunjukkan cara membuat diagram kombinasi yang ditampilkan di atas dalam presentasi PowerPoint:
#include <DOM/Chart/AxisPositionType.h>
#include <DOM/Chart/ChartType.h>
#include <DOM/Chart/CrossesType.h>
#include <DOM/Chart/IAxesManager.h>
#include <DOM/Chart/IAxis.h>
#include <DOM/Chart/IAxisFormat.h>
#include <DOM/Chart/IChartCategoryCollection.h>
#include <DOM/Chart/IChartData.h>
#include <DOM/Chart/IChartDataPointCollection.h>
#include <DOM/Chart/IChartDataWorkbook.h>
#include <DOM/Chart/IChartLinesFormat.h>
#include <DOM/Chart/IChartPortionFormat.h>
#include <DOM/Chart/IChartSeries.h>
#include <DOM/Chart/IChartSeriesCollection.h>
#include <DOM/Chart/IChartSeriesGroup.h>
#include <DOM/Chart/IChartTextFormat.h>
#include <DOM/Chart/IChartTitle.h>
#include <DOM/Chart/ILegend.h>
#include <DOM/Chart/LegendPositionType.h>
#include <DOM/FillType.h>
#include <DOM/IChart.h>
#include <DOM/IColorFormat.h>
#include <DOM/ILineFillFormat.h>
#include <DOM/ILineFormat.h>
#include <DOM/IParagraph.h>
#include <DOM/IParagraphFormat.h>
#include <DOM/IPortionFormat.h>
#include <DOM/IShapeCollection.h>
#include <DOM/ISlide.h>
#include <DOM/ITextFrame.h>
#include <DOM/NullableBool.h>
#include <DOM/Presentation.h>
#include <Export/SaveFormat.h>
#include <drawing/color.h>
#include <system/string.h>
using namespace Aspose::Slides;
using namespace Aspose::Slides::Charts;
using namespace Aspose::Slides::Export;
using namespace System;
using namespace System::Drawing;

static SharedPtr<IChart> CreateChartWithFirstSeries(SharedPtr<ISlide> slide)
{
    auto chart = slide->get_Shapes()->AddChart(ChartType::ClusteredColumn, 50, 50, 600, 400);

    // Atur judul diagram.
    chart->set_HasTitle(true);
    chart->get_ChartTitle()->AddTextFrameForOverriding(u"Chart Title");
    chart->get_ChartTitle()->set_Overlay(false);
    auto titleParagraph = chart->get_ChartTitle()->get_TextFrameForOverriding()->get_Paragraph(0);
    auto titleFormat = titleParagraph->get_ParagraphFormat()->get_DefaultPortionFormat();
    titleFormat->set_FontBold(NullableBool::False);
    titleFormat->set_FontHeight(18.0);

    // Atur legenda diagram.
    chart->get_Legend()->set_Position(LegendPositionType::Bottom);
    chart->get_Legend()->get_TextFormat()->get_PortionFormat()->set_FontHeight(12.0);

    // Hapus seri dan kategori yang dihasilkan secara default.
    chart->get_ChartData()->get_Series()->Clear();
    chart->get_ChartData()->get_Categories()->Clear();

    const int worksheetIndex = 0;
    auto workbook = chart->get_ChartData()->get_ChartDataWorkbook();

    // Tambah kategori baru.
    chart->get_ChartData()->get_Categories()->Add(workbook->GetCell(worksheetIndex, 1, 0, ObjectExt::Box<String>(u"Category 1")));
    chart->get_ChartData()->get_Categories()->Add(workbook->GetCell(worksheetIndex, 2, 0, ObjectExt::Box<String>(u"Category 2")));
    chart->get_ChartData()->get_Categories()->Add(workbook->GetCell(worksheetIndex, 3, 0, ObjectExt::Box<String>(u"Category 3")));
    chart->get_ChartData()->get_Categories()->Add(workbook->GetCell(worksheetIndex, 4, 0, ObjectExt::Box<String>(u"Category 4")));

    // Tambah seri pertama.
    auto seriesNameCell = workbook->GetCell(worksheetIndex, 0, 1, ObjectExt::Box<String>(u"Series 1"));
    auto series = chart->get_ChartData()->get_Series()->Add(seriesNameCell, chart->get_Type());

    series->get_ParentSeriesGroup()->set_Overlap(-25);
    series->get_ParentSeriesGroup()->set_GapWidth(220);

    series->get_DataPoints()->AddDataPointForBarSeries(workbook->GetCell(worksheetIndex, 1, 1, ObjectExt::Box<double>(4.3)));
    series->get_DataPoints()->AddDataPointForBarSeries(workbook->GetCell(worksheetIndex, 2, 1, ObjectExt::Box<double>(2.5)));
    series->get_DataPoints()->AddDataPointForBarSeries(workbook->GetCell(worksheetIndex, 3, 1, ObjectExt::Box<double>(3.5)));
    series->get_DataPoints()->AddDataPointForBarSeries(workbook->GetCell(worksheetIndex, 4, 1, ObjectExt::Box<double>(4.5)));

    return chart;
}

static void AddSecondSeriesToChart(SharedPtr<IChart> chart)
{
    auto workbook = chart->get_ChartData()->get_ChartDataWorkbook();
    const int worksheetIndex = 0;

    auto seriesNameCell = workbook->GetCell(worksheetIndex, 0, 2, ObjectExt::Box<String>(u"Series 2"));
    auto series = chart->get_ChartData()->get_Series()->Add(seriesNameCell, ChartType::ClusteredColumn);

    series->get_ParentSeriesGroup()->set_Overlap(-25);
    series->get_ParentSeriesGroup()->set_GapWidth(220);

    series->get_DataPoints()->AddDataPointForBarSeries(workbook->GetCell(worksheetIndex, 1, 2, ObjectExt::Box<double>(2.4)));
    series->get_DataPoints()->AddDataPointForBarSeries(workbook->GetCell(worksheetIndex, 2, 2, ObjectExt::Box<double>(4.4)));
    series->get_DataPoints()->AddDataPointForBarSeries(workbook->GetCell(worksheetIndex, 3, 2, ObjectExt::Box<double>(1.8)));
    series->get_DataPoints()->AddDataPointForBarSeries(workbook->GetCell(worksheetIndex, 4, 2, ObjectExt::Box<double>(2.8)));
}

static void AddThirdSeriesToChart(SharedPtr<IChart> chart)
{
    auto workbook = chart->get_ChartData()->get_ChartDataWorkbook();
    const int worksheetIndex = 0;

    auto seriesNameCell = workbook->GetCell(worksheetIndex, 0, 3, ObjectExt::Box<String>(u"Series 3"));
    auto series = chart->get_ChartData()->get_Series()->Add(seriesNameCell, ChartType::Line);

    series->get_DataPoints()->AddDataPointForLineSeries(workbook->GetCell(worksheetIndex, 1, 3, ObjectExt::Box<double>(2.0)));
    series->get_DataPoints()->AddDataPointForLineSeries(workbook->GetCell(worksheetIndex, 2, 3, ObjectExt::Box<double>(2.0)));
    series->get_DataPoints()->AddDataPointForLineSeries(workbook->GetCell(worksheetIndex, 3, 3, ObjectExt::Box<double>(3.0)));
    series->get_DataPoints()->AddDataPointForLineSeries(workbook->GetCell(worksheetIndex, 4, 3, ObjectExt::Box<double>(5.0)));

    series->set_PlotOnSecondAxis(true);
}

static void SetAxisTitle(SharedPtr<IAxis> axis, String axisTitle)
{
    axis->set_HasTitle(true);
    axis->get_Title()->set_Overlay(false);
    auto titleParagraph = axis->get_Title()->AddTextFrameForOverriding(axisTitle)->get_Paragraph(0);
    auto titleFormat = titleParagraph->get_ParagraphFormat()->get_DefaultPortionFormat();
    titleFormat->set_FontBold(NullableBool::False);
    titleFormat->set_FontHeight(12.0);
}

static void SetPrimaryAxesFormat(SharedPtr<IChart> chart)
{
    // Atur sumbu horizontal.
    auto horizontalAxis = chart->get_Axes()->get_HorizontalAxis();
    horizontalAxis->get_TextFormat()->get_PortionFormat()->set_FontHeight(12.0);
    horizontalAxis->get_Format()->get_Line()->get_FillFormat()->set_FillType(FillType::NoFill);

    SetAxisTitle(horizontalAxis, u"X Axis");

    // Atur sumbu vertikal.
    auto verticalAxis = chart->get_Axes()->get_VerticalAxis();
    verticalAxis->get_TextFormat()->get_PortionFormat()->set_FontHeight(12.0);
    verticalAxis->get_Format()->get_Line()->get_FillFormat()->set_FillType(FillType::NoFill);

    SetAxisTitle(verticalAxis, u"Y Axis 1");

    // Atur warna garis kisi utama vertikal.
    auto majorGridLinesFormat = verticalAxis->get_MajorGridLinesFormat()->get_Line()->get_FillFormat();
    majorGridLinesFormat->set_FillType(FillType::Solid);
    majorGridLinesFormat->get_SolidFillColor()->set_Color(Color::FromArgb(217, 217, 217));
}

static void SetSecondaryAxesFormat(SharedPtr<IChart> chart)
{
    // Atur sumbu horizontal sekunder.
    auto secondaryHorizontalAxis = chart->get_Axes()->get_SecondaryHorizontalAxis();
    secondaryHorizontalAxis->set_Position(AxisPositionType::Bottom);
    secondaryHorizontalAxis->set_CrossType(CrossesType::Maximum);
    secondaryHorizontalAxis->set_IsVisible(false);
    secondaryHorizontalAxis->get_MajorGridLinesFormat()->get_Line()->get_FillFormat()->set_FillType(FillType::NoFill);
    secondaryHorizontalAxis->get_MinorGridLinesFormat()->get_Line()->get_FillFormat()->set_FillType(FillType::NoFill);

    // Atur sumbu vertikal sekunder.
    auto secondaryVerticalAxis = chart->get_Axes()->get_SecondaryVerticalAxis();
    secondaryVerticalAxis->set_Position(AxisPositionType::Right);
    secondaryVerticalAxis->get_TextFormat()->get_PortionFormat()->set_FontHeight(12.0);
    secondaryVerticalAxis->get_Format()->get_Line()->get_FillFormat()->set_FillType(FillType::NoFill);
    secondaryVerticalAxis->get_MajorGridLinesFormat()->get_Line()->get_FillFormat()->set_FillType(FillType::NoFill);
    secondaryVerticalAxis->get_MinorGridLinesFormat()->get_Line()->get_FillFormat()->set_FillType(FillType::NoFill);

    SetAxisTitle(secondaryVerticalAxis, u"Y Axis 2");
}

static void CreateComboChart()
{
    auto presentation = MakeObject<Presentation>();
    auto slide = presentation->get_Slide(0);

    auto chart = CreateChartWithFirstSeries(slide);

    AddSecondSeriesToChart(chart);
    AddThirdSeriesToChart(chart);

    SetPrimaryAxesFormat(chart);
    SetSecondaryAxesFormat(chart);

    presentation->Save(u"combo-chart.pptx", SaveFormat::Pptx);
    presentation->Dispose();
}
Perbarui Diagram
- Instansiasi kelas Presentation yang mewakili presentasi yang berisi diagram.
- Dapatkan referensi slide melalui indeksnya.
- Telusuri semua shape untuk menemukan diagram yang diinginkan.
- Akses lembar kerja data diagram.
- Modifikasi data seri diagram dengan mengubah nilai seri.
- Tambahkan seri baru dan isi data di dalamnya.
- Tulis presentasi yang telah dimodifikasi sebagai file PPTX.
Kode C++ berikut menunjukkan cara memperbarui diagram:
#include <DOM/Chart/ChartType.h>
#include <DOM/Chart/IChartData.h>
#include <DOM/Chart/IChartDataPoint.h>
#include <DOM/Chart/IChartDataPointCollection.h>
#include <DOM/Chart/IChartDataWorkbook.h>
#include <DOM/Chart/IChartSeries.h>
#include <DOM/Chart/IChartSeriesCollection.h>
#include <DOM/Chart/IDoubleChartValue.h>
#include <DOM/IChart.h>
#include <DOM/IShapeCollection.h>
#include <DOM/ISlide.h>
#include <DOM/ISlideCollection.h>
#include <DOM/Presentation.h>
#include <Export/SaveFormat.h>
using namespace Aspose::Slides;
using namespace Aspose::Slides::Charts;

// Membuat instance kelas Presentation yang mewakili file PPTX
System::SharedPtr<Presentation> pres = System::MakeObject<Presentation>(u"ExistingChart.pptx");

// Mengakses slide pertama
System::SharedPtr<ISlide> sld = pres->get_Slides()->idx_get(0);

// Menambahkan diagram dengan data default
System::SharedPtr<IChart> chart = System::ExplicitCast<Aspose::Slides::Charts::IChart>(sld->get_Shapes()->idx_get(0));

// Mengatur indeks untuk lembar data diagram
int32_t defaultWorksheetIndex = 0;

// Mendapatkan lembar kerja data diagram
System::SharedPtr<IChartDataWorkbook> fact = chart->get_ChartData()->get_ChartDataWorkbook();


// Mengubah Nama Kategori diagram
fact->GetCell(defaultWorksheetIndex, 1, 0, System::ObjectExt::Box<System::String>(u"Modified Category 1"));
fact->GetCell(defaultWorksheetIndex, 2, 0, System::ObjectExt::Box<System::String>(u"Modified Category 2"));

// Mengambil seri diagram pertama
System::SharedPtr<IChartSeries> series = chart->get_ChartData()->get_Series()->idx_get(0);

// Memperbarui data seri
fact->GetCell(defaultWorksheetIndex, 0, 1, System::ObjectExt::Box<System::String>(u"New_Series1"));
// Memodifikasi nama seri
series->get_DataPoints()->idx_get(0)->get_Value()->set_Data(System::ObjectExt::Box<int32_t>(90));
series->get_DataPoints()->idx_get(1)->get_Value()->set_Data(System::ObjectExt::Box<int32_t>(123));
series->get_DataPoints()->idx_get(2)->get_Value()->set_Data(System::ObjectExt::Box<int32_t>(44));

// Mengambil seri diagram kedua
series = chart->get_ChartData()->get_Series()->idx_get(1);

// Sekarang memperbarui data seri
fact->GetCell(defaultWorksheetIndex, 0, 2, System::ObjectExt::Box<System::String>(u"New_Series2"));
// Memodifikasi nama seri
series->get_DataPoints()->idx_get(0)->get_Value()->set_Data(System::ObjectExt::Box<int32_t>(23));
series->get_DataPoints()->idx_get(1)->get_Value()->set_Data(System::ObjectExt::Box<int32_t>(67));
series->get_DataPoints()->idx_get(2)->get_Value()->set_Data(System::ObjectExt::Box<int32_t>(99));


// Sekarang, menambahkan seri baru
chart->get_ChartData()->get_Series()->Add(fact->GetCell(defaultWorksheetIndex, 0, 3, System::ObjectExt::Box<System::String>(u"Series 3")), chart->get_Type());

// Mengambil seri diagram ketiga
series = chart->get_ChartData()->get_Series()->idx_get(2);

// Sekarang mengisi data seri
series->get_DataPoints()->AddDataPointForBarSeries(fact->GetCell(defaultWorksheetIndex, 1, 3, System::ObjectExt::Box<int32_t>(20)));
series->get_DataPoints()->AddDataPointForBarSeries(fact->GetCell(defaultWorksheetIndex, 2, 3, System::ObjectExt::Box<int32_t>(50)));
series->get_DataPoints()->AddDataPointForBarSeries(fact->GetCell(defaultWorksheetIndex, 3, 3, System::ObjectExt::Box<int32_t>(30)));

chart->set_Type(Aspose::Slides::Charts::ChartType::ClusteredCylinder);

// Simpan presentasi dengan diagram
pres->Save(u"AsposeChartModified_out.pptx", Aspose::Slides::Export::SaveFormat::Pptx);
Atur Rentang Data untuk Diagram
- Buka instance kelas Presentation yang berisi diagram.
- Dapatkan referensi slide melalui indeksnya.
- Telusuri semua shape untuk menemukan diagram yang diinginkan.
- Akses data diagram dan atur rentangnya.
- Simpan presentasi yang telah dimodifikasi sebagai file PPTX.
Kode C++ berikut menunjukkan cara mengatur rentang data untuk diagram:
#include <DOM/Chart/IChartData.h>
#include <DOM/IChart.h>
#include <DOM/IShapeCollection.h>
#include <DOM/ISlide.h>
#include <DOM/ISlideCollection.h>
#include <DOM/Presentation.h>
#include <Export/SaveFormat.h>
#include <system/string.h>
using namespace Aspose::Slides;
using namespace Aspose::Slides::Charts;
using namespace Aspose::Slides::Export;
using namespace System;

// Jalur ke direktori dokumen.
String dataDir = u"../documents/";

// Membuat instance kelas Presentation yang mewakili file PPTX
auto presentation = System::MakeObject<Presentation>(dataDir + u"ExistingChart.pptx");

// Mengakses slide pertama dan menambahkan diagram dengan data default
auto slide = presentation->get_Slides()->idx_get(0);
auto chart = System::ExplicitCast<IChart>(slide->get_Shapes()->idx_get(0));
chart->get_ChartData()->SetRange(u"Sheet1!A1:B4");
presentation->Save(dataDir + u"SetDataRange_out.pptx", SaveFormat::Pptx);
Gunakan Penanda Default dalam Diagram
Ketika Anda menggunakan penanda default dalam diagram, setiap seri diagram akan mendapatkan simbol penanda default yang berbeda secara otomatis.
Kode C++ berikut menunjukkan cara mengatur penanda seri diagram secara otomatis:
#include <DOM/Chart/ChartType.h>
#include <DOM/Chart/IChartCategoryCollection.h>
#include <DOM/Chart/IChartData.h>
#include <DOM/Chart/IChartDataPointCollection.h>
#include <DOM/Chart/IChartDataWorkbook.h>
#include <DOM/Chart/IChartSeries.h>
#include <DOM/Chart/IChartSeriesCollection.h>
#include <DOM/Chart/ILegend.h>
#include <DOM/IChart.h>
#include <DOM/IShapeCollection.h>
#include <DOM/ISlide.h>
#include <DOM/ISlideCollection.h>
#include <DOM/Presentation.h>
#include <Export/SaveFormat.h>
#include <system/object_ext.h>
#include <system/string.h>
using namespace Aspose::Slides;
using namespace Aspose::Slides::Charts;
using namespace Aspose::Slides::Export;
using namespace System;

// Jalur ke direktori dokumen.
String dataDir = u"../documents/";

auto pres = System::MakeObject<Presentation>();

auto slide = pres->get_Slides()->idx_get(0);
auto chart = slide->get_Shapes()->AddChart(ChartType::LineWithMarkers, 10.0f, 10.0f, 400.0f, 400.0f);

chart->get_ChartData()->get_Series()->Clear();
chart->get_ChartData()->get_Categories()->Clear();

auto wb = chart->get_ChartData()->get_ChartDataWorkbook();
chart->get_ChartData()->get_Series()->Add(wb->GetCell(0, 0, 1, ObjectExt::Box<String>(u"Series 1")), chart->get_Type());
auto series = chart->get_ChartData()->get_Series()->idx_get(0);

chart->get_ChartData()->get_Categories()->Add(wb->GetCell(0, 1, 0, ObjectExt::Box<String>(u"C1")));
series->get_DataPoints()->AddDataPointForLineSeries(wb->GetCell(0, 1, 1, ObjectExt::Box<int32_t>(24)));
chart->get_ChartData()->get_Categories()->Add(wb->GetCell(0, 2, 0, ObjectExt::Box<String>(u"C2")));
series->get_DataPoints()->AddDataPointForLineSeries(wb->GetCell(0, 2, 1, ObjectExt::Box<int32_t>(23)));
chart->get_ChartData()->get_Categories()->Add(wb->GetCell(0, 3, 0, ObjectExt::Box<String>(u"C3")));
series->get_DataPoints()->AddDataPointForLineSeries(wb->GetCell(0, 3, 1, ObjectExt::Box<int32_t>(-10)));
chart->get_ChartData()->get_Categories()->Add(wb->GetCell(0, 4, 0, ObjectExt::Box<String>(u"C4")));
series->get_DataPoints()->AddDataPointForLineSeries(wb->GetCell(0, 4, 1, nullptr));

chart->get_ChartData()->get_Series()->Add(wb->GetCell(0, 0, 2, ObjectExt::Box<String>(u"Series 2")), chart->get_Type());

// Mengambil seri diagram kedua
auto series2 = chart->get_ChartData()->get_Series()->idx_get(1);

// Mengisi data seri
series2->get_DataPoints()->AddDataPointForLineSeries(wb->GetCell(0, 1, 2, ObjectExt::Box<int32_t>(30)));
series2->get_DataPoints()->AddDataPointForLineSeries(wb->GetCell(0, 2, 2, ObjectExt::Box<int32_t>(10)));
series2->get_DataPoints()->AddDataPointForLineSeries(wb->GetCell(0, 3, 2, ObjectExt::Box<int32_t>(60)));
series2->get_DataPoints()->AddDataPointForLineSeries(wb->GetCell(0, 4, 2, ObjectExt::Box<int32_t>(40)));

chart->set_HasLegend(true);
chart->get_Legend()->set_Overlay(false);

pres->Save(dataDir + u"DefaultMarkersInChart.pptx", SaveFormat::Pptx);
FAQ
Jenis diagram apa yang didukung oleh Aspose.Slides?
Aspose.Slides mendukung berbagai jenis diagram, termasuk bar, line, pie, area, scatter, histogram, radar, dan banyak lagi. Fleksibilitas ini memungkinkan Anda memilih jenis diagram yang paling tepat untuk kebutuhan visualisasi data Anda.
Bagaimana cara menambahkan diagram baru ke slide?
Untuk menambahkan diagram, pertama buat instance kelas Presentation, ambil slide yang diinginkan menggunakan indeksnya, lalu panggil metode untuk menambahkan diagram, dengan menentukan tipe diagram dan data awal. Proses ini mengintegrasikan diagram langsung ke dalam presentasi Anda.
Bagaimana cara memperbarui data yang ditampilkan dalam diagram?
Anda dapat memperbarui data diagram dengan mengakses workbook datanya (IChartDataWorkbook), menghapus semua seri dan kategori default, lalu menambahkan data khusus Anda. Hal ini memungkinkan Anda memperbarui diagram secara programatik agar mencerminkan data terbaru.
Apakah memungkinkan untuk menyesuaikan tampilan diagram?
Ya, Aspose.Slides menyediakan opsi penyesuaian yang luas. Anda dapat mengubah warna, font, label, legenda, dan elemen pemformatan lainnya untuk menyesuaikan tampilan diagram sesuai dengan kebutuhan desain spesifik Anda.