
สร้างหรืออัปเดตแผนภูมิการนำเสนอ PowerPoint ด้วย C++
ภาพรวม
บทความนี้เป็นคู่มือฉบับสมบูรณ์เกี่ยวกับวิธีการสร้างและปรับแต่งแผนภูมิด้วย Aspose.Slides คุณจะได้เรียนรู้วิธีการเพิ่มแผนภูมิลงในสไลด์แบบโปรแกรมมิ่ง, เติมข้อมูลให้กับแผนภูมิ, และใช้ตัวเลือกการจัดรูปแบบต่าง ๆ เพื่อตรงกับความต้องการออกแบบของคุณ ตลอดบทความ มีตัวอย่างโค้ดอย่างละเอียดแสดงแต่ละขั้นตอน ตั้งแต่การเริ่มต้น Presentation และอ็อบเจ็กต์แผนภูมิ ไปจนถึงการตั้งค่าซีรีส์, แกน, และคำอธิบาย ด้วยการทำตามคู่มือนี้ คุณจะเข้าใจอย่างชัดเจนว่าจะแทรกการสร้างแผนภูมิแบบไดนามิกเข้าไปในแอปพลิเคชันของคุณอย่างไร ทำให้กระบวนการสร้างงานนำเสนอที่ขับเคลื่อนด้วยข้อมูลเป็นเรื่องง่ายขึ้น
สร้างแผนภูมิ
แผนภูมิช่วยให้ผู้ใช้มองเห็นข้อมูลได้อย่างรวดเร็วและได้ข้อสรุปที่อาจไม่ชัดเจนจากตารางหรือสเปรดชีต
ทำไมต้องสร้างแผนภูมิ?
- รวบรวม, ยุบหรือสรุปข้อมูลจำนวนมากบนสไลด์เดียวในงานนำเสนอ
- เปิดเผยรูปแบบและแนวโน้มในข้อมูล
- สรุปทิศทางและความเคลื่อนไหวของข้อมูลตามเวลา หรืออิงตามหน่วยวัดเฉพาะ
- ตรวจพบค่าผิดปกติ, ความบกพร่อง, ความเบี่ยงเบน, ข้อผิดพลาด, ข้อมูลที่ไม่มีเหตุผล ฯลฯ
- สื่อสารหรือแสดงข้อมูลที่ซับซ้อน
ใน PowerPoint คุณสามารถสร้างแผนภูมิได้ผ่านฟังก์ชันแทรก ซึ่งให้เทมเพลตสำหรับออกแบบแผนภูมิต่าง ๆ ด้วย Aspose.Slides คุณสามารถสร้างแผนภูมิปกติ (อิงตามประเภทแผนภูมิที่เป็นที่นิยม) และแผนภูมิที่กำหนดเองได้
สร้างแผนภูมิปกติ
- สร้างอินสแตนซ์ของคลาส Presentation
- รับอ้างอิงสไลด์ผ่านดัชนีของมัน
- เพิ่มแผนภูมิพร้อมข้อมูลบางส่วนและระบุประเภทแผนภูมิที่คุณต้องการ
- เพิ่มชื่อเรื่องให้กับแผนภูมิ
- เข้าถึง worksheet ของข้อมูลแผนภูมิ
- ลบซีรีส์และหมวดหมู่เริ่มต้นทั้งหมด
- เพิ่มซีรีส์และหมวดหมู่ใหม่
- เพิ่มข้อมูลแผนภูมิใหม่สำหรับซีรีส์แผนภูมิ
- เพิ่มสีเติมให้กับซีรีส์แผนภูมิ
- เพิ่มป้ายกำกับให้กับซีรีส์แผนภูมิ
- บันทึกการนำเสนอที่แก้ไขเป็นไฟล์ PPTX
โค้ด C++ นี้แสดงวิธีสร้างแผนภูมิปกติ:
#include <DOM/Chart/ChartType.h>
#include <DOM/Chart/IChartCategoryCollection.h>
#include <DOM/Chart/IChartData.h>
#include <DOM/Chart/IChartDataPoint.h>
#include <DOM/Chart/IChartDataPointCollection.h>
#include <DOM/Chart/IChartDataWorkbook.h>
#include <DOM/Chart/IChartSeries.h>
#include <DOM/Chart/IChartSeriesCollection.h>
#include <DOM/Chart/IChartTitle.h>
#include <DOM/Chart/IDataLabel.h>
#include <DOM/Chart/IDataLabelFormat.h>
#include <DOM/Chart/IFormat.h>
#include <DOM/FillType.h>
#include <DOM/IChart.h>
#include <DOM/IColorFormat.h>
#include <DOM/IFillFormat.h>
#include <DOM/IShapeCollection.h>
#include <DOM/ISlide.h>
#include <DOM/ISlideCollection.h>
#include <DOM/ITextFrame.h>
#include <DOM/ITextFrameFormat.h>
#include <DOM/NullableBool.h>
#include <DOM/Presentation.h>
#include <Export/SaveFormat.h>
#include <drawing/color.h>
#include <system/string.h>
using namespace Aspose::Slides;
using namespace Aspose::Slides::Charts;
using namespace Aspose::Slides::Export;
using namespace System;
using namespace System::Drawing;

// เส้นทางไปยังไดเรกทอรีเอกสาร.
	const String outPath = u"../out/NormalCharts_out.pptx";

	// สร้างอินสแตนซ์ของคลาส Presentation ที่เป็นไฟล์ PPTX
	SharedPtr<Presentation> pres = MakeObject<Presentation>();

	// เข้าถึงสไลด์แรก
	SharedPtr<ISlide> slide = pres->get_Slides()->idx_get(0);

	// เพิ่มแผนภูมิพร้อมข้อมูลเริ่มต้น
	SharedPtr<IChart> chart = slide->get_Shapes()->AddChart(Aspose::Slides::Charts::ChartType::ClusteredColumn, 0, 0, 500, 500);


	// ตั้งดัชนีของแผนข้อมูลแผนภูมิ
	int defaultWorksheetIndex = 0;

	// รับ worksheet ของข้อมูลแผนภูมิ
	SharedPtr<IChartDataWorkbook> fact = chart->get_ChartData()->get_ChartDataWorkbook();

	// ตั้งชื่อแผนภูมิ
	chart->get_ChartTitle()->AddTextFrameForOverriding(u"Sample Title");
	chart->get_ChartTitle()->get_TextFrameForOverriding()->get_TextFrameFormat()->set_CenterText ( NullableBool::True);
	chart->get_ChartTitle()->set_Height(20);
	chart->set_HasTitle( true);

	// ลบซีรีส์และหมวดหมู่เริ่มต้นที่สร้างโดยอัตโนมัติ
	chart->get_ChartData()->get_Series()->Clear();
	chart->get_ChartData()->get_Categories()->Clear();
	int s = chart->get_ChartData()->get_Series()->get_Count();
	s = chart->get_ChartData()->get_Categories()->get_Count();


	// เพิ่มซีรีส์ใหม่
	chart->get_ChartData()->get_Series()->Add(fact->GetCell(defaultWorksheetIndex, 0, 1, ObjectExt::Box<System::String>(u"Series 1")), chart->get_Type());
	chart->get_ChartData()->get_Series()->Add(fact->GetCell(defaultWorksheetIndex, 0, 2, ObjectExt::Box<System::String>(u"Series 2")), chart->get_Type());

	// เพิ่มหมวดหมู่
	chart->get_ChartData()->get_Categories()->Add(fact->GetCell(defaultWorksheetIndex, 1, 0, ObjectExt::Box<System::String>(u"Caetegoty 1")));
	chart->get_ChartData()->get_Categories()->Add(fact->GetCell(defaultWorksheetIndex, 2, 0, ObjectExt::Box<System::String>(u"Caetegoty 2")));
	chart->get_ChartData()->get_Categories()->Add(fact->GetCell(defaultWorksheetIndex, 3, 0, ObjectExt::Box<System::String>(u"Caetegoty 3")));


	// ดึงซีรีส์แผนภูมิลำดับแรก
	SharedPtr<IChartSeries> series = chart->get_ChartData()->get_Series()->idx_get(0);

	// เติมข้อมูลให้ซีรีส์
	series->get_DataPoints()->AddDataPointForBarSeries(fact->GetCell(defaultWorksheetIndex, 1, 1, ObjectExt::Box<double>(20)));
	series->get_DataPoints()->AddDataPointForBarSeries(fact->GetCell(defaultWorksheetIndex, 2, 1, ObjectExt::Box<double>(50)));
	series->get_DataPoints()->AddDataPointForBarSeries(fact->GetCell(defaultWorksheetIndex, 3, 1, ObjectExt::Box<double>(30)));

	// ตั้งค่าสีเติมให้ซีรีส์
	series->get_Format()->get_Fill()->set_FillType(FillType::Solid);
	series->get_Format()->get_Fill()->get_SolidFillColor()->set_Color(System::Drawing::Color::get_Red());


	// ดึงซีรีส์แผนภูมิที่สอง
	 series = chart->get_ChartData()->get_Series()->idx_get(1);

	// เติมข้อมูลให้ซีรีส์
	series->get_DataPoints()->AddDataPointForBarSeries(fact->GetCell(defaultWorksheetIndex, 1, 2, ObjectExt::Box<double>(30)));
	series->get_DataPoints()->AddDataPointForBarSeries(fact->GetCell(defaultWorksheetIndex, 2, 2, ObjectExt::Box<double>(10)));
	series->get_DataPoints()->AddDataPointForBarSeries(fact->GetCell(defaultWorksheetIndex, 3, 2, ObjectExt::Box<double>(60)));

	// ตั้งค่าสีเติมให้ซีรีส์
	series->get_Format()->get_Fill()->set_FillType(FillType::Solid);
	series->get_Format()->get_Fill()->get_SolidFillColor()->set_Color(System::Drawing::Color::get_Green());


	// ป้ายกำกับแรกตั้งค่าให้แสดงชื่อหมวดหมู่
	SharedPtr<IDataLabel> lbl = series->get_DataPoints()->idx_get(0)->get_Label();
	lbl->get_DataLabelFormat()->set_ShowCategoryName(true);

	lbl = series->get_DataPoints()->idx_get(1)->get_Label();
	lbl->get_DataLabelFormat()->set_ShowSeriesName (true);

	// แสดงค่าของป้ายกำกับที่สาม
	lbl = series->get_DataPoints()->idx_get(2)->get_Label();
	lbl->get_DataLabelFormat()->set_ShowValue (true);
	lbl->get_DataLabelFormat()->set_ShowSeriesName(true);
	lbl->get_DataLabelFormat()->set_Separator (u"/");

	// Saves the presentation
	pres->Save(outPath, Aspose::Slides::Export::SaveFormat::Pptx);
สร้างแผนภูมิกระจาย
แผนภูมิกระจาย (หรือที่เรียกว่า scatter plot หรือกราฟ x‑y) มักใช้เพื่อตรวจสอบรูปแบบหรือแสดงความสัมพันธ์ระหว่างสองตัวแปร
คุณอาจต้องการใช้แผนภูมิกระจายเมื่อ
- คุณมีข้อมูลเชิงตัวเลขแบบคู่
- คุณมีตัวแปรสองตัวที่จับคู่กันได้ดี
- คุณต้องการตรวจสอบว่าตัวแปรสองตัวนั้นสัมพันธ์กันหรือไม่
- คุณมีตัวแปรอิสระที่มีค่าหลายค่าสำหรับตัวแปรตาม
โค้ด C++ นี้แสดงวิธีสร้างแผนภูมิกระจายพร้อมชุดเครื่องหมายที่ต่างกัน:
#include <DOM/Chart/ChartType.h>
#include <DOM/Chart/IChartData.h>
#include <DOM/Chart/IChartDataPoint.h>
#include <DOM/Chart/IChartDataPointCollection.h>
#include <DOM/Chart/IChartDataWorkbook.h>
#include <DOM/Chart/IChartSeries.h>
#include <DOM/Chart/IChartSeriesCollection.h>
#include <DOM/Chart/IChartSeriesGroup.h>
#include <DOM/Chart/IChartSeriesGroupCollection.h>
#include <DOM/Chart/IChartTitle.h>
#include <DOM/Chart/IDataLabel.h>
#include <DOM/Chart/IDataLabelCollection.h>
#include <DOM/Chart/IDataLabelFormat.h>
#include <DOM/Chart/IFormat.h>
#include <DOM/Chart/IMarker.h>
#include <DOM/Chart/MarkerStyleType.h>
#include <DOM/FillType.h>
#include <DOM/IChart.h>
#include <DOM/IColorFormat.h>
#include <DOM/IFillFormat.h>
#include <DOM/ILineFillFormat.h>
#include <DOM/ILineFormat.h>
#include <DOM/IShapeCollection.h>
#include <DOM/ISlide.h>
#include <DOM/ISlideCollection.h>
#include <DOM/ITextFrame.h>
#include <DOM/ITextFrameFormat.h>
#include <DOM/LineDashStyle.h>
#include <DOM/LineStyle.h>
#include <DOM/NullableBool.h>
#include <DOM/Presentation.h>
#include <Export/SaveFormat.h>
#include <drawing/color.h>
#include <system/string.h>
using namespace Aspose::Slides;
using namespace Aspose::Slides::Charts;
using namespace System;

// เส้นทางไปยังไดเรกทอรีเอกสาร.
	const String outPath = u"../out/ScatteredChart_out.pptx";

	// สร้างอินสแตนซ์ของคลาส Presentation ที่เป็นไฟล์ PPTX
	SharedPtr<Presentation> pres = MakeObject<Presentation>();

	// เข้าถึงสไลด์แรก
	SharedPtr<ISlide> slide = pres->get_Slides()->idx_get(0);

	// เพิ่มแผนภูมิพร้อมข้อมูลเริ่มต้น
	SharedPtr<IChart> chart = slide->get_Shapes()->AddChart(Aspose::Slides::Charts::ChartType::ScatterWithSmoothLines, 0, 0, 500, 500);

	// ตั้งชื่อแผนภูมิ
	chart->get_ChartTitle()->AddTextFrameForOverriding(u"Sample Title");
	chart->get_ChartTitle()->get_TextFrameForOverriding()->get_TextFrameFormat()->set_CenterText(NullableBool::True);
	chart->get_ChartTitle()->set_Height(20);
	chart->set_HasTitle(true);

	// ลบซีรีส์ที่สร้างโดยอัตโนมัติ
	chart->get_ChartData()->get_Series()->Clear();

	// ตั้งดัชนีสำหรับแผ่นข้อมูลแผนภูมิ
	int defaultWorksheetIndex = 0;

	// รับ worksheet ของข้อมูลแผนภูมิ
	SharedPtr<IChartDataWorkbook> fact = chart->get_ChartData()->get_ChartDataWorkbook();


	// เพิ่มซีรีส์ใหม่
	chart->get_ChartData()->get_Series()->Add(fact->GetCell(defaultWorksheetIndex, 1, 1, ObjectExt::Box<System::String>(u"Series 1")), chart->get_Type());
	chart->get_ChartData()->get_Series()->Add(fact->GetCell(defaultWorksheetIndex, 1, 3, ObjectExt::Box<System::String>(u"Series 2")), chart->get_Type());

	// ดึงซีรีส์แผนภูมิลำดับแรก
	SharedPtr<IChartSeries> series = chart->get_ChartData()->get_Series()->idx_get(0);

	// เพิ่มจุดใหม่ (1:3)
	series->get_DataPoints()->AddDataPointForScatterSeries(fact->GetCell(defaultWorksheetIndex, 2, 1, ObjectExt::Box<double>(1)), fact->GetCell(defaultWorksheetIndex, 2, 2, ObjectExt::Box<double>(3)));

	// เพิ่มจุดใหม่ (2:10)
	series->get_DataPoints()->AddDataPointForScatterSeries(fact->GetCell(defaultWorksheetIndex, 3, 1, ObjectExt::Box<double>(2)), fact->GetCell(defaultWorksheetIndex, 3, 2, ObjectExt::Box<double>(10)));

	// แก้ไขประเภทของซีรีส์
	series->set_Type (ChartType::ScatterWithStraightLinesAndMarkers);

	// เปลี่ยนเครื่องหมายของซีรีส์แผนภูมิ
	series->get_Marker()->set_Size  (10);
	series->get_Marker()->set_Symbol(MarkerStyleType::Star);


	// ดึงซีรีส์แผนภูมิที่สอง
	series  = chart->get_ChartData()->get_Series()->idx_get(1);

	// เพิ่มจุดใหม่ (5:2)
	series->get_DataPoints()->AddDataPointForScatterSeries(fact->GetCell(defaultWorksheetIndex, 2, 3, ObjectExt::Box<double>(5)), fact->GetCell(defaultWorksheetIndex, 2, 4, ObjectExt::Box<double>(2)));

	// เพิ่มจุดใหม่ (3:1)
	series->get_DataPoints()->AddDataPointForScatterSeries(fact->GetCell(defaultWorksheetIndex, 3, 3, ObjectExt::Box<double>(3)), fact->GetCell(defaultWorksheetIndex, 3, 4, ObjectExt::Box<double>(1)));

	// เพิ่มจุดใหม่ (2:2)
	series->get_DataPoints()->AddDataPointForScatterSeries(fact->GetCell(defaultWorksheetIndex, 4, 3, ObjectExt::Box<double>(2)), fact->GetCell(defaultWorksheetIndex, 4, 4, ObjectExt::Box<double>(2)));

	// เพิ่มจุดใหม่ (5:1)
	series->get_DataPoints()->AddDataPointForScatterSeries(fact->GetCell(defaultWorksheetIndex, 5, 3, ObjectExt::Box<double>(5)), fact->GetCell(defaultWorksheetIndex, 5, 4, ObjectExt::Box<double>(1)));

	// เปลี่ยนเครื่องหมายของซีรีส์แผนภูมิ
	series->get_Marker()->set_Size ( 10);
	series->get_Marker()->set_Symbol(MarkerStyleType::Circle);


	chart->get_ChartData()->get_SeriesGroups()->idx_get(0)->set_IsColorVaried(true);

	SharedPtr<IChartDataPoint> point = series->get_DataPoints()->idx_get(0);
	point->get_Format()->get_Fill()->set_FillType(FillType::Solid);
	point->get_Format()->get_Fill()->get_SolidFillColor()->set_Color(System::Drawing::Color::get_Cyan());
	// ตั้งขอบเขตของเซกเตอร์
	point->get_Format()->get_Line()->get_FillFormat()->set_FillType(FillType::Solid);
	point->get_Format()->get_Line()->get_FillFormat()->get_SolidFillColor()->set_Color(System::Drawing::Color::get_Gray());
	point->get_Format()->get_Line()->set_Width ( 3.0);
	point->get_Format()->get_Line()->set_Style(LineStyle::ThinThick);
	point->get_Format()->get_Line()->set_DashStyle(LineDashStyle::DashDot);

	SharedPtr<IChartDataPoint> point1 = series->get_DataPoints()->idx_get(1);
	point1->get_Format()->get_Fill()->set_FillType(FillType::Solid);
	point1->get_Format()->get_Fill()->get_SolidFillColor()->set_Color(System::Drawing::Color::get_Brown());

	// ตั้งขอบเขตของเซกเตอร์
	point1->get_Format()->get_Line()->get_FillFormat()->set_FillType(FillType::Solid);
	point1->get_Format()->get_Line()->get_FillFormat()->get_SolidFillColor()->set_Color(System::Drawing::Color::get_Blue());
	point1->get_Format()->get_Line()->set_Width (3.0);
	point1->get_Format()->get_Line()->set_Style(LineStyle::Single);
	point1->get_Format()->get_Line()->set_DashStyle(LineDashStyle::LargeDashDot);


	SharedPtr<IChartDataPoint> point2 = series->get_DataPoints()->idx_get(2);
	point2->get_Format()->get_Fill()->set_FillType(FillType::Solid);
	point2->get_Format()->get_Fill()->get_SolidFillColor()->set_Color(System::Drawing::Color::get_Coral());

	// ตั้งขอบเขตของเซกเตอร์
	point2->get_Format()->get_Line()->get_FillFormat()->set_FillType(FillType::Solid);
	point2->get_Format()->get_Line()->get_FillFormat()->get_SolidFillColor()->set_Color(System::Drawing::Color::get_Red());
	point2->get_Format()->get_Line()->set_Width ( 2.0);
	point2->get_Format()->get_Line()->set_Style(LineStyle::ThickThin);
	point2->get_Format()->get_Line()->set_DashStyle(LineDashStyle::LargeDashDotDot);


	// สร้างป้ายกำกับแบบกำหนดเองสำหรับแต่ละหมวดหมู่ของซีรีส์ใหม่
	SharedPtr<IDataLabel> lbl1 = series->get_DataPoints()->idx_get(0)->get_Label();

	// lbl.ShowCategoryName = true;
	lbl1->get_DataLabelFormat()->set_ShowValue(true);


	SharedPtr<IDataLabel> lbl2 = series->get_DataPoints()->idx_get(1)->get_Label();
	lbl2->get_DataLabelFormat()->set_ShowValue(true);
	lbl2->get_DataLabelFormat()->set_ShowLegendKey(true);
	lbl2->get_DataLabelFormat()->set_ShowPercentage(true);

	SharedPtr<IDataLabel> lbl3 = series->get_DataPoints()->idx_get(2)->get_Label();

	lbl3->get_DataLabelFormat()->set_ShowSeriesName(true);
	lbl3->get_DataLabelFormat()->set_ShowPercentage(true);

	// แสดงเส้นนำสำหรับแผนภูมิ
	series->get_Labels()->get_DefaultDataLabelFormat()->set_ShowLeaderLines(true);

	// ตั้งมุมการหมุนของเซกเตอร์ในแผนภูมวงกลม
	chart->get_ChartData()->get_SeriesGroups()->idx_get(0)->set_FirstSliceAngle(180);


	// บันทึกการนำเสนอ
	pres->Save(outPath, Aspose::Slides::Export::SaveFormat::Pptx);
สร้างแผนภูมิวงกลม
แผนภูมิวงกลมเหมาะสำหรับแสดงความสัมพันธ์ส่วนต่อส่วนทั้งหมดในข้อมูล โดยเฉพาะเมื่อข้อมูลมีป้ายกำกับเชิงประเภทพร้อมค่าตัวเลข อย่างไรก็ตาม หากข้อมูลของคุณมีหลายส่วนหรือหลายป้ายกำกับ คุณอาจต้องพิจารณาใช้แผนภูมิบาร์แทน
- สร้างอินสแตนซ์ของคลาส Presentation
- รับอ้างอิงสไลด์ผ่านดัชนีของมัน
- เพิ่มแผนภูมิพร้อมข้อมูลเริ่มต้นและระบุประเภทที่ต้องการ (ในที่นี้คือ
ChartType.Pie) - เข้าถึงข้อมูลแผนภูมิ IChartDataWorkbook
- ลบซีรีส์และหมวดหมู่เริ่มต้น
- เพิ่มซีรีส์และหมวดหมู่ใหม่
- เพิ่มข้อมูลแผนภูมิใหม่สำหรับซีรีส์แผนภูมิ
- เพิ่มจุดใหม่สำหรับแผนภูมิและกำหนดสีกำกับส่วนของแผนภูมวงกลม
- ตั้งค่าป้ายกำกับสำหรับซีรีส์
- ตั้งค่า leader lines สำหรับป้ายกำกับซีรีส์
- ตั้งค่ามุมการหมุนสำหรับสไลด์แผนภูมวงกลม
- บันทึกการนำเสนอที่แก้ไขเป็นไฟล์ PPTX
โค้ด C++ นี้แสดงวิธีสร้างแผนภูมวงกลม:
#include <DOM/Chart/ChartType.h>
#include <DOM/Chart/IChartCategoryCollection.h>
#include <DOM/Chart/IChartData.h>
#include <DOM/Chart/IChartDataPoint.h>
#include <DOM/Chart/IChartDataPointCollection.h>
#include <DOM/Chart/IChartDataWorkbook.h>
#include <DOM/Chart/IChartSeries.h>
#include <DOM/Chart/IChartSeriesCollection.h>
#include <DOM/Chart/IChartSeriesGroup.h>
#include <DOM/Chart/IChartSeriesGroupCollection.h>
#include <DOM/Chart/IChartTitle.h>
#include <DOM/Chart/IDataLabel.h>
#include <DOM/Chart/IDataLabelCollection.h>
#include <DOM/Chart/IDataLabelFormat.h>
#include <DOM/Chart/IFormat.h>
#include <DOM/FillType.h>
#include <DOM/IChart.h>
#include <DOM/IColorFormat.h>
#include <DOM/IFillFormat.h>
#include <DOM/ILineFillFormat.h>
#include <DOM/ILineFormat.h>
#include <DOM/IShapeCollection.h>
#include <DOM/ISlide.h>
#include <DOM/ISlideCollection.h>
#include <DOM/ITextFrame.h>
#include <DOM/ITextFrameFormat.h>
#include <DOM/LineDashStyle.h>
#include <DOM/LineStyle.h>
#include <DOM/NullableBool.h>
#include <DOM/Presentation.h>
#include <Export/SaveFormat.h>
#include <drawing/color.h>
#include <system/string.h>
using namespace Aspose::Slides;
using namespace Aspose::Slides::Charts;
using namespace System;

	// เส้นทางไปยังไดเรกทอรีเอกสาร.
	const String outPath = u"../out/PieChart_out.pptx";

	// สร้างอินสแตนซ์ของคลาส Presentation ที่เป็นไฟล์ PPTX
	SharedPtr<Presentation> pres = MakeObject<Presentation>();

	// เข้าถึงสไลด์แรก
	SharedPtr<ISlide> slide = pres->get_Slides()->idx_get(0);

	// เพิ่มแผนภูมิพร้อมข้อมูลเริ่มต้น
	SharedPtr<IChart> chart = slide->get_Shapes()->AddChart(Aspose::Slides::Charts::ChartType::Pie, 0, 0, 500, 500);

	// ตั้งชื่อแผนภูมิ
	chart->get_ChartTitle()->AddTextFrameForOverriding(u"Sample Title");
	chart->get_ChartTitle()->get_TextFrameForOverriding()->get_TextFrameFormat()->set_CenterText(NullableBool::True);
	chart->get_ChartTitle()->set_Height(20);
	chart->set_HasTitle(true);

	// ลบซีรีส์และหมวดหมู่ที่สร้างโดยอัตโนมัติ
	chart->get_ChartData()->get_Series()->Clear();
	chart->get_ChartData()->get_Categories()->Clear();

	// ตั้งดัชนีของแผ่นข้อมูลแผนภูมิ
	int defaultWorksheetIndex = 0;

	// รับ worksheet ของข้อมูลแผนภูมิ
	SharedPtr<IChartDataWorkbook> fact = chart->get_ChartData()->get_ChartDataWorkbook();

	// เพิ่มหมวดหมู่
	chart->get_ChartData()->get_Categories()->Add(fact->GetCell(defaultWorksheetIndex, 1, 0, ObjectExt::Box<System::String>(u"First Qtr")));
	chart->get_ChartData()->get_Categories()->Add(fact->GetCell(defaultWorksheetIndex, 2, 0, ObjectExt::Box<System::String>(u"2nd Qtr")));
	chart->get_ChartData()->get_Categories()->Add(fact->GetCell(defaultWorksheetIndex, 3, 0, ObjectExt::Box<System::String>(u"3ed Qtr")));

	// เพิ่มซีรีส์ใหม่
	chart->get_ChartData()->get_Series()->Add(fact->GetCell(defaultWorksheetIndex, 0, 1, ObjectExt::Box<System::String>(u"Series 1")), chart->get_Type());

	// ดึงซีรีส์แผนภูมิลำดับแรก
	SharedPtr<IChartSeries> series = chart->get_ChartData()->get_Series()->idx_get(0);

	// เติมข้อมูลให้ซีรีส์
	series->get_DataPoints()->AddDataPointForPieSeries(fact->GetCell(defaultWorksheetIndex, 1, 1, ObjectExt::Box<double>(20)));
	series->get_DataPoints()->AddDataPointForPieSeries(fact->GetCell(defaultWorksheetIndex, 2, 1, ObjectExt::Box<double>(50)));
	series->get_DataPoints()->AddDataPointForPieSeries(fact->GetCell(defaultWorksheetIndex, 3, 1, ObjectExt::Box<double>(30)));

	chart->get_ChartData()->get_SeriesGroups()->idx_get(0)->set_IsColorVaried(true);

	SharedPtr<IChartDataPoint> point = series->get_DataPoints()->idx_get(0);
	point->get_Format()->get_Fill()->set_FillType(FillType::Solid);
	point->get_Format()->get_Fill()->get_SolidFillColor()->set_Color(System::Drawing::Color::get_Cyan());
	// ตั้งขอบเขตของเซกเตอร์
	point->get_Format()->get_Line()->get_FillFormat()->set_FillType(FillType::Solid);
	point->get_Format()->get_Line()->get_FillFormat()->get_SolidFillColor()->set_Color(System::Drawing::Color::get_Gray());
	point->get_Format()->get_Line()->set_Width ( 3.0);
	point->get_Format()->get_Line()->set_Style( LineStyle::ThinThick);
	point->get_Format()->get_Line()->set_DashStyle ( LineDashStyle::DashDot);

	SharedPtr<IChartDataPoint> point1 = series->get_DataPoints()->idx_get(1);
	point1->get_Format()->get_Fill()->set_FillType(FillType::Solid);
	point1->get_Format()->get_Fill()->get_SolidFillColor()->set_Color(System::Drawing::Color::get_Brown());

	// ตั้งขอบเขตของเซกเตอร์
	point1->get_Format()->get_Line()->get_FillFormat()->set_FillType(FillType::Solid);
	point1->get_Format()->get_Line()->get_FillFormat()->get_SolidFillColor()->set_Color(System::Drawing::Color::get_Blue());
	point1->get_Format()->get_Line()->set_Width (3.0);
	point1->get_Format()->get_Line()->set_Style(LineStyle::Single);
	point1->get_Format()->get_Line()->set_DashStyle(LineDashStyle::LargeDashDot);


	SharedPtr<IChartDataPoint> point2 = series->get_DataPoints()->idx_get(2);
	point2->get_Format()->get_Fill()->set_FillType(FillType::Solid);
	point2->get_Format()->get_Fill()->get_SolidFillColor()->set_Color(System::Drawing::Color::get_Coral());

	// ตั้งขอบเขตของเซกเตอร์
	point2->get_Format()->get_Line()->get_FillFormat()->set_FillType(FillType::Solid);
	point2->get_Format()->get_Line()->get_FillFormat()->get_SolidFillColor()->set_Color(System::Drawing::Color::get_Red());
	point2->get_Format()->get_Line()->set_Width (2.0);
	point2->get_Format()->get_Line()->set_Style(LineStyle::ThickThin);
	point2->get_Format()->get_Line()->set_DashStyle(LineDashStyle::LargeDashDotDot);


	// สร้างป้ายกำกับแบบกำหนดเองสำหรับแต่ละหมวดหมู่ของซีรีส์ใหม่
	SharedPtr<IDataLabel> lbl1 = series->get_DataPoints()->idx_get(0)->get_Label();

	// lbl.ShowCategoryName = true;
	lbl1->get_DataLabelFormat()->set_ShowValue(true);


	SharedPtr<IDataLabel> lbl2 = series->get_DataPoints()->idx_get(1)->get_Label();
	lbl2->get_DataLabelFormat()->set_ShowValue(true);
	lbl2->get_DataLabelFormat()->set_ShowLegendKey(true);
	lbl2->get_DataLabelFormat()->set_ShowPercentage(true);

	SharedPtr<IDataLabel> lbl3 = series->get_DataPoints()->idx_get(2)->get_Label();

	lbl3->get_DataLabelFormat()->set_ShowSeriesName(true);
	lbl3->get_DataLabelFormat()->set_ShowPercentage(true);

	// ตั้งค่าให้ซีรีส์แสดงเส้นนำสำหรับแผนภูมิ
	series->get_Labels()->get_DefaultDataLabelFormat()->set_ShowLeaderLines ( true);

	// ตั้งมุมการหมุนของเซกเตอร์ในแผนภูมวงกลม
	chart->get_ChartData()->get_SeriesGroups()->idx_get(0)->set_FirstSliceAngle ( 180);


	// บันทึกการนำเสนอ
	pres->Save(outPath, Aspose::Slides::Export::SaveFormat::Pptx);
สร้างแผนภูมิเส้น
แผนภูมิเส้น (หรือที่เรียกว่า line graph) เหมาะสำหรับสถานการณ์ที่ต้องการแสดงการเปลี่ยนแปลงของค่าในช่วงเวลา ใช้แผนภูมิเส้นคุณสามารถเปรียบเทียบข้อมูลจำนวนมากพร้อมกัน, ติดตามการเปลี่ยนแปลงและแนวโน้มตามเวลา, เน้นความผิดปกติในซีรีส์ข้อมูล เป็นต้น
- สร้างอินสแตนซ์ของคลาส Presentation
- รับอ้างอิงสไลด์ผ่านดัชนีของมัน
- เพิ่มแผนภูมิพร้อมข้อมูลเริ่มต้นและระบุประเภทที่ต้องการ (ในที่นี้คือ
ChartType::Line) - เข้าถึงข้อมูลแผนภูมิ IChartDataWorkbook
- ลบซีรีส์และหมวดหมู่เริ่มต้น
- เพิ่มซีรีส์และหมวดหมู่ใหม่
- เพิ่มข้อมูลแผนภูมิใหม่สำหรับซีรีส์แผนภูมิ
- บันทึกการนำเสนอที่แก้ไขเป็นไฟล์ PPTX
โค้ด C++ นี้แสดงวิธีสร้างแผนภูมิเส้น:
#include <DOM/Chart/ChartType.h>
#include <DOM/IChart.h>
#include <DOM/IShapeCollection.h>
#include <DOM/ISlide.h>
#include <DOM/ISlideCollection.h>
#include <DOM/Presentation.h>
#include <Export/SaveFormat.h>
using namespace Aspose::Slides;
using namespace Aspose::Slides::Charts;
using namespace Aspose::Slides::Export;

auto pres = System::MakeObject<Presentation>();

System::SharedPtr<IChart> lineChart = pres->get_Slides()->idx_get(0)->get_Shapes()->AddChart(ChartType::Line, 10.0f, 50.0f, 600.0f, 350.0f);
pres->Save(u"lineChart.pptx", SaveFormat::Pptx);
โดยค่าเริ่มต้น จุดบนแผนภูมิเส้นจะเชื่อมต่อด้วยเส้นตรงต่อเนื่อง หากต้องการให้จุดเชื่อมต่อด้วยเส้นประ คุณสามารถระบุประเภท dash ที่ต้องการได้ดังนี้:
#include <DOM/Chart/ChartType.h>
#include <DOM/Chart/IChartData.h>
#include <DOM/Chart/IChartSeries.h>
#include <DOM/Chart/IChartSeriesCollection.h>
#include <DOM/Chart/IFormat.h>
#include <DOM/IChart.h>
#include <DOM/ILineFormat.h>
#include <DOM/IShapeCollection.h>
#include <DOM/ISlide.h>
#include <DOM/ISlideCollection.h>
#include <DOM/LineDashStyle.h>
#include <DOM/Presentation.h>
using namespace Aspose::Slides;
using namespace Aspose::Slides::Charts;

auto pres = System::MakeObject<Presentation>();

System::SharedPtr<IChart> lineChart = pres->get_Slides()->idx_get(0)->get_Shapes()->AddChart(ChartType::Line, 10.0f, 50.0f, 600.0f, 350.0f);
for (auto&& series : lineChart->get_ChartData()->get_Series())
{
    series->get_Format()->get_Line()->set_DashStyle(LineDashStyle::Dash);
}
สร้างแผนภูมิ Tree Map
แผนภูมิ Tree Map เหมาะสำหรับข้อมูลขายเมื่อคุณต้องการแสดงขนาดสัมพัทธ์ของหมวดหมู่ข้อมูลและในเวลาเดียวกันดึงความสนใจไปยังรายการที่เป็นตัวทำให้แต่ละหมวดหมู่มีขนาดใหญ่
- สร้างอินสแตนซ์ของคลาส Presentation
- รับอ้างอิงสไลด์ผ่านดัชนีของมัน
- เพิ่มแผนภูมิพร้อมข้อมูลเริ่มต้นและระบุประเภทที่ต้องการ (ในที่นี้คือ
ChartType.TreeMap) - เข้าถึงข้อมูลแผนภูมิ IChartDataWorkbook
- ลบซีรีส์และหมวดหมู่เริ่มต้น
- เพิ่มซีรีส์และหมวดหมู่ใหม่
- เพิ่มข้อมูลแผนภูมิใหม่สำหรับซีรีส์แผนภูมิ
- บันทึกการนำเสนอที่แก้ไขเป็นไฟล์ PPTX
โค้ด C++ นี้แสดงวิธีสร้างแผนภูมิ Tree Map:
#include <DOM/Chart/ChartType.h>
#include <DOM/Chart/IChartCategory.h>
#include <DOM/Chart/IChartCategoryCollection.h>
#include <DOM/Chart/IChartCategoryLevelsManager.h>
#include <DOM/Chart/IChartData.h>
#include <DOM/Chart/IChartDataPointCollection.h>
#include <DOM/Chart/IChartDataWorkbook.h>
#include <DOM/Chart/IChartSeries.h>
#include <DOM/Chart/IChartSeriesCollection.h>
#include <DOM/Chart/IDataLabelCollection.h>
#include <DOM/Chart/IDataLabelFormat.h>
#include <DOM/Chart/ParentLabelLayoutType.h>
#include <DOM/IChart.h>
#include <DOM/IShapeCollection.h>
#include <DOM/ISlide.h>
#include <DOM/ISlideCollection.h>
#include <DOM/Presentation.h>
#include <Export/SaveFormat.h>
#include <system/string.h>
using namespace Aspose::Slides;
using namespace Aspose::Slides::Charts;
using namespace Aspose::Slides::Export;
using namespace System;

// เส้นทางไปยังไดเรกทอรีเอกสาร.
	const String outPath = u"../out/TreemapChart_out.pptx";

	//สร้างอินสแตนซ์ของคลาส Presentation ที่เป็นไฟล์ PPTX
	SharedPtr<Presentation> pres = MakeObject<Presentation>();

	// เข้าถึงสไลด์แรก
	SharedPtr<ISlide> slide = pres->get_Slides()->idx_get(0);

	System::SharedPtr<IChart> chart = slide->get_Shapes()->AddChart(Aspose::Slides::Charts::ChartType::Treemap, 50, 50, 500, 400);
	chart->get_ChartData()->get_Categories()->Clear();
	chart->get_ChartData()->get_Series()->Clear();

	System::SharedPtr<IChartDataWorkbook> wb = chart->get_ChartData()->get_ChartDataWorkbook();

	wb->Clear(0);

	// สาขา 1
	System::SharedPtr<IChartCategory> leaf = chart->get_ChartData()->get_Categories()->Add(wb->GetCell(0, u"C1", System::ObjectExt::Box<System::String>(u"Leaf1")));
	leaf->get_GroupingLevels()->SetGroupingItem(1, System::ObjectExt::Box<System::String>(u"Stem1"));
	leaf->get_GroupingLevels()->SetGroupingItem(2, System::ObjectExt::Box<System::String>(u"Branch1"));

	chart->get_ChartData()->get_Categories()->Add(wb->GetCell(0, u"C2", System::ObjectExt::Box<System::String>(u"Leaf2")));

	leaf = chart->get_ChartData()->get_Categories()->Add(wb->GetCell(0, u"C3", System::ObjectExt::Box<System::String>(u"Leaf3")));
	leaf->get_GroupingLevels()->SetGroupingItem(1, System::ObjectExt::Box<System::String>(u"Stem2"));

	chart->get_ChartData()->get_Categories()->Add(wb->GetCell(0, u"C4", System::ObjectExt::Box<System::String>(u"Leaf4")));


	// สาขา 2
	leaf = chart->get_ChartData()->get_Categories()->Add(wb->GetCell(0, u"C5", System::ObjectExt::Box<System::String>(u"Leaf5")));
	leaf->get_GroupingLevels()->SetGroupingItem(1, System::ObjectExt::Box<System::String>(u"Stem3"));
	leaf->get_GroupingLevels()->SetGroupingItem(2, System::ObjectExt::Box<System::String>(u"Branch2"));

	chart->get_ChartData()->get_Categories()->Add(wb->GetCell(0, u"C6", System::ObjectExt::Box<System::String>(u"Leaf6")));

	leaf = chart->get_ChartData()->get_Categories()->Add(wb->GetCell(0, u"C7", System::ObjectExt::Box<System::String>(u"Leaf7")));
	leaf->get_GroupingLevels()->SetGroupingItem(1, System::ObjectExt::Box<System::String>(u"Stem4"));

	chart->get_ChartData()->get_Categories()->Add(wb->GetCell(0, u"C8", System::ObjectExt::Box<System::String>(u"Leaf8")));

	System::SharedPtr<IChartSeries> series = chart->get_ChartData()->get_Series()->Add(Aspose::Slides::Charts::ChartType::Treemap);
	series->get_Labels()->get_DefaultDataLabelFormat()->set_ShowCategoryName(true);
	series->get_DataPoints()->AddDataPointForTreemapSeries(wb->GetCell(0, u"D1", System::ObjectExt::Box<int32_t>(4)));
	series->get_DataPoints()->AddDataPointForTreemapSeries(wb->GetCell(0, u"D2", System::ObjectExt::Box<int32_t>(5)));
	series->get_DataPoints()->AddDataPointForTreemapSeries(wb->GetCell(0, u"D3", System::ObjectExt::Box<int32_t>(3)));
	series->get_DataPoints()->AddDataPointForTreemapSeries(wb->GetCell(0, u"D4", System::ObjectExt::Box<int32_t>(6)));
	series->get_DataPoints()->AddDataPointForTreemapSeries(wb->GetCell(0, u"D5", System::ObjectExt::Box<int32_t>(9)));
	series->get_DataPoints()->AddDataPointForTreemapSeries(wb->GetCell(0, u"D6", System::ObjectExt::Box<int32_t>(9)));
	series->get_DataPoints()->AddDataPointForTreemapSeries(wb->GetCell(0, u"D7", System::ObjectExt::Box<int32_t>(4)));
	series->get_DataPoints()->AddDataPointForTreemapSeries(wb->GetCell(0, u"D8", System::ObjectExt::Box<int32_t>(3)));

	series->set_ParentLabelLayout(Aspose::Slides::Charts::ParentLabelLayoutType::Overlapping);

	// บันทึกการนำเสนอ
	pres->Save(outPath, Aspose::Slides::Export::SaveFormat::Pptx);
สร้างแผนภูมิ Stock
- สร้างอินสแตนซ์ของคลาส Presentation
- รับอ้างอิงสไลด์ผ่านดัชนีของมัน
- เพิ่มแผนภูมิพร้อมข้อมูลเริ่มต้นและระบุประเภทที่ต้องการ (
ChartType.OpenHighLowClose) - เข้าถึงข้อมูลแผนภูมิ IChartDataWorkbook
- ลบซีรีส์และหมวดหมู่เริ่มต้น
- เพิ่มซีรีส์และหมวดหมู่ใหม่
- เพิ่มข้อมูลแผนภูมิใหม่สำหรับซีรีส์แผนภูมิ
- ระบุรูปแบบ HiLowLines
- บันทึกการนำเสนอที่แก้ไขเป็นไฟล์ PPTX
โค้ด C++ ตัวอย่างที่ใช้สร้างแผนภูมิ Stock:
#include <DOM/Chart/ChartType.h>
#include <DOM/Chart/IChartCategoryCollection.h>
#include <DOM/Chart/IChartData.h>
#include <DOM/Chart/IChartDataPointCollection.h>
#include <DOM/Chart/IChartDataWorkbook.h>
#include <DOM/Chart/IChartLinesFormat.h>
#include <DOM/Chart/IChartSeries.h>
#include <DOM/Chart/IChartSeriesCollection.h>
#include <DOM/Chart/IChartSeriesGroup.h>
#include <DOM/Chart/IChartSeriesGroupCollection.h>
#include <DOM/Chart/IFormat.h>
#include <DOM/Chart/IUpDownBarsManager.h>
#include <DOM/FillType.h>
#include <DOM/IChart.h>
#include <DOM/ILineFillFormat.h>
#include <DOM/ILineFormat.h>
#include <DOM/IShapeCollection.h>
#include <DOM/ISlide.h>
#include <DOM/ISlideCollection.h>
#include <DOM/Presentation.h>
#include <Export/SaveFormat.h>
#include <system/string.h>
using namespace Aspose::Slides;
using namespace Aspose::Slides::Charts;
using namespace Aspose::Slides::Export;
using namespace System;

	// เส้นทางไปยังไดเรกทอรีเอกสาร.
	const String outPath = u"../out/AddStockChart_out.pptx";

	//สร้างอินสแตนซ์ของคลาส Presentation ที่เป็นไฟล์ PPTX
	SharedPtr<Presentation> pres = MakeObject<Presentation>();

	//เข้าถึงสไลด์แรก
	SharedPtr<ISlide> slide = pres->get_Slides()->idx_get(0);

	// เพิ่มแผนภูมิพร้อมข้อมูลเริ่มต้น
	SharedPtr<IChart> chart = slide->get_Shapes()->AddChart(Aspose::Slides::Charts::ChartType::OpenHighLowClose, 0, 0, 500, 500);


	// ตั้งดัชนีสำหรับแผ่นข้อมูลแผนภูมิ
	int defaultWorksheetIndex = 0;

	// รับ worksheet ของข้อมูลแผนภูมิ
	SharedPtr<IChartDataWorkbook> fact = chart->get_ChartData()->get_ChartDataWorkbook();


	// ลบซีรีส์และหมวดหมู่ที่สร้างโดยอัตโนมัติ
	chart->get_ChartData()->get_Series()->Clear();
	chart->get_ChartData()->get_Categories()->Clear();

	// เพิ่มหมวดหมู่
	chart->get_ChartData()->get_Categories()->Add(fact->GetCell(defaultWorksheetIndex, 1, 0, ObjectExt::Box<System::String>(u"A")));
	chart->get_ChartData()->get_Categories()->Add(fact->GetCell(defaultWorksheetIndex, 2, 0, ObjectExt::Box<System::String>(u"B")));
	chart->get_ChartData()->get_Categories()->Add(fact->GetCell(defaultWorksheetIndex, 3, 0, ObjectExt::Box<System::String>(u"C")));

	// เพิ่มซีรีส์ใหม่
	chart->get_ChartData()->get_Series()->Add(fact->GetCell(defaultWorksheetIndex, 0, 1, ObjectExt::Box<System::String>(u"Open")), chart->get_Type());
	chart->get_ChartData()->get_Series()->Add(fact->GetCell(defaultWorksheetIndex, 0, 2, ObjectExt::Box<System::String>(u"High")), chart->get_Type());
	chart->get_ChartData()->get_Series()->Add(fact->GetCell(defaultWorksheetIndex, 0, 3, ObjectExt::Box<System::String>(u"Low")), chart->get_Type());
	chart->get_ChartData()->get_Series()->Add(fact->GetCell(defaultWorksheetIndex, 0, 4, ObjectExt::Box<System::String>(u"Close")), chart->get_Type());


	// ดึงซีรีส์แผนภูมิลำดับแรก
	SharedPtr<IChartSeries> series = chart->get_ChartData()->get_Series()->idx_get(0);
	// เติมข้อมูลให้ซีรีส์แรก
	series->get_DataPoints()->AddDataPointForStockSeries(fact->GetCell(defaultWorksheetIndex, 1, 1, ObjectExt::Box<double>(72)));
	series->get_DataPoints()->AddDataPointForStockSeries(fact->GetCell(defaultWorksheetIndex, 2, 1, ObjectExt::Box<double>(25)));
	series->get_DataPoints()->AddDataPointForStockSeries(fact->GetCell(defaultWorksheetIndex, 3, 1, ObjectExt::Box<double>(38)));


	series = chart->get_ChartData()->get_Series()->idx_get(1);
	// เติมข้อมูลให้ซีรีส์ที่สอง
	series->get_DataPoints()->AddDataPointForStockSeries(fact->GetCell(defaultWorksheetIndex, 1, 2, ObjectExt::Box<double>(172)));
	series->get_DataPoints()->AddDataPointForStockSeries(fact->GetCell(defaultWorksheetIndex, 2, 2, ObjectExt::Box<double>(57)));
	series->get_DataPoints()->AddDataPointForStockSeries(fact->GetCell(defaultWorksheetIndex, 3, 2, ObjectExt::Box<double>(57)));

	series = chart->get_ChartData()->get_Series()->idx_get(2);
	// เติมข้อมูลให้ซีรีส์ที่สอง
	series->get_DataPoints()->AddDataPointForStockSeries(fact->GetCell(defaultWorksheetIndex, 1, 3, ObjectExt::Box<double>(12)));
	series->get_DataPoints()->AddDataPointForStockSeries(fact->GetCell(defaultWorksheetIndex, 2, 3, ObjectExt::Box<double>(12)));
	series->get_DataPoints()->AddDataPointForStockSeries(fact->GetCell(defaultWorksheetIndex, 3, 3, ObjectExt::Box<double>(13)));


	series = chart->get_ChartData()->get_Series()->idx_get(3);
	// เติมข้อมูลให้ซีรีส์ที่สอง
	series->get_DataPoints()->AddDataPointForStockSeries(fact->GetCell(defaultWorksheetIndex, 1, 4, ObjectExt::Box<double>(25)));
	series->get_DataPoints()->AddDataPointForStockSeries(fact->GetCell(defaultWorksheetIndex, 2, 4, ObjectExt::Box<double>(38)));
	series->get_DataPoints()->AddDataPointForStockSeries(fact->GetCell(defaultWorksheetIndex, 3, 4, ObjectExt::Box<double>(50)));

	// ตั้งกลุ่มซีรีส์
	chart->get_ChartData()->get_SeriesGroups()->idx_get(0)->get_UpDownBars()->set_HasUpDownBars (true);
	chart->get_ChartData()->get_SeriesGroups()->idx_get(0)->get_HiLowLinesFormat()->get_Line()->get_FillFormat()->set_FillType(FillType::Solid);


	for(int i=0;i<chart->get_ChartData()->get_Series()->get_Count();i++)
	{
		series = chart->get_ChartData()->get_Series()->idx_get(i);
		series->get_Format()->get_Line()->get_FillFormat()->set_FillType(FillType::NoFill);
	}

	// บันทึกการนำเสนอ
	pres->Save(outPath, Aspose::Slides::Export::SaveFormat::Pptx);
สร้างแผนภูมิ Box and Whisker
- สร้างอินสแตนซ์ของคลาส Presentation
- รับอ้างอิงสไลด์ผ่านดัชนีของมัน
- เพิ่มแผนภูมิพร้อมข้อมูลเริ่มต้นและระบุประเภทที่ต้องการ (
ChartType.BoxAndWhisker) - เข้าถึงข้อมูลแผนภูมิ IChartDataWorkbook
- ลบซีรีส์และหมวดหมู่เริ่มต้น
- เพิ่มซีรีส์และหมวดหมู่ใหม่
- เพิ่มข้อมูลแผนภูมิใหม่สำหรับซีรีส์แผนภูมิ
- บันทึกการนำเสนอที่แก้ไขเป็นไฟล์ PPTX
โค้ด C++ นี้แสดงวิธีสร้างแผนภูมิ Box and Whisker:
#include <DOM/Chart/ChartType.h>
#include <DOM/Chart/IChartCategoryCollection.h>
#include <DOM/Chart/IChartData.h>
#include <DOM/Chart/IChartDataPointCollection.h>
#include <DOM/Chart/IChartDataWorkbook.h>
#include <DOM/Chart/IChartSeries.h>
#include <DOM/Chart/IChartSeriesCollection.h>
#include <DOM/Chart/QuartileMethodType.h>
#include <DOM/IChart.h>
#include <DOM/IShapeCollection.h>
#include <DOM/ISlide.h>
#include <DOM/ISlideCollection.h>
#include <DOM/Presentation.h>
#include <Export/SaveFormat.h>
#include <system/string.h>
using namespace Aspose::Slides;
using namespace Aspose::Slides::Charts;
using namespace Aspose::Slides::Export;
using namespace System;

	// เส้นทางไปยังไดเรกทอรีเอกสาร.
	const String outPath = u"../out/BoxAndWhisker_out.pptx";

	//Instantiates a Presentation class that represents a PPTX file
	SharedPtr<Presentation> pres = MakeObject<Presentation>();

	//Accesses the first slide
	SharedPtr<ISlide> slide = pres->get_Slides()->idx_get(0);

	System::SharedPtr<IChart> chart = slide->get_Shapes()->AddChart(Aspose::Slides::Charts::ChartType::BoxAndWhisker, 50, 50, 500, 400);
	chart->get_ChartData()->get_Categories()->Clear();
	chart->get_ChartData()->get_Series()->Clear();

	System::SharedPtr<IChartDataWorkbook> wb = chart->get_ChartData()->get_ChartDataWorkbook();

	wb->Clear(0);

	chart->get_ChartData()->get_Categories()->Add(wb->GetCell(0, u"A1", System::ObjectExt::Box<System::String>(u"Category 1")));
	chart->get_ChartData()->get_Categories()->Add(wb->GetCell(0, u"A2", System::ObjectExt::Box<System::String>(u"Category 1")));
	chart->get_ChartData()->get_Categories()->Add(wb->GetCell(0, u"A3", System::ObjectExt::Box<System::String>(u"Category 1")));
	chart->get_ChartData()->get_Categories()->Add(wb->GetCell(0, u"A4", System::ObjectExt::Box<System::String>(u"Category 1")));
	chart->get_ChartData()->get_Categories()->Add(wb->GetCell(0, u"A5", System::ObjectExt::Box<System::String>(u"Category 1")));
	chart->get_ChartData()->get_Categories()->Add(wb->GetCell(0, u"A6", System::ObjectExt::Box<System::String>(u"Category 1")));

	System::SharedPtr<IChartSeries> series = chart->get_ChartData()->get_Series()->Add(Aspose::Slides::Charts::ChartType::BoxAndWhisker);

	series->set_QuartileMethod(Aspose::Slides::Charts::QuartileMethodType::Exclusive);
	series->set_ShowMeanLine(true);
	series->set_ShowMeanMarkers(true);
	series->set_ShowInnerPoints(true);
	series->set_ShowOutlierPoints(true);

	series->get_DataPoints()->AddDataPointForBoxAndWhiskerSeries(wb->GetCell(0, u"B1", System::ObjectExt::Box<int32_t>(15)));
	series->get_DataPoints()->AddDataPointForBoxAndWhiskerSeries(wb->GetCell(0, u"B2", System::ObjectExt::Box<int32_t>(41)));
	series->get_DataPoints()->AddDataPointForBoxAndWhiskerSeries(wb->GetCell(0, u"B3", System::ObjectExt::Box<int32_t>(16)));
	series->get_DataPoints()->AddDataPointForBoxAndWhiskerSeries(wb->GetCell(0, u"B4", System::ObjectExt::Box<int32_t>(10)));
	series->get_DataPoints()->AddDataPointForBoxAndWhiskerSeries(wb->GetCell(0, u"B5", System::ObjectExt::Box<int32_t>(23)));
	series->get_DataPoints()->AddDataPointForBoxAndWhiskerSeries(wb->GetCell(0, u"B6", System::ObjectExt::Box<int32_t>(16)));


	// Saves the presentation
	pres->Save(outPath, Aspose::Slides::Export::SaveFormat::Pptx);
สร้างแผนภูมิ Funnel
- สร้างอินสแตนซ์ของคลาส Presentation
- รับอ้างอิงสไลด์ผ่านดัชนีของมัน
- เพิ่มแผนภูมิพร้อมข้อมูลเริ่มต้นและระบุประเภทที่ต้องการ (
ChartType.Funnel) - บันทึกการนำเสนอที่แก้ไขเป็นไฟล์ PPTX
โค้ด C++ นี้แสดงวิธีสร้างแผนภูมิ Funnel:
#include <DOM/Chart/ChartType.h>
#include <DOM/Chart/IChartCategoryCollection.h>
#include <DOM/Chart/IChartData.h>
#include <DOM/Chart/IChartDataPointCollection.h>
#include <DOM/Chart/IChartDataWorkbook.h>
#include <DOM/Chart/IChartSeries.h>
#include <DOM/Chart/IChartSeriesCollection.h>
#include <DOM/IChart.h>
#include <DOM/IShapeCollection.h>
#include <DOM/ISlide.h>
#include <DOM/ISlideCollection.h>
#include <DOM/Presentation.h>
#include <Export/SaveFormat.h>
#include <system/string.h>
using namespace Aspose::Slides;
using namespace Aspose::Slides::Charts;
using namespace Aspose::Slides::Export;
using namespace System;

	// เส้นทางไปยังไดเรกทอรีเอกสาร.
	const String outPath = u"../out/FunnelChart_out.pptx";

	//สร้างอินสแตนซ์ของคลาส Presentation ที่เป็นไฟล์ PPTX
	SharedPtr<Presentation> pres = MakeObject<Presentation>();

	//เข้าถึงสไลด์แรก
	SharedPtr<ISlide> slide = pres->get_Slides()->idx_get(0);

	System::SharedPtr<IChart> chart = slide->get_Shapes()->AddChart(Aspose::Slides::Charts::ChartType::Funnel, 50, 50, 500, 400);
	chart->get_ChartData()->get_Categories()->Clear();
	chart->get_ChartData()->get_Series()->Clear();

	System::SharedPtr<IChartDataWorkbook> wb = chart->get_ChartData()->get_ChartDataWorkbook();

	wb->Clear(0);

	chart->get_ChartData()->get_Categories()->Add(wb->GetCell(0, u"A1", System::ObjectExt::Box<System::String>(u"Category 1")));
	chart->get_ChartData()->get_Categories()->Add(wb->GetCell(0, u"A2", System::ObjectExt::Box<System::String>(u"Category 2")));
	chart->get_ChartData()->get_Categories()->Add(wb->GetCell(0, u"A3", System::ObjectExt::Box<System::String>(u"Category 3")));
	chart->get_ChartData()->get_Categories()->Add(wb->GetCell(0, u"A4", System::ObjectExt::Box<System::String>(u"Category 4")));
	chart->get_ChartData()->get_Categories()->Add(wb->GetCell(0, u"A5", System::ObjectExt::Box<System::String>(u"Category 5")));
	chart->get_ChartData()->get_Categories()->Add(wb->GetCell(0, u"A6", System::ObjectExt::Box<System::String>(u"Category 6")));

	System::SharedPtr<IChartSeries> series = chart->get_ChartData()->get_Series()->Add(Aspose::Slides::Charts::ChartType::Funnel);

	series->get_DataPoints()->AddDataPointForFunnelSeries(wb->GetCell(0, u"B1", System::ObjectExt::Box<int32_t>(50)));
	series->get_DataPoints()->AddDataPointForFunnelSeries(wb->GetCell(0, u"B2", System::ObjectExt::Box<int32_t>(100)));
	series->get_DataPoints()->AddDataPointForFunnelSeries(wb->GetCell(0, u"B3", System::ObjectExt::Box<int32_t>(200)));
	series->get_DataPoints()->AddDataPointForFunnelSeries(wb->GetCell(0, u"B4", System::ObjectExt::Box<int32_t>(300)));
	series->get_DataPoints()->AddDataPointForFunnelSeries(wb->GetCell(0, u"B5", System::ObjectExt::Box<int32_t>(400)));
	series->get_DataPoints()->AddDataPointForFunnelSeries(wb->GetCell(0, u"B6", System::ObjectExt::Box<int32_t>(500)));


	// บันทึกการนำเสนอ
	pres->Save(outPath, Aspose::Slides::Export::SaveFormat::Pptx);
สร้างแผนภูมิ Sunburst
- สร้างอินสแตนซ์ของคลาส Presentation
- รับอ้างอิงสไลด์ผ่านดัชนีของมัน
- เพิ่มแผนภูมิพร้อมข้อมูลเริ่มต้นและระบุประเภทที่ต้องการ (ในที่นี้คือ
ChartType.sunburst) - บันทึกการนำเสนอที่แก้ไขเป็นไฟล์ PPTX
โค้ด C++ นี้แสดงวิธีสร้างแผนภูมิ Sunburst:
#include <DOM/Chart/ChartType.h>
#include <DOM/Chart/IChartCategory.h>
#include <DOM/Chart/IChartCategoryCollection.h>
#include <DOM/Chart/IChartCategoryLevelsManager.h>
#include <DOM/Chart/IChartData.h>
#include <DOM/Chart/IChartDataPointCollection.h>
#include <DOM/Chart/IChartDataWorkbook.h>
#include <DOM/Chart/IChartSeries.h>
#include <DOM/Chart/IChartSeriesCollection.h>
#include <DOM/Chart/IDataLabelCollection.h>
#include <DOM/Chart/IDataLabelFormat.h>
#include <DOM/IChart.h>
#include <DOM/IShapeCollection.h>
#include <DOM/ISlide.h>
#include <DOM/ISlideCollection.h>
#include <DOM/Presentation.h>
#include <Export/SaveFormat.h>
#include <system/string.h>
using namespace Aspose::Slides;
using namespace Aspose::Slides::Charts;
using namespace Aspose::Slides::Export;
using namespace System;

	// เส้นทางไปยังไดเรกทอรีเอกสาร.
	const String outPath = u"../out/SunburstChart_out.pptx";

	// สร้างอินสแตนซ์ของคลาส Presentation ที่เป็นไฟล์ PPTX
	SharedPtr<Presentation> pres = MakeObject<Presentation>();

	// เข้าถึงสไลด์แรก
	SharedPtr<ISlide> slide = pres->get_Slides()->idx_get(0);

	System::SharedPtr<IChart> chart=slide->get_Shapes()->AddChart(Aspose::Slides::Charts::ChartType::Sunburst, 50, 50, 500, 400);
	chart->get_ChartData()->get_Categories()->Clear();
	chart->get_ChartData()->get_Series()->Clear();

	System::SharedPtr<IChartDataWorkbook> wb = chart->get_ChartData()->get_ChartDataWorkbook();

	wb->Clear(0);

	// สาขา 1
	System::SharedPtr<IChartCategory> leaf = chart->get_ChartData()->get_Categories()->Add(wb->GetCell(0, u"C1", System::ObjectExt::Box<System::String>(u"Leaf1")));
	leaf->get_GroupingLevels()->SetGroupingItem(1, System::ObjectExt::Box<System::String>(u"Stem1"));
	leaf->get_GroupingLevels()->SetGroupingItem(2, System::ObjectExt::Box<System::String>(u"Branch1"));

	chart->get_ChartData()->get_Categories()->Add(wb->GetCell(0, u"C2", System::ObjectExt::Box<System::String>(u"Leaf2")));

	leaf = chart->get_ChartData()->get_Categories()->Add(wb->GetCell(0, u"C3", System::ObjectExt::Box<System::String>(u"Leaf3")));
	leaf->get_GroupingLevels()->SetGroupingItem(1, System::ObjectExt::Box<System::String>(u"Stem2"));

	chart->get_ChartData()->get_Categories()->Add(wb->GetCell(0, u"C4", System::ObjectExt::Box<System::String>(u"Leaf4")));

	// สาขา 2
	leaf = chart->get_ChartData()->get_Categories()->Add(wb->GetCell(0, u"C5", System::ObjectExt::Box<System::String>(u"Leaf5")));
	leaf->get_GroupingLevels()->SetGroupingItem(1, System::ObjectExt::Box<System::String>(u"Stem3"));
	leaf->get_GroupingLevels()->SetGroupingItem(2, System::ObjectExt::Box<System::String>(u"Branch2"));

	chart->get_ChartData()->get_Categories()->Add(wb->GetCell(0, u"C6", System::ObjectExt::Box<System::String>(u"Leaf6")));

	leaf = chart->get_ChartData()->get_Categories()->Add(wb->GetCell(0, u"C7", System::ObjectExt::Box<System::String>(u"Leaf7")));
	leaf->get_GroupingLevels()->SetGroupingItem(1, System::ObjectExt::Box<System::String>(u"Stem4"));

	chart->get_ChartData()->get_Categories()->Add(wb->GetCell(0, u"C8", System::ObjectExt::Box<System::String>(u"Leaf8")));

	System::SharedPtr<IChartSeries> series = chart->get_ChartData()->get_Series()->Add(Aspose::Slides::Charts::ChartType::Sunburst);
	series->get_Labels()->get_DefaultDataLabelFormat()->set_ShowCategoryName(true);
	series->get_DataPoints()->AddDataPointForSunburstSeries(wb->GetCell(0, u"D1", System::ObjectExt::Box<int32_t>(4)));
	series->get_DataPoints()->AddDataPointForSunburstSeries(wb->GetCell(0, u"D2", System::ObjectExt::Box<int32_t>(5)));
	series->get_DataPoints()->AddDataPointForSunburstSeries(wb->GetCell(0, u"D3", System::ObjectExt::Box<int32_t>(3)));
	series->get_DataPoints()->AddDataPointForSunburstSeries(wb->GetCell(0, u"D4", System::ObjectExt::Box<int32_t>(6)));
	series->get_DataPoints()->AddDataPointForSunburstSeries(wb->GetCell(0, u"D5", System::ObjectExt::Box<int32_t>(9)));
	series->get_DataPoints()->AddDataPointForSunburstSeries(wb->GetCell(0, u"D6", System::ObjectExt::Box<int32_t>(9)));
	series->get_DataPoints()->AddDataPointForSunburstSeries(wb->GetCell(0, u"D7", System::ObjectExt::Box<int32_t>(4)));
	series->get_DataPoints()->AddDataPointForSunburstSeries(wb->GetCell(0, u"D8", System::ObjectExt::Box<int32_t>(3)));

	// บันทึกไฟล์การนำเสนอลงดิสก์
	pres->Save(outPath, Aspose::Slides::Export::SaveFormat::Pptx);
สร้างแผนภูมิ Histogram
- สร้างอินสแตนซ์ของคลาส Presentation
- รับอ้างอิงสไลด์ผ่านดัชนีของมัน
- เพิ่มแผนภูมิพร้อมข้อมูลบางส่วนและระบุประเภทที่ต้องการ (
ChartType.Histogramในที่นี้) - เข้าถึงข้อมูลแผนภูมิ
IChartDataWorkbook - ลบซีรีส์และหมวดหมู่เริ่มต้น
- เพิ่มซีรีส์และหมวดหมู่ใหม่
- บันทึกการนำเสนอที่แก้ไขเป็นไฟล์ PPTX
โค้ด C++ นี้แสดงวิธีสร้างแผนภูมิ Histogram:
#include <DOM/Chart/AxisAggregationType.h>
#include <DOM/Chart/ChartType.h>
#include <DOM/Chart/IAxesManager.h>
#include <DOM/Chart/IAxis.h>
#include <DOM/Chart/IChartCategoryCollection.h>
#include <DOM/Chart/IChartData.h>
#include <DOM/Chart/IChartDataPointCollection.h>
#include <DOM/Chart/IChartDataWorkbook.h>
#include <DOM/Chart/IChartSeries.h>
#include <DOM/Chart/IChartSeriesCollection.h>
#include <DOM/IChart.h>
#include <DOM/IShapeCollection.h>
#include <DOM/ISlide.h>
#include <DOM/ISlideCollection.h>
#include <DOM/Presentation.h>
#include <Export/SaveFormat.h>
#include <system/string.h>
using namespace Aspose::Slides;
using namespace Aspose::Slides::Charts;
using namespace Aspose::Slides::Export;
using namespace System;

	// เส้นทางไปยังไดเรกทอรีเอกสาร.
	const String outPath = u"../out/HistogramChart_out.pptx";

	// สร้างอินสแตนซ์ของคลาส Presentation ที่เป็นไฟล์ PPTX
	SharedPtr<Presentation> pres = MakeObject<Presentation>();

	// เข้าถึงสไลด์แรก
	SharedPtr<ISlide> slide = pres->get_Slides()->idx_get(0);

	System::SharedPtr<IChart> chart = slide->get_Shapes()->AddChart(Aspose::Slides::Charts::ChartType::Histogram, 50, 50, 500, 400);
	chart->get_ChartData()->get_Categories()->Clear();
	chart->get_ChartData()->get_Series()->Clear();

	System::SharedPtr<IChartDataWorkbook> wb = chart->get_ChartData()->get_ChartDataWorkbook();

	wb->Clear(0);

	System::SharedPtr<IChartSeries> series = chart->get_ChartData()->get_Series()->Add(Aspose::Slides::Charts::ChartType::Histogram);
	series->get_DataPoints()->AddDataPointForHistogramSeries(wb->GetCell(0, u"A1", System::ObjectExt::Box<int32_t>(15)));
	series->get_DataPoints()->AddDataPointForHistogramSeries(wb->GetCell(0, u"A2", System::ObjectExt::Box<int32_t>(-41)));
	series->get_DataPoints()->AddDataPointForHistogramSeries(wb->GetCell(0, u"A3", System::ObjectExt::Box<int32_t>(16)));
	series->get_DataPoints()->AddDataPointForHistogramSeries(wb->GetCell(0, u"A4", System::ObjectExt::Box<int32_t>(10)));
	series->get_DataPoints()->AddDataPointForHistogramSeries(wb->GetCell(0, u"A5", System::ObjectExt::Box<int32_t>(-23)));
	series->get_DataPoints()->AddDataPointForHistogramSeries(wb->GetCell(0, u"A6", System::ObjectExt::Box<int32_t>(16)));

	chart->get_Axes()->get_HorizontalAxis()->set_AggregationType(Aspose::Slides::Charts::AxisAggregationType::Automatic);

	// บันทึกการนำเสนอ
	pres->Save(outPath, Aspose::Slides::Export::SaveFormat::Pptx);
สร้างแผนภูมิ Radar
- สร้างอินสแตนซ์ของคลาส Presentation
- รับอ้างอิงสไลด์ผ่านดัชนีของมัน
- เพิ่มแผนภูมิพร้อมข้อมูลบางส่วนและระบุประเภทที่ต้องการ (
ChartType.Radarในที่นี้) - บันทึกการนำเสนอที่แก้ไขเป็นไฟล์ PPTX
โค้ด C++ นี้แสดงวิธีสร้างแผนภูมิ Radar:
#include <DOM/Chart/ChartType.h>
#include <DOM/IShapeCollection.h>
#include <DOM/ISlide.h>
#include <DOM/ISlideCollection.h>
#include <DOM/Presentation.h>
#include <Export/SaveFormat.h>
using namespace Aspose::Slides;

System::SharedPtr<Presentation> presentation = System::MakeObject<Presentation>();

presentation->get_Slides()->idx_get(0)->get_Shapes()->AddChart(Aspose::Slides::Charts::ChartType::Radar, 20.0f, 20.0f, 400.0f, 300.0f);
presentation->Save(u"Radar-chart.pptx", Aspose::Slides::Export::SaveFormat::Pptx);
สร้างแผนภูมิหลายหมวดหมู่
- สร้างอินสแตนซ์ของคลาส Presentation
- รับอ้างอิงสไลด์ผ่านดัชนีของมัน
- เพิ่มแผนภูมิพร้อมข้อมูลเริ่มต้นและระบุประเภทที่ต้องการ (
ChartType.ClusteredColumn) - เข้าถึงข้อมูลแผนภูมิ IChartDataWorkbook
- ลบซีรีส์และหมวดหมู่เริ่มต้น
- เพิ่มซีรีส์และหมวดหมู่ใหม่
- เพิ่มข้อมูลแผนภูมิใหม่สำหรับซีรีส์แผนภูมิ
- บันทึกการนำเสนอที่แก้ไขเป็นไฟล์ PPTX
โค้ด C++ นี้แสดงวิธีสร้างแผนภูมิหลายหมวดหมู่:
#include <DOM/Chart/ChartType.h>
#include <DOM/Chart/IChartCategory.h>
#include <DOM/Chart/IChartCategoryCollection.h>
#include <DOM/Chart/IChartCategoryLevelsManager.h>
#include <DOM/Chart/IChartData.h>
#include <DOM/Chart/IChartDataPointCollection.h>
#include <DOM/Chart/IChartDataWorkbook.h>
#include <DOM/Chart/IChartSeries.h>
#include <DOM/Chart/IChartSeriesCollection.h>
#include <DOM/IChart.h>
#include <DOM/IShapeCollection.h>
#include <DOM/ISlide.h>
#include <DOM/ISlideCollection.h>
#include <DOM/Presentation.h>
#include <Export/SaveFormat.h>
#include <system/object_ext.h>
#include <system/string.h>
using namespace Aspose::Slides;
using namespace Aspose::Slides::Charts;
using namespace Aspose::Slides::Export;
using namespace System;

	// เส้นทางไปยังไดเรกทอรีเอกสาร.
	const String outPath = u"../out/MultiCategoryChart_out.pptx";

	// สร้างอินสแตนซ์ของคลาส Presentation ที่เป็นไฟล์ PPTX
	SharedPtr<Presentation> pres = MakeObject<Presentation>();

	// เข้าถึงสไลด์แรก
	SharedPtr<ISlide> slide = pres->get_Slides()->idx_get(0);

	// เพิ่มแผนภูมิพร้อมข้อมูลเริ่มต้น
	SharedPtr<IChart> chart = slide->get_Shapes()->AddChart(Aspose::Slides::Charts::ChartType::ClusteredColumn, 0, 0, 500, 500);

	// ตั้งดัชนีสำหรับแผ่นข้อมูลแผนภูมิ
	int defaultWorksheetIndex = 0;

	// รับ worksheet ของข้อมูลแผนภูมิ
	SharedPtr<IChartDataWorkbook> fact = chart->get_ChartData()->get_ChartDataWorkbook();

	// ล้าง workbook
	fact->Clear(defaultWorksheetIndex);

	chart->get_ChartData()->get_Series()->Clear();
	chart->get_ChartData()->get_Categories()->Clear();


	// เพิ่มหมวดหมู่
	SharedPtr<IChartCategory> category = chart->get_ChartData()->get_Categories()->Add(fact->GetCell(defaultWorksheetIndex, u"c2", ObjectExt::Box<System::String>(u"A")));
	category->get_GroupingLevels()->SetGroupingItem(1, ObjectExt::Box<System::String>(u"Group1"));
	chart->get_ChartData()->get_Categories()->Add(fact->GetCell(defaultWorksheetIndex, u"c3", ObjectExt::Box<System::String>(u"B")));

	category = chart->get_ChartData()->get_Categories()->Add(fact->GetCell(defaultWorksheetIndex, u"c4", ObjectExt::Box<System::String>(u"C")));
	category->get_GroupingLevels()->SetGroupingItem(1, ObjectExt::Box<System::String>(u"Group2"));
	chart->get_ChartData()->get_Categories()->Add(fact->GetCell(defaultWorksheetIndex, u"c5", ObjectExt::Box<System::String>(u"D")));

	category = chart->get_ChartData()->get_Categories()->Add(fact->GetCell(defaultWorksheetIndex, u"c6", ObjectExt::Box<System::String>(u"E")));
	category->get_GroupingLevels()->SetGroupingItem(1, ObjectExt::Box<System::String>(u"Group3"));
	chart->get_ChartData()->get_Categories()->Add(fact->GetCell(defaultWorksheetIndex, u"c7", ObjectExt::Box<System::String>(u"F")));


	category = chart->get_ChartData()->get_Categories()->Add(fact->GetCell(defaultWorksheetIndex, u"c8", ObjectExt::Box<System::String>(u"G")));
	category->get_GroupingLevels()->SetGroupingItem(1, ObjectExt::Box<System::String>(u"Group4"));
	chart->get_ChartData()->get_Categories()->Add(fact->GetCell(defaultWorksheetIndex, u"c9", ObjectExt::Box<System::String>(u"H")));

	// เพิ่มซีรีส์ใหม่
	SharedPtr<IChartSeries>  series = chart->get_ChartData()->get_Series()->Add(fact->GetCell(0, u"D1", ObjectExt::Box<System::String>(u"Series 1")),
		ChartType::ClusteredColumn);

	series->get_DataPoints()->AddDataPointForBarSeries(fact->GetCell(defaultWorksheetIndex, u"D2", ObjectExt::Box<double>(10)));
	series->get_DataPoints()->AddDataPointForBarSeries(fact->GetCell(defaultWorksheetIndex, u"D3", ObjectExt::Box<double>(20)));
	series->get_DataPoints()->AddDataPointForBarSeries(fact->GetCell(defaultWorksheetIndex, u"D4", ObjectExt::Box<double>(30)));
	series->get_DataPoints()->AddDataPointForBarSeries(fact->GetCell(defaultWorksheetIndex, u"D5", ObjectExt::Box<double>(40)));
	series->get_DataPoints()->AddDataPointForBarSeries(fact->GetCell(defaultWorksheetIndex, u"D6", ObjectExt::Box<double>(50)));
	series->get_DataPoints()->AddDataPointForBarSeries(fact->GetCell(defaultWorksheetIndex, u"D7", ObjectExt::Box<double>(60)));
	series->get_DataPoints()->AddDataPointForBarSeries(fact->GetCell(defaultWorksheetIndex, u"D8", ObjectExt::Box<double>(70)));
	series->get_DataPoints()->AddDataPointForBarSeries(fact->GetCell(defaultWorksheetIndex, u"D9", ObjectExt::Box<double>(80)));

	// บันทึกการนำเสนอ
	pres->Save(outPath, Aspose::Slides::Export::SaveFormat::Pptx);
สร้างแผนภูมิแผนที่
แผนภูมิแผนที่เป็นการแสดงภาพของพื้นที่ที่มีข้อมูล แผนภูมิแผนที่เหมาะสำหรับการเปรียบเทียบข้อมูลหรือค่าต่าง ๆ ระหว่างภูมิภาคทางภูมิศาสตร์
โค้ด C++ นี้แสดงวิธีสร้างแผนภูมิแผนที่:
#include <DOM/Chart/ChartType.h>
#include <DOM/IShapeCollection.h>
#include <DOM/ISlide.h>
#include <DOM/ISlideCollection.h>
#include <DOM/Presentation.h>
#include <Export/SaveFormat.h>
using namespace Aspose::Slides;
using namespace Aspose::Slides::Charts;
using namespace Aspose::Slides::Export;

auto pres = System::MakeObject<Presentation>();
auto slide = pres->get_Slides()->idx_get(0);
auto chart = slide->get_Shapes()->AddChart(ChartType::Map, 50.0f, 50.0f, 500.0f, 400.0f);
pres->Save(u"mapChart.pptx", SaveFormat::Pptx);
สร้างแผนภูมิผสม
แผนภูมิผสม (หรือ combo chart) รวมประเภทแผนภูมิต่าง ๆ สองประเภทหรือมากกว่าบนกราฟเดียว แผนภูมินี้ช่วยให้คุณเน้น, เปรียบเทียบ หรือพิจารณาความแตกต่างระหว่างชุดข้อมูลหลายชุด, ทำให้สามารถระบุความสัมพันธ์ระหว่างข้อมูลได้ง่ายขึ้น
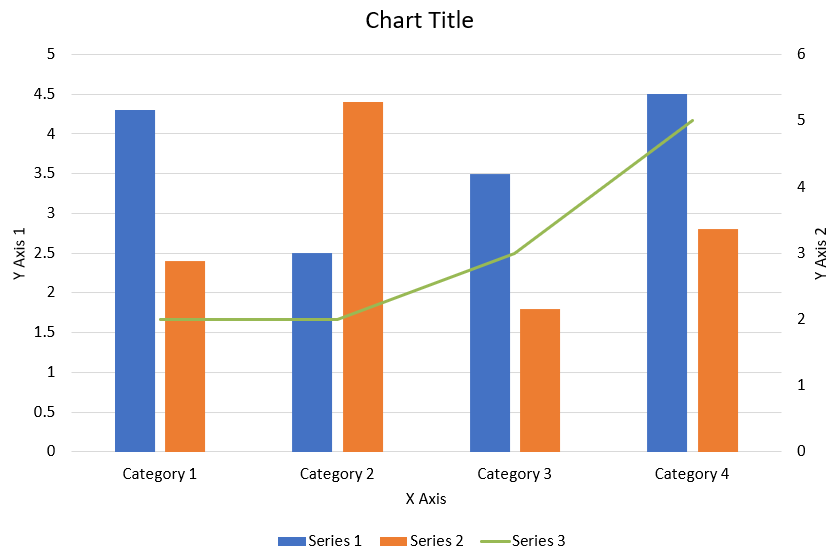
โค้ด C++ ต่อไปนี้แสดงวิธีสร้างแผนภูมิผสมตามที่แสดงด้านบนใน PowerPoint presentation:
#include <DOM/Chart/AxisPositionType.h>
#include <DOM/Chart/ChartType.h>
#include <DOM/Chart/CrossesType.h>
#include <DOM/Chart/IAxesManager.h>
#include <DOM/Chart/IAxis.h>
#include <DOM/Chart/IAxisFormat.h>
#include <DOM/Chart/IChartCategoryCollection.h>
#include <DOM/Chart/IChartData.h>
#include <DOM/Chart/IChartDataPointCollection.h>
#include <DOM/Chart/IChartDataWorkbook.h>
#include <DOM/Chart/IChartLinesFormat.h>
#include <DOM/Chart/IChartPortionFormat.h>
#include <DOM/Chart/IChartSeries.h>
#include <DOM/Chart/IChartSeriesCollection.h>
#include <DOM/Chart/IChartSeriesGroup.h>
#include <DOM/Chart/IChartTextFormat.h>
#include <DOM/Chart/IChartTitle.h>
#include <DOM/Chart/ILegend.h>
#include <DOM/Chart/LegendPositionType.h>
#include <DOM/FillType.h>
#include <DOM/IChart.h>
#include <DOM/IColorFormat.h>
#include <DOM/ILineFillFormat.h>
#include <DOM/ILineFormat.h>
#include <DOM/IParagraph.h>
#include <DOM/IParagraphFormat.h>
#include <DOM/IPortionFormat.h>
#include <DOM/IShapeCollection.h>
#include <DOM/ISlide.h>
#include <DOM/ITextFrame.h>
#include <DOM/NullableBool.h>
#include <DOM/Presentation.h>
#include <Export/SaveFormat.h>
#include <drawing/color.h>
#include <system/string.h>
using namespace Aspose::Slides;
using namespace Aspose::Slides::Charts;
using namespace Aspose::Slides::Export;
using namespace System;
using namespace System::Drawing;

static SharedPtr<IChart> CreateChartWithFirstSeries(SharedPtr<ISlide> slide)
{
    auto chart = slide->get_Shapes()->AddChart(ChartType::ClusteredColumn, 50, 50, 600, 400);

    // ตั้งชื่อแผนภูมิ.
    chart->set_HasTitle(true);
    chart->get_ChartTitle()->AddTextFrameForOverriding(u"Chart Title");
    chart->get_ChartTitle()->set_Overlay(false);
    auto titleParagraph = chart->get_ChartTitle()->get_TextFrameForOverriding()->get_Paragraph(0);
    auto titleFormat = titleParagraph->get_ParagraphFormat()->get_DefaultPortionFormat();
    titleFormat->set_FontBold(NullableBool::False);
    titleFormat->set_FontHeight(18.0);

    // ตั้งค่าสัญลักษณ์อธิบายแผนภูมิ.
    chart->get_Legend()->set_Position(LegendPositionType::Bottom);
    chart->get_Legend()->get_TextFormat()->get_PortionFormat()->set_FontHeight(12.0);

    // ลบซีรีส์และหมวดหมู่ที่สร้างโดยอัตโนมัติ.
    chart->get_ChartData()->get_Series()->Clear();
    chart->get_ChartData()->get_Categories()->Clear();

    const int worksheetIndex = 0;
    auto workbook = chart->get_ChartData()->get_ChartDataWorkbook();

    // เพิ่มหมวดหมู่ใหม่.
    chart->get_ChartData()->get_Categories()->Add(workbook->GetCell(worksheetIndex, 1, 0, ObjectExt::Box<String>(u"Category 1")));
    chart->get_ChartData()->get_Categories()->Add(workbook->GetCell(worksheetIndex, 2, 0, ObjectExt::Box<String>(u"Category 2")));
    chart->get_ChartData()->get_Categories()->Add(workbook->GetCell(worksheetIndex, 3, 0, ObjectExt::Box<String>(u"Category 3")));
    chart->get_ChartData()->get_Categories()->Add(workbook->GetCell(worksheetIndex, 4, 0, ObjectExt::Box<String>(u"Category 4")));

    // เพิ่มซีรีส์แรก.
    auto seriesNameCell = workbook->GetCell(worksheetIndex, 0, 1, ObjectExt::Box<String>(u"Series 1"));
    auto series = chart->get_ChartData()->get_Series()->Add(seriesNameCell, chart->get_Type());

    series->get_ParentSeriesGroup()->set_Overlap(-25);
    series->get_ParentSeriesGroup()->set_GapWidth(220);

    series->get_DataPoints()->AddDataPointForBarSeries(workbook->GetCell(worksheetIndex, 1, 1, ObjectExt::Box<double>(4.3)));
    series->get_DataPoints()->AddDataPointForBarSeries(workbook->GetCell(worksheetIndex, 2, 1, ObjectExt::Box<double>(2.5)));
    series->get_DataPoints()->AddDataPointForBarSeries(workbook->GetCell(worksheetIndex, 3, 1, ObjectExt::Box<double>(3.5)));
    series->get_DataPoints()->AddDataPointForBarSeries(workbook->GetCell(worksheetIndex, 4, 1, ObjectExt::Box<double>(4.5)));

    return chart;
}

static void AddSecondSeriesToChart(SharedPtr<IChart> chart)
{
    auto workbook = chart->get_ChartData()->get_ChartDataWorkbook();
    const int worksheetIndex = 0;

    auto seriesNameCell = workbook->GetCell(worksheetIndex, 0, 2, ObjectExt::Box<String>(u"Series 2"));
    auto series = chart->get_ChartData()->get_Series()->Add(seriesNameCell, ChartType::ClusteredColumn);

    series->get_ParentSeriesGroup()->set_Overlap(-25);
    series->get_ParentSeriesGroup()->set_GapWidth(220);

    series->get_DataPoints()->AddDataPointForBarSeries(workbook->GetCell(worksheetIndex, 1, 2, ObjectExt::Box<double>(2.4)));
    series->get_DataPoints()->AddDataPointForBarSeries(workbook->GetCell(worksheetIndex, 2, 2, ObjectExt::Box<double>(4.4)));
    series->get_DataPoints()->AddDataPointForBarSeries(workbook->GetCell(worksheetIndex, 3, 2, ObjectExt::Box<double>(1.8)));
    series->get_DataPoints()->AddDataPointForBarSeries(workbook->GetCell(worksheetIndex, 4, 2, ObjectExt::Box<double>(2.8)));
}

static void AddThirdSeriesToChart(SharedPtr<IChart> chart)
{
    auto workbook = chart->get_ChartData()->get_ChartDataWorkbook();
    const int worksheetIndex = 0;

    auto seriesNameCell = workbook->GetCell(worksheetIndex, 0, 3, ObjectExt::Box<String>(u"Series 3"));
    auto series = chart->get_ChartData()->get_Series()->Add(seriesNameCell, ChartType::Line);

    series->get_DataPoints()->AddDataPointForLineSeries(workbook->GetCell(worksheetIndex, 1, 3, ObjectExt::Box<double>(2.0)));
    series->get_DataPoints()->AddDataPointForLineSeries(workbook->GetCell(worksheetIndex, 2, 3, ObjectExt::Box<double>(2.0)));
    series->get_DataPoints()->AddDataPointForLineSeries(workbook->GetCell(worksheetIndex, 3, 3, ObjectExt::Box<double>(3.0)));
    series->get_DataPoints()->AddDataPointForLineSeries(workbook->GetCell(worksheetIndex, 4, 3, ObjectExt::Box<double>(5.0)));

    series->set_PlotOnSecondAxis(true);
}

static void SetAxisTitle(SharedPtr<IAxis> axis, String axisTitle)
{
    axis->set_HasTitle(true);
    axis->get_Title()->set_Overlay(false);
    auto titleParagraph = axis->get_Title()->AddTextFrameForOverriding(axisTitle)->get_Paragraph(0);
    auto titleFormat = titleParagraph->get_ParagraphFormat()->get_DefaultPortionFormat();
    titleFormat->set_FontBold(NullableBool::False);
    titleFormat->set_FontHeight(12.0);
}

static void SetPrimaryAxesFormat(SharedPtr<IChart> chart)
{
    // ตั้งแกนนอน.
    auto horizontalAxis = chart->get_Axes()->get_HorizontalAxis();
    horizontalAxis->get_TextFormat()->get_PortionFormat()->set_FontHeight(12.0);
    horizontalAxis->get_Format()->get_Line()->get_FillFormat()->set_FillType(FillType::NoFill);

    SetAxisTitle(horizontalAxis, u"X Axis");

    // ตั้งแกนตั้ง.
    auto verticalAxis = chart->get_Axes()->get_VerticalAxis();
    verticalAxis->get_TextFormat()->get_PortionFormat()->set_FontHeight(12.0);
    verticalAxis->get_Format()->get_Line()->get_FillFormat()->set_FillType(FillType::NoFill);

    SetAxisTitle(verticalAxis, u"Y Axis 1");

    // ตั้งค่าสีของเส้นกริดหลักแนวตั้ง.
    auto majorGridLinesFormat = verticalAxis->get_MajorGridLinesFormat()->get_Line()->get_FillFormat();
    majorGridLinesFormat->set_FillType(FillType::Solid);
    majorGridLinesFormat->get_SolidFillColor()->set_Color(Color::FromArgb(217, 217, 217));
}

static void SetSecondaryAxesFormat(SharedPtr<IChart> chart)
{
    // ตั้งแกนนอนรอง.
    auto secondaryHorizontalAxis = chart->get_Axes()->get_SecondaryHorizontalAxis();
    secondaryHorizontalAxis->set_Position(AxisPositionType::Bottom);
    secondaryHorizontalAxis->set_CrossType(CrossesType::Maximum);
    secondaryHorizontalAxis->set_IsVisible(false);
    secondaryHorizontalAxis->get_MajorGridLinesFormat()->get_Line()->get_FillFormat()->set_FillType(FillType::NoFill);
    secondaryHorizontalAxis->get_MinorGridLinesFormat()->get_Line()->get_FillFormat()->set_FillType(FillType::NoFill);

    // ตั้งแกนตั้งรอง.
    auto secondaryVerticalAxis = chart->get_Axes()->get_SecondaryVerticalAxis();
    secondaryVerticalAxis->set_Position(AxisPositionType::Right);
    secondaryVerticalAxis->get_TextFormat()->get_PortionFormat()->set_FontHeight(12.0);
    secondaryVerticalAxis->get_Format()->get_Line()->get_FillFormat()->set_FillType(FillType::NoFill);
    secondaryVerticalAxis->get_MajorGridLinesFormat()->get_Line()->get_FillFormat()->set_FillType(FillType::NoFill);
    secondaryVerticalAxis->get_MinorGridLinesFormat()->get_Line()->get_FillFormat()->set_FillType(FillType::NoFill);

    SetAxisTitle(secondaryVerticalAxis, u"Y Axis 2");
}

static void CreateComboChart()
{
    auto presentation = MakeObject<Presentation>();
    auto slide = presentation->get_Slide(0);

    auto chart = CreateChartWithFirstSeries(slide);

    AddSecondSeriesToChart(chart);
    AddThirdSeriesToChart(chart);

    SetPrimaryAxesFormat(chart);
    SetSecondaryAxesFormat(chart);

    presentation->Save(u"combo-chart.pptx", SaveFormat::Pptx);
    presentation->Dispose();
}
อัปเดตแผนภูมิ
- สร้างอ็อบเจ็กต์ Presentation ที่เป็นตัวแทนของงานนำเสนอที่มีแผนภูมิ
- รับอ้างอิงสไลด์ผ่านดัชนีของมัน
- ท่องผ่านรูปทรงทั้งหมดเพื่อค้นหาแผนภูมิที่ต้องการ
- เข้าถึง worksheet ของข้อมูลแผนภูมิ
- แก้ไขข้อมูลซีรีส์ของแผนภูมิโดยเปลี่ยนค่าในซีรีส์
- เพิ่มซีรีส์ใหม่และเติมข้อมูลลงในนั้น
- บันทึกการนำเสนอที่แก้ไขเป็นไฟล์ PPTX
โค้ด C++ นี้แสดงวิธีอัปเดตแผนภูมิ:
#include <DOM/Chart/ChartType.h>
#include <DOM/Chart/IChartData.h>
#include <DOM/Chart/IChartDataPoint.h>
#include <DOM/Chart/IChartDataPointCollection.h>
#include <DOM/Chart/IChartDataWorkbook.h>
#include <DOM/Chart/IChartSeries.h>
#include <DOM/Chart/IChartSeriesCollection.h>
#include <DOM/Chart/IDoubleChartValue.h>
#include <DOM/IChart.h>
#include <DOM/IShapeCollection.h>
#include <DOM/ISlide.h>
#include <DOM/ISlideCollection.h>
#include <DOM/Presentation.h>
#include <Export/SaveFormat.h>
using namespace Aspose::Slides;
using namespace Aspose::Slides::Charts;

// สร้างอินสแตนซ์ของคลาส Presentation ที่เป็นไฟล์ PPTX
System::SharedPtr<Presentation> pres = System::MakeObject<Presentation>(u"ExistingChart.pptx");

// เข้าถึงสไลด์แรก
System::SharedPtr<ISlide> sld = pres->get_Slides()->idx_get(0);

// เพิ่มแผนภูมิกับข้อมูลเริ่มต้น
System::SharedPtr<IChart> chart = System::ExplicitCast<Aspose::Slides::Charts::IChart>(sld->get_Shapes()->idx_get(0));

// ตั้งดัชนีสำหรับแผ่นข้อมูลแผนภูมิ
int32_t defaultWorksheetIndex = 0;

// รับ worksheet ของข้อมูลแผนภูมิ
System::SharedPtr<IChartDataWorkbook> fact = chart->get_ChartData()->get_ChartDataWorkbook();


// เปลี่ยนชื่อหมวดหมู่ของแผนภูมิ
fact->GetCell(defaultWorksheetIndex, 1, 0, System::ObjectExt::Box<System::String>(u"Modified Category 1"));
fact->GetCell(defaultWorksheetIndex, 2, 0, System::ObjectExt::Box<System::String>(u"Modified Category 2"));

// ดึงซีรีส์แผนภูมิลำดับแรก
System::SharedPtr<IChartSeries> series = chart->get_ChartData()->get_Series()->idx_get(0);

// ปรับปรุงข้อมูลของซีรีส์
fact->GetCell(defaultWorksheetIndex, 0, 1, System::ObjectExt::Box<System::String>(u"New_Series1"));
// แก้ไขชื่อซีรีส์
series->get_DataPoints()->idx_get(0)->get_Value()->set_Data(System::ObjectExt::Box<int32_t>(90));
series->get_DataPoints()->idx_get(1)->get_Value()->set_Data(System::ObjectExt::Box<int32_t>(123));
series->get_DataPoints()->idx_get(2)->get_Value()->set_Data(System::ObjectExt::Box<int32_t>(44));

// ดึงซีรีส์แผนภูมิลำดับที่สอง
series = chart->get_ChartData()->get_Series()->idx_get(1);

// กำลังอัปเดตข้อมูลของซีรีส์
fact->GetCell(defaultWorksheetIndex, 0, 2, System::ObjectExt::Box<System::String>(u"New_Series2"));
// แก้ไขชื่อซีรีส์
series->get_DataPoints()->idx_get(0)->get_Value()->set_Data(System::ObjectExt::Box<int32_t>(23));
series->get_DataPoints()->idx_get(1)->get_Value()->set_Data(System::ObjectExt::Box<int32_t>(67));
series->get_DataPoints()->idx_get(2)->get_Value()->set_Data(System::ObjectExt::Box<int32_t>(99));


// ตอนนี้กำลังเพิ่มซีรีส์ใหม่
chart->get_ChartData()->get_Series()->Add(fact->GetCell(defaultWorksheetIndex, 0, 3, System::ObjectExt::Box<System::String>(u"Series 3")), chart->get_Type());

// ดึงซีรีส์แผนภูมอลำดับที่สาม
series = chart->get_ChartData()->get_Series()->idx_get(2);

// กำลังเติมข้อมูลให้ซีรีส์
series->get_DataPoints()->AddDataPointForBarSeries(fact->GetCell(defaultWorksheetIndex, 1, 3, System::ObjectExt::Box<int32_t>(20)));
series->get_DataPoints()->AddDataPointForBarSeries(fact->GetCell(defaultWorksheetIndex, 2, 3, System::ObjectExt::Box<int32_t>(50)));
series->get_DataPoints()->AddDataPointForBarSeries(fact->GetCell(defaultWorksheetIndex, 3, 3, System::ObjectExt::Box<int32_t>(30)));

chart->set_Type(Aspose::Slides::Charts::ChartType::ClusteredCylinder);

// บันทึกงานนำเสนอพร้อมแผนภูมิ
pres->Save(u"AsposeChartModified_out.pptx", Aspose::Slides::Export::SaveFormat::Pptx);
กำหนดช่วงข้อมูลสำหรับแผนภูมิ
- เปิดอินสแตนซ์ของคลาส Presentation ที่มีแผนภูมิอยู่
- รับอ้างอิงสไลด์ผ่านดัชนีของมัน
- ท่องผ่านรูปทรงทั้งหมดเพื่อค้นหาแผนภูมิที่ต้องการ
- เข้าถึงข้อมูลแผนภูมิและตั้งค่าช่วงข้อมูล
- บันทึกการนำเสนอที่แก้ไขเป็นไฟล์ PPTX
โค้ด C++ นี้แสดงวิธีกำหนดช่วงข้อมูลสำหรับแผนภูมิ:
#include <DOM/Chart/IChartData.h>
#include <DOM/IChart.h>
#include <DOM/IShapeCollection.h>
#include <DOM/ISlide.h>
#include <DOM/ISlideCollection.h>
#include <DOM/Presentation.h>
#include <Export/SaveFormat.h>
#include <system/string.h>
using namespace Aspose::Slides;
using namespace Aspose::Slides::Charts;
using namespace Aspose::Slides::Export;
using namespace System;

// เส้นทางไปยังไดเรกทอรีเอกสาร.
String dataDir = u"../documents/";

// สร้างอินสแตนซ์ของคลาส Presentation ที่เป็นไฟล์ PPTX
auto presentation = System::MakeObject<Presentation>(dataDir + u"ExistingChart.pptx");

// เข้าถึงสไลด์แรกและเพิ่มแผนภูมิกับข้อมูลเริ่มต้น
auto slide = presentation->get_Slides()->idx_get(0);
auto chart = System::ExplicitCast<IChart>(slide->get_Shapes()->idx_get(0));
chart->get_ChartData()->SetRange(u"Sheet1!A1:B4");
presentation->Save(dataDir + u"SetDataRange_out.pptx", SaveFormat::Pptx);
ใช้เครื่องหมายเริ่มต้นในแผนภูมิ
เมื่อคุณใช้เครื่องหมายเริ่มต้นในแผนภูมิแต่ละซีรีส์จะได้รับสัญลักษณ์เครื่องหมายเริ่มต้นที่แตกต่างกันโดยอัตโนมัติ
โค้ด C++ นี้แสดงวิธีตั้งค่าเครื่องหมายซีรีส์ของแผนภูมิโดยอัตโนมัติ:
#include <DOM/Chart/ChartType.h>
#include <DOM/Chart/IChartCategoryCollection.h>
#include <DOM/Chart/IChartData.h>
#include <DOM/Chart/IChartDataPointCollection.h>
#include <DOM/Chart/IChartDataWorkbook.h>
#include <DOM/Chart/IChartSeries.h>
#include <DOM/Chart/IChartSeriesCollection.h>
#include <DOM/Chart/ILegend.h>
#include <DOM/IChart.h>
#include <DOM/IShapeCollection.h>
#include <DOM/ISlide.h>
#include <DOM/ISlideCollection.h>
#include <DOM/Presentation.h>
#include <Export/SaveFormat.h>
#include <system/object_ext.h>
#include <system/string.h>
using namespace Aspose::Slides;
using namespace Aspose::Slides::Charts;
using namespace Aspose::Slides::Export;
using namespace System;

// เส้นทางไปยังไดเรกทอรีเอกสาร.
String dataDir = u"../documents/";

auto pres = System::MakeObject<Presentation>();

auto slide = pres->get_Slides()->idx_get(0);
auto chart = slide->get_Shapes()->AddChart(ChartType::LineWithMarkers, 10.0f, 10.0f, 400.0f, 400.0f);

chart->get_ChartData()->get_Series()->Clear();
chart->get_ChartData()->get_Categories()->Clear();

auto wb = chart->get_ChartData()->get_ChartDataWorkbook();
chart->get_ChartData()->get_Series()->Add(wb->GetCell(0, 0, 1, ObjectExt::Box<String>(u"Series 1")), chart->get_Type());
auto series = chart->get_ChartData()->get_Series()->idx_get(0);

chart->get_ChartData()->get_Categories()->Add(wb->GetCell(0, 1, 0, ObjectExt::Box<String>(u"C1")));
series->get_DataPoints()->AddDataPointForLineSeries(wb->GetCell(0, 1, 1, ObjectExt::Box<int32_t>(24)));
chart->get_ChartData()->get_Categories()->Add(wb->GetCell(0, 2, 0, ObjectExt::Box<String>(u"C2")));
series->get_DataPoints()->AddDataPointForLineSeries(wb->GetCell(0, 2, 1, ObjectExt::Box<int32_t>(23)));
chart->get_ChartData()->get_Categories()->Add(wb->GetCell(0, 3, 0, ObjectExt::Box<String>(u"C3")));
series->get_DataPoints()->AddDataPointForLineSeries(wb->GetCell(0, 3, 1, ObjectExt::Box<int32_t>(-10)));
chart->get_ChartData()->get_Categories()->Add(wb->GetCell(0, 4, 0, ObjectExt::Box<String>(u"C4")));
series->get_DataPoints()->AddDataPointForLineSeries(wb->GetCell(0, 4, 1, nullptr));

chart->get_ChartData()->get_Series()->Add(wb->GetCell(0, 0, 2, ObjectExt::Box<String>(u"Series 2")), chart->get_Type());

// ดึงซีรีส์แผนภูมิที่สอง
auto series2 = chart->get_ChartData()->get_Series()->idx_get(1);

// เติมข้อมูลให้ซีรีส์
series2->get_DataPoints()->AddDataPointForLineSeries(wb->GetCell(0, 1, 2, ObjectExt::Box<int32_t>(30)));
series2->get_DataPoints()->AddDataPointForLineSeries(wb->GetCell(0, 2, 2, ObjectExt::Box<int32_t>(10)));
series2->get_DataPoints()->AddDataPointForLineSeries(wb->GetCell(0, 3, 2, ObjectExt::Box<int32_t>(60)));
series2->get_DataPoints()->AddDataPointForLineSeries(wb->GetCell(0, 4, 2, ObjectExt::Box<int32_t>(40)));

chart->set_HasLegend(true);
chart->get_Legend()->set_Overlay(false);

pres->Save(dataDir + u"DefaultMarkersInChart.pptx", SaveFormat::Pptx);
คำถามที่พบบ่อย
แผนภูมิประเภทใดบ้างที่ Aspose.Slides รองรับ?
Aspose.Slides รองรับแผนภูมิมากมาย รวมถึงบาร์, เส้น, วงกลม, พื้นที่, กระจาย, histogram, radar และอื่น ๆ อีกหลายประเภท ความยืดหยุ่นนี้ทำให้คุณเลือกประเภทแผนภูมิที่เหมาะสมกับการแสดงผลข้อมูลของคุณได้
ฉันจะเพิ่มแผนภูมิใหม่ลงในสไลด์อย่างไร?
เพื่อเพิ่มแผนภูมิ คุณต้องสร้างอินสแตนซ์ของคลาส Presentation แล้วเรียกดูสไลด์ที่ต้องการโดยใช้ดัชนี จากนั้นเรียกเมธอดเพื่อเพิ่มแผนภูมิ พร้อมระบุประเภทแผนภูมิและข้อมูลเริ่มต้น กระบวนการนี้จะทำให้แผนภูมิเชื่อมต่อโดยตรงกับงานนำเสนอของคุณ
ฉันจะอัปเดตข้อมูลที่แสดงในแผนภูมิได้อย่างไร?
คุณสามารถอัปเดตข้อมูลของแผนภูมิได้โดยเข้าถึง workbook ของข้อมูล (IChartDataWorkbook), ลบซีรีส์และหมวดหมู่เริ่มต้นที่มีอยู่, แล้วเพิ่มข้อมูลของคุณเอง วิธีนี้ช่วยให้คุณรีเฟรชแผนภูมิโปรแกรมเมติกให้แสดงข้อมูลล่าสุดได้
สามารถปรับแต่งรูปลักษณ์ของแผนภูมิได้หรือไม่?
ได้, Aspose.Slides มีตัวเลือกการปรับแต่งอย่างกว้างขวาง คุณสามารถแก้ไขสี, ฟอนต์, ป้ายกำกับ, คำอธิบายและองค์ประกอบการจัดรูปแบบอื่น ๆ เพื่อให้แผนภูมิตรงกับความต้องการออกแบบของคุณอย่างเฉพาะเจาะจง