
ایجاد یا بهروزرسانی نمودارهای ارائه پاورپوینت در C++
بررسی کلی
این مقاله راهنمای جامع ایجاد و سفارشیسازی نمودارها با Aspose.Slides را ارائه میدهد. شما خواهید آموخت چگونه برنامهنویسی یک نمودار را به اسلاید اضافه کنید، آن را با دادهها پر کنید و گزینههای قالببندی مختلف را برای مطابقت با نیازهای طراحی خاص خود اعمال کنید. در طول مقاله، مثالهای کد تفصیلی هر گام را نشان میدهند، از مقداردهی اولیه ارائه و شی نمودار تا پیکربندی سطرها، محورها و لگندها. با پیروی از این راهنما، درک محکمی از نحوه یکپارچهسازی تولید دینامیک نمودار در برنامههای خود به دست میآورید و فرآیند ایجاد ارائههای مبتنی بر داده را ساده میکنید.
ایجاد نمودار
نمودارها به افراد کمک میکنند تا دادهها را بهسرعت بهصورت تصویری درک کنند و بینشهایی بهدست آورند که شاید از یک جدول یا صفحهگسترده بهوضوح ظاهر نشوند.
چرا نمودارها ایجاد کنیم؟
استفاده از نمودارها به شما این امکان را میدهد که
- مقادیر زیاد داده را بهصورت خلاصه در یک اسلاید ارائه کنید
- الگوها و روندهای داده را آشکار کنید
- جهت و شتاب دادهها را در طول زمان یا نسبت به یک واحد اندازهگیری خاص استنتاج کنید
- ناهنجاریها، انحرافها، خطاها، دادههای بیمعنی و غیره را شناسایی کنید
- دادههای پیچیده را بهصورت مؤثر ارتباط یا ارائه دهید
در PowerPoint میتوانید از طریق تابع Insert نمودارها را ایجاد کنید؛ این تابع قالبهای متنوعی برای طراحی انواع نمودارها فراهم میکند. با Aspose.Slides میتوانید نمودارهای استاندارد (بر پایه انواع رایج نمودار) و نمودارهای سفارشی ایجاد کنید.
ایجاد نمودارهای عادی
- یک نمونه از کلاس Presentation ایجاد کنید.
- مرجع اسلاید را از طریق اندیس آن دریافت کنید.
- یک نمودار با برخی دادهها اضافه کنید و نوع نمودار دلخواه خود را مشخص کنید.
- عنوانی برای نمودار اضافه کنید.
- به ورکشیت دادههای نمودار دسترسی پیدا کنید.
- تمام سطرها و دستههای پیشفرض را پاک کنید.
- سطرها و دستههای جدید اضافه کنید.
- دادههای جدید برای سطرهای نمودار اضافه کنید.
- رنگ پر برای سطرهای نمودار تعیین کنید.
- برچسبها برای سطرهای نمودار اضافه کنید.
- ارائه اصلاحشده را بهصورت فایل PPTX ذخیره کنید.
این کد C++ نشان میدهد چگونه یک نمودار عادی ایجاد کنید:
#include <DOM/Chart/ChartType.h>
#include <DOM/Chart/IChartCategoryCollection.h>
#include <DOM/Chart/IChartData.h>
#include <DOM/Chart/IChartDataPoint.h>
#include <DOM/Chart/IChartDataPointCollection.h>
#include <DOM/Chart/IChartDataWorkbook.h>
#include <DOM/Chart/IChartSeries.h>
#include <DOM/Chart/IChartSeriesCollection.h>
#include <DOM/Chart/IChartTitle.h>
#include <DOM/Chart/IDataLabel.h>
#include <DOM/Chart/IDataLabelFormat.h>
#include <DOM/Chart/IFormat.h>
#include <DOM/FillType.h>
#include <DOM/IChart.h>
#include <DOM/IColorFormat.h>
#include <DOM/IFillFormat.h>
#include <DOM/IShapeCollection.h>
#include <DOM/ISlide.h>
#include <DOM/ISlideCollection.h>
#include <DOM/ITextFrame.h>
#include <DOM/ITextFrameFormat.h>
#include <DOM/NullableBool.h>
#include <DOM/Presentation.h>
#include <Export/SaveFormat.h>
#include <drawing/color.h>
#include <system/string.h>
using namespace Aspose::Slides;
using namespace Aspose::Slides::Charts;
using namespace Aspose::Slides::Export;
using namespace System;
using namespace System::Drawing;
// مسیر پوشهٔ اسناد.
const String outPath = u"../out/NormalCharts_out.pptx";
//یک نمونه از کلاس ارائه ایجاد میکند که فایل PPTX را نمایندگی میکند
SharedPtr<Presentation> pres = MakeObject<Presentation>();
//به اولین اسلاید دسترسی مییابد
SharedPtr<ISlide> slide = pres->get_Slides()->idx_get(0);
// Adds a chart with default data
SharedPtr<IChart> chart = slide->get_Shapes()->AddChart(Aspose::Slides::Charts::ChartType::ClusteredColumn, 0, 0, 500, 500);
// Sets the index of chart data sheet
int defaultWorksheetIndex = 0;
// Gets the chart data worksheet
SharedPtr<IChartDataWorkbook> fact = chart->get_ChartData()->get_ChartDataWorkbook();
// Sets the chart Title
chart->get_ChartTitle()->AddTextFrameForOverriding(u"Sample Title");
chart->get_ChartTitle()->get_TextFrameForOverriding()->get_TextFrameFormat()->set_CenterText ( NullableBool::True);
chart->get_ChartTitle()->set_Height(20);
chart->set_HasTitle( true);
// Deletes the default generated series and categories
chart->get_ChartData()->get_Series()->Clear();
chart->get_ChartData()->get_Categories()->Clear();
int s = chart->get_ChartData()->get_Series()->get_Count();
s = chart->get_ChartData()->get_Categories()->get_Count();
// Adds a new series
chart->get_ChartData()->get_Series()->Add(fact->GetCell(defaultWorksheetIndex, 0, 1, ObjectExt::Box<System::String>(u"Series 1")), chart->get_Type());
chart->get_ChartData()->get_Series()->Add(fact->GetCell(defaultWorksheetIndex, 0, 2, ObjectExt::Box<System::String>(u"Series 2")), chart->get_Type());
// Adds catrgories
chart->get_ChartData()->get_Categories()->Add(fact->GetCell(defaultWorksheetIndex, 1, 0, ObjectExt::Box<System::String>(u"Caetegoty 1")));
chart->get_ChartData()->get_Categories()->Add(fact->GetCell(defaultWorksheetIndex, 2, 0, ObjectExt::Box<System::String>(u"Caetegoty 2")));
chart->get_ChartData()->get_Categories()->Add(fact->GetCell(defaultWorksheetIndex, 3, 0, ObjectExt::Box<System::String>(u"Caetegoty 3")));
// Takes the first chart series
SharedPtr<IChartSeries> series = chart->get_ChartData()->get_Series()->idx_get(0);
// Populates the series data
series->get_DataPoints()->AddDataPointForBarSeries(fact->GetCell(defaultWorksheetIndex, 1, 1, ObjectExt::Box<double>(20)));
series->get_DataPoints()->AddDataPointForBarSeries(fact->GetCell(defaultWorksheetIndex, 2, 1, ObjectExt::Box<double>(50)));
series->get_DataPoints()->AddDataPointForBarSeries(fact->GetCell(defaultWorksheetIndex, 3, 1, ObjectExt::Box<double>(30)));
// Sets the fill color for series
series->get_Format()->get_Fill()->set_FillType(FillType::Solid);
series->get_Format()->get_Fill()->get_SolidFillColor()->set_Color(System::Drawing::Color::get_Red());
// Takes the second chart series
series = chart->get_ChartData()->get_Series()->idx_get(1);
// Populates the series data
series->get_DataPoints()->AddDataPointForBarSeries(fact->GetCell(defaultWorksheetIndex, 1, 2, ObjectExt::Box<double>(30)));
series->get_DataPoints()->AddDataPointForBarSeries(fact->GetCell(defaultWorksheetIndex, 2, 2, ObjectExt::Box<double>(10)));
series->get_DataPoints()->AddDataPointForBarSeries(fact->GetCell(defaultWorksheetIndex, 3, 2, ObjectExt::Box<double>(60)));
// Sets the fill color for series
series->get_Format()->get_Fill()->set_FillType(FillType::Solid);
series->get_Format()->get_Fill()->get_SolidFillColor()->set_Color(System::Drawing::Color::get_Green());
// First label is set to show category name
SharedPtr<IDataLabel> lbl = series->get_DataPoints()->idx_get(0)->get_Label();
lbl->get_DataLabelFormat()->set_ShowCategoryName(true);
lbl = series->get_DataPoints()->idx_get(1)->get_Label();
lbl->get_DataLabelFormat()->set_ShowSeriesName (true);
// Shows the value for third label
lbl = series->get_DataPoints()->idx_get(2)->get_Label();
lbl->get_DataLabelFormat()->set_ShowValue (true);
lbl->get_DataLabelFormat()->set_ShowSeriesName(true);
lbl->get_DataLabelFormat()->set_Separator (u"/");
// Saves the presentation
pres->Save(outPath, Aspose::Slides::Export::SaveFormat::Pptx);
ایجاد نمودارهای پراکنده
نمودارهای پراکنده (که بهعنوان scatter plots یا نمودارهای x‑y نیز شناخته میشوند) اغلب برای بررسی الگوها یا نشان دادن همبستگی بین دو متغیر استفاده میشوند.
ممکن است بخواهید از نمودار پراکنده استفاده کنید وقتی
- دادههای عددی جفتی دارید
- دو متغیری دارید که بهخوبی با هم جفت میشوند
- میخواهید تعیین کنید آیا دو متغیر مرتبط هستند یا نه
- یک متغیر مستقل دارید که برای متغیر وابسته مقادیر متعددی دارد
این کد C++ نشان میدهد چگونه یک نمودار پراکنده با مجموعهای متفاوت از نشانگرها ایجاد کنید:
#include <DOM/Chart/ChartType.h>
#include <DOM/Chart/IChartData.h>
#include <DOM/Chart/IChartDataPoint.h>
#include <DOM/Chart/IChartDataPointCollection.h>
#include <DOM/Chart/IChartDataWorkbook.h>
#include <DOM/Chart/IChartSeries.h>
#include <DOM/Chart/IChartSeriesCollection.h>
#include <DOM/Chart/IChartSeriesGroup.h>
#include <DOM/Chart/IChartSeriesGroupCollection.h>
#include <DOM/Chart/IChartTitle.h>
#include <DOM/Chart/IDataLabel.h>
#include <DOM/Chart/IDataLabelCollection.h>
#include <DOM/Chart/IDataLabelFormat.h>
#include <DOM/Chart/IFormat.h>
#include <DOM/Chart/IMarker.h>
#include <DOM/Chart/MarkerStyleType.h>
#include <DOM/FillType.h>
#include <DOM/IChart.h>
#include <DOM/IColorFormat.h>
#include <DOM/IFillFormat.h>
#include <DOM/ILineFillFormat.h>
#include <DOM/ILineFormat.h>
#include <DOM/IShapeCollection.h>
#include <DOM/ISlide.h>
#include <DOM/ISlideCollection.h>
#include <DOM/ITextFrame.h>
#include <DOM/ITextFrameFormat.h>
#include <DOM/LineDashStyle.h>
#include <DOM/LineStyle.h>
#include <DOM/NullableBool.h>
#include <DOM/Presentation.h>
#include <Export/SaveFormat.h>
#include <drawing/color.h>
#include <system/string.h>
using namespace Aspose::Slides;
using namespace Aspose::Slides::Charts;
using namespace System;
// مسیر پوشهٔ اسناد.
const String outPath = u"../out/ScatteredChart_out.pptx";
//یک نمونه از کلاس ارائه ایجاد میکند که فایل PPTX را نمایندگی میکند
SharedPtr<Presentation> pres = MakeObject<Presentation>();
//به اولین اسلاید دسترسی مییابد
SharedPtr<ISlide> slide = pres->get_Slides()->idx_get(0);
// یک نمودار با دادههای پیشفرض اضافه میکند
SharedPtr<IChart> chart = slide->get_Shapes()->AddChart(Aspose::Slides::Charts::ChartType::ScatterWithSmoothLines, 0, 0, 500, 500);
// عنوان نمودار را تنظیم میکند
chart->get_ChartTitle()->AddTextFrameForOverriding(u"Sample Title");
chart->get_ChartTitle()->get_TextFrameForOverriding()->get_TextFrameFormat()->set_CenterText(NullableBool::True);
chart->get_ChartTitle()->set_Height(20);
chart->set_HasTitle(true);
// سطرهای پیشفرض تولیدشده را حذف میکند
chart->get_ChartData()->get_Series()->Clear();
// اندیس صفحه دادهٔ نمودار را تنظیم میکند
int defaultWorksheetIndex = 0;
// ورکشیٹ دادهٔ نمودار را دریافت میکند
SharedPtr<IChartDataWorkbook> fact = chart->get_ChartData()->get_ChartDataWorkbook();
// یک سطر جدید اضافه میکند
chart->get_ChartData()->get_Series()->Add(fact->GetCell(defaultWorksheetIndex, 1, 1, ObjectExt::Box<System::String>(u"Series 1")), chart->get_Type());
chart->get_ChartData()->get_Series()->Add(fact->GetCell(defaultWorksheetIndex, 1, 3, ObjectExt::Box<System::String>(u"Series 2")), chart->get_Type());
// سطر اول نمودار را میگیرد
SharedPtr<IChartSeries> series = chart->get_ChartData()->get_Series()->idx_get(0);
// یک نقطه جدید اضافه میکند (1:3)
series->get_DataPoints()->AddDataPointForScatterSeries(fact->GetCell(defaultWorksheetIndex, 2, 1, ObjectExt::Box<double>(1)), fact->GetCell(defaultWorksheetIndex, 2, 2, ObjectExt::Box<double>(3)));
// یک نقطه جدید اضافه میکند (2:10)
series->get_DataPoints()->AddDataPointForScatterSeries(fact->GetCell(defaultWorksheetIndex, 3, 1, ObjectExt::Box<double>(2)), fact->GetCell(defaultWorksheetIndex, 3, 2, ObjectExt::Box<double>(10)));
// نوع سطر را ویرایش میکند
series->set_Type (ChartType::ScatterWithStraightLinesAndMarkers);
// نشانگر سطر نمودار را تغییر میدهد
series->get_Marker()->set_Size (10);
series->get_Marker()->set_Symbol(MarkerStyleType::Star);
// سطر دوم نمودار را میگیرد
series = chart->get_ChartData()->get_Series()->idx_get(1);
// یک نقطه جدید اضافه میکند (5:2)
series->get_DataPoints()->AddDataPointForScatterSeries(fact->GetCell(defaultWorksheetIndex, 2, 3, ObjectExt::Box<double>(5)), fact->GetCell(defaultWorksheetIndex, 2, 4, ObjectExt::Box<double>(2)));
// یک نقطه جدید اضافه میکند (3:1)
series->get_DataPoints()->AddDataPointForScatterSeries(fact->GetCell(defaultWorksheetIndex, 3, 3, ObjectExt::Box<double>(3)), fact->GetCell(defaultWorksheetIndex, 3, 4, ObjectExt::Box<double>(1)));
// یک نقطه جدید اضافه میکند (2:2)
series->get_DataPoints()->AddDataPointForScatterSeries(fact->GetCell(defaultWorksheetIndex, 4, 3, ObjectExt::Box<double>(2)), fact->GetCell(defaultWorksheetIndex, 4, 4, ObjectExt::Box<double>(2)));
// یک نقطه جدید اضافه میکند (5:1)
series->get_DataPoints()->AddDataPointForScatterSeries(fact->GetCell(defaultWorksheetIndex, 5, 3, ObjectExt::Box<double>(5)), fact->GetCell(defaultWorksheetIndex, 5, 4, ObjectExt::Box<double>(1)));
// نشانگر سطر نمودار را تغییر میدهد
series->get_Marker()->set_Size ( 10);
series->get_Marker()->set_Symbol(MarkerStyleType::Circle);
chart->get_ChartData()->get_SeriesGroups()->idx_get(0)->set_IsColorVaried(true);
SharedPtr<IChartDataPoint> point = series->get_DataPoints()->idx_get(0);
point->get_Format()->get_Fill()->set_FillType(FillType::Solid);
point->get_Format()->get_Fill()->get_SolidFillColor()->set_Color(System::Drawing::Color::get_Cyan());
// حدود بخش را تنظیم میکند
point->get_Format()->get_Line()->get_FillFormat()->set_FillType(FillType::Solid);
point->get_Format()->get_Line()->get_FillFormat()->get_SolidFillColor()->set_Color(System::Drawing::Color::get_Gray());
point->get_Format()->get_Line()->set_Width ( 3.0);
point->get_Format()->get_Line()->set_Style(LineStyle::ThinThick);
point->get_Format()->get_Line()->set_DashStyle(LineDashStyle::DashDot);
SharedPtr<IChartDataPoint> point1 = series->get_DataPoints()->idx_get(1);
point1->get_Format()->get_Fill()->set_FillType(FillType::Solid);
point1->get_Format()->get_Fill()->get_SolidFillColor()->set_Color(System::Drawing::Color::get_Brown());
// حدود بخش را تنظیم میکند
point1->get_Format()->get_Line()->get_FillFormat()->set_FillType(FillType::Solid);
point1->get_Format()->get_Line()->get_FillFormat()->get_SolidFillColor()->set_Color(System::Drawing::Color::get_Blue());
point1->get_Format()->get_Line()->set_Width (3.0);
point1->get_Format()->get_Line()->set_Style(LineStyle::Single);
point1->get_Format()->get_Line()->set_DashStyle(LineDashStyle::LargeDashDot);
SharedPtr<IChartDataPoint> point2 = series->get_DataPoints()->idx_get(2);
point2->get_Format()->get_Fill()->set_FillType(FillType::Solid);
point2->get_Format()->get_Fill()->get_SolidFillColor()->set_Color(System::Drawing::Color::get_Coral());
// حدود بخش را تنظیم میکند
point2->get_Format()->get_Line()->get_FillFormat()->set_FillType(FillType::Solid);
point2->get_Format()->get_Line()->get_FillFormat()->get_SolidFillColor()->set_Color(System::Drawing::Color::get_Red());
point2->get_Format()->get_Line()->set_Width ( 2.0);
point2->get_Format()->get_Line()->set_Style(LineStyle::ThickThin);
point2->get_Format()->get_Line()->set_DashStyle(LineDashStyle::LargeDashDotDot);
// برچسبهای سفارشی برای هر دسته از سطر جدید ایجاد میکند
SharedPtr<IDataLabel> lbl1 = series->get_DataPoints()->idx_get(0)->get_Label();
// lbl.ShowCategoryName = true;
lbl1->get_DataLabelFormat()->set_ShowValue(true);
SharedPtr<IDataLabel> lbl2 = series->get_DataPoints()->idx_get(1)->get_Label();
lbl2->get_DataLabelFormat()->set_ShowValue(true);
lbl2->get_DataLabelFormat()->set_ShowLegendKey(true);
lbl2->get_DataLabelFormat()->set_ShowPercentage(true);
SharedPtr<IDataLabel> lbl3 = series->get_DataPoints()->idx_get(2)->get_Label();
lbl3->get_DataLabelFormat()->set_ShowSeriesName(true);
lbl3->get_DataLabelFormat()->set_ShowPercentage(true);
// خطوط راهنما برای نمودار را نشان میدهد
series->get_Labels()->get_DefaultDataLabelFormat()->set_ShowLeaderLines(true);
// زاویهٔ چرخش بخشهای نمودار کیک را تنظیم میکند
chart->get_ChartData()->get_SeriesGroups()->idx_get(0)->set_FirstSliceAngle(180);
// ارائه را ذخیره میکند
pres->Save(outPath, Aspose::Slides::Export::SaveFormat::Pptx);
ایجاد نمودارهای کیک
نمودارهای کیک برای نمایش رابطهٔ جزء به کل در دادهها، بهویژه زمانی که دادهها شامل برچسبهای دستهای با مقادیر عددی هستند، بهترین گزینهاند. با این حال، اگر دادههای شما شامل بخشها یا برچسبهای زیادی باشد، ممکن است استفاده از نمودار میلهای را در نظر بگیرید.
- یک نمونه از کلاس Presentation ایجاد کنید.
- مرجع اسلاید را از طریق اندیس آن دریافت کنید.
- یک نمودار با دادههای پیشفرض و نوع دلخواه (در این مثال
ChartType.Pie) اضافه کنید. - به IChartDataWorkbook دسترسی پیدا کنید.
- سطرها و دستههای پیشفرض را پاک کنید.
- سطرها و دستههای جدید اضافه کنید.
- دادههای جدید برای سطرهای نمودار اضافه کنید.
- نقاط جدید برای نمودار اضافه کنید و رنگهای سفارشی برای بخشهای نمودار کیک تعیین کنید.
- برچسبها را برای سطرها تنظیم کنید.
- خطوط راهنما برای برچسبهای سطرها تنظیم کنید.
- زاویهٔ چرخش اسلایدهای نمودار کیک را تنظیم کنید.
- ارائه اصلاحشده را بهصورت فایل PPTX ذخیره کنید.
این کد C++ نشان میدهد چگونه یک نمودار کیک ایجاد کنید:
#include <DOM/Chart/ChartType.h>
#include <DOM/Chart/IChartCategoryCollection.h>
#include <DOM/Chart/IChartData.h>
#include <DOM/Chart/IChartDataPoint.h>
#include <DOM/Chart/IChartDataPointCollection.h>
#include <DOM/Chart/IChartDataWorkbook.h>
#include <DOM/Chart/IChartSeries.h>
#include <DOM/Chart/IChartSeriesCollection.h>
#include <DOM/Chart/IChartSeriesGroup.h>
#include <DOM/Chart/IChartSeriesGroupCollection.h>
#include <DOM/Chart/IChartTitle.h>
#include <DOM/Chart/IDataLabel.h>
#include <DOM/Chart/IDataLabelCollection.h>
#include <DOM/Chart/IDataLabelFormat.h>
#include <DOM/Chart/IFormat.h>
#include <DOM/FillType.h>
#include <DOM/IChart.h>
#include <DOM/IColorFormat.h>
#include <DOM/IFillFormat.h>
#include <DOM/ILineFillFormat.h>
#include <DOM/ILineFormat.h>
#include <DOM/IShapeCollection.h>
#include <DOM/ISlide.h>
#include <DOM/ISlideCollection.h>
#include <DOM/ITextFrame.h>
#include <DOM/ITextFrameFormat.h>
#include <DOM/LineDashStyle.h>
#include <DOM/LineStyle.h>
#include <DOM/NullableBool.h>
#include <DOM/Presentation.h>
#include <Export/SaveFormat.h>
#include <drawing/color.h>
#include <system/string.h>
using namespace Aspose::Slides;
using namespace Aspose::Slides::Charts;
using namespace System;
// مسیر پوشهٔ اسناد.
const String outPath = u"../out/PieChart_out.pptx";
// یک شیء از کلاس Presentation ایجاد میکند که فایل PPTX را نمایندگی میکند
SharedPtr<Presentation> pres = MakeObject<Presentation>();
// به اولین اسلاید دسترسی مییابد
SharedPtr<ISlide> slide = pres->get_Slides()->idx_get(0);
// یک نمودار با دادههای پیشفرض اضافه میکند
SharedPtr<IChart> chart = slide->get_Shapes()->AddChart(Aspose::Slides::Charts::ChartType::Pie, 0, 0, 500, 500);
// عنوان نمودار را تنظیم میکند
chart->get_ChartTitle()->AddTextFrameForOverriding(u"Sample Title");
chart->get_ChartTitle()->get_TextFrameForOverriding()->get_TextFrameFormat()->set_CenterText(NullableBool::True);
chart->get_ChartTitle()->set_Height(20);
chart->set_HasTitle(true);
// سطرها و دستههای پیشفرض تولیدشده را حذف میکند
chart->get_ChartData()->get_Series()->Clear();
chart->get_ChartData()->get_Categories()->Clear();
// اندیس صفحه دادهٔ نمودار را تنظیم میکند
int defaultWorksheetIndex = 0;
// ورکشیت دادهٔ نمودار را دریافت میکند
SharedPtr<IChartDataWorkbook> fact = chart->get_ChartData()->get_ChartDataWorkbook();
// دستهها را اضافه میکند
chart->get_ChartData()->get_Categories()->Add(fact->GetCell(defaultWorksheetIndex, 1, 0, ObjectExt::Box<System::String>(u"First Qtr")));
chart->get_ChartData()->get_Categories()->Add(fact->GetCell(defaultWorksheetIndex, 2, 0, ObjectExt::Box<System::String>(u"2nd Qtr")));
chart->get_ChartData()->get_Categories()->Add(fact->GetCell(defaultWorksheetIndex, 3, 0, ObjectExt::Box<System::String>(u"3ed Qtr")));
// یک سطر جدید اضافه میکند
chart->get_ChartData()->get_Series()->Add(fact->GetCell(defaultWorksheetIndex, 0, 1, ObjectExt::Box<System::String>(u"Series 1")), chart->get_Type());
// سطر اول نمودار را میگیرد
SharedPtr<IChartSeries> series = chart->get_ChartData()->get_Series()->idx_get(0);
// دادههای سطر را پر میکند
series->get_DataPoints()->AddDataPointForPieSeries(fact->GetCell(defaultWorksheetIndex, 1, 1, ObjectExt::Box<double>(20)));
series->get_DataPoints()->AddDataPointForPieSeries(fact->GetCell(defaultWorksheetIndex, 2, 1, ObjectExt::Box<double>(50)));
series->get_DataPoints()->AddDataPointForPieSeries(fact->GetCell(defaultWorksheetIndex, 3, 1, ObjectExt::Box<double>(30)));
chart->get_ChartData()->get_SeriesGroups()->idx_get(0)->set_IsColorVaried(true);
SharedPtr<IChartDataPoint> point = series->get_DataPoints()->idx_get(0);
point->get_Format()->get_Fill()->set_FillType(FillType::Solid);
point->get_Format()->get_Fill()->get_SolidFillColor()->set_Color(System::Drawing::Color::get_Cyan());
// حدود بخش را تنظیم میکند
point->get_Format()->get_Line()->get_FillFormat()->set_FillType(FillType::Solid);
point->get_Format()->get_Line()->get_FillFormat()->get_SolidFillColor()->set_Color(System::Drawing::Color::get_Gray());
point->get_Format()->get_Line()->set_Width ( 3.0);
point->get_Format()->get_Line()->set_Style( LineStyle::ThinThick);
point->get_Format()->get_Line()->set_DashStyle ( LineDashStyle::DashDot);
SharedPtr<IChartDataPoint> point1 = series->get_DataPoints()->idx_get(1);
point1->get_Format()->get_Fill()->set_FillType(FillType::Solid);
point1->get_Format()->get_Fill()->get_SolidFillColor()->set_Color(System::Drawing::Color::get_Brown());
// حدود بخش را تنظیم میکند
point1->get_Format()->get_Line()->get_FillFormat()->set_FillType(FillType::Solid);
point1->get_Format()->get_Line()->get_FillFormat()->get_SolidFillColor()->set_Color(System::Drawing::Color::get_Blue());
point1->get_Format()->get_Line()->set_Width (3.0);
point1->get_Format()->get_Line()->set_Style(LineStyle::Single);
point1->get_Format()->get_Line()->set_DashStyle(LineDashStyle::LargeDashDot);
SharedPtr<IChartDataPoint> point2 = series->get_DataPoints()->idx_get(2);
point2->get_Format()->get_Fill()->set_FillType(FillType::Solid);
point2->get_Format()->get_Fill()->get_SolidFillColor()->set_Color(System::Drawing::Color::get_Coral());
// حدود بخش را تنظیم میکند
point2->get_Format()->get_Line()->get_FillFormat()->set_FillType(FillType::Solid);
point2->get_Format()->get_Line()->get_FillFormat()->get_SolidFillColor()->set_Color(System::Drawing::Color::get_Red());
point2->get_Format()->get_Line()->set_Width (2.0);
point2->get_Format()->get_Line()->set_Style(LineStyle::ThickThin);
point2->get_Format()->get_Line()->set_DashStyle(LineDashStyle::LargeDashDotDot);
// برچسبهای سفارشی برای هر دسته از سطر جدید ایجاد میکند
SharedPtr<IDataLabel> lbl1 = series->get_DataPoints()->idx_get(0)->get_Label();
// lbl.ShowCategoryName = true;
lbl1->get_DataLabelFormat()->set_ShowValue(true);
SharedPtr<IDataLabel> lbl2 = series->get_DataPoints()->idx_get(1)->get_Label();
lbl2->get_DataLabelFormat()->set_ShowValue(true);
lbl2->get_DataLabelFormat()->set_ShowLegendKey(true);
lbl2->get_DataLabelFormat()->set_ShowPercentage(true);
SharedPtr<IDataLabel> lbl3 = series->get_DataPoints()->idx_get(2)->get_Label();
lbl3->get_DataLabelFormat()->set_ShowSeriesName(true);
lbl3->get_DataLabelFormat()->set_ShowPercentage(true);
// سطر را برای نشان دادن خطوط راهنما در نمودار تنظیم میکند
series->get_Labels()->get_DefaultDataLabelFormat()->set_ShowLeaderLines ( true);
// زاویهٔ چرخش بخشهای نمودار کیک را تنظیم میکند
chart->get_ChartData()->get_SeriesGroups()->idx_get(0)->set_FirstSliceAngle ( 180);
// ارائه را ذخیره میکند
pres->Save(outPath, Aspose::Slides::Export::SaveFormat::Pptx);
ایجاد نمودارهای خطی
نمودارهای خطی (که بهعنوان line graphs نیز شناخته میشوند) بهترین گزینه برای موقعیتهایی هستند که میخواهید تغییرات مقدار در طول زمان را نشان دهید. با استفاده از یک نمودار خطی میتوانید دادههای زیادی را همزمان مقایسه کنید، تغییرات و روندها را در طول زمان پیگیری کنید، ناهنجاریها را در سطرهای داده برجسته کنید و غیره.
- یک نمونه از کلاس Presentation ایجاد کنید.
- مرجع اسلاید را از طریق اندیس آن دریافت کنید.
- یک نمودار با دادههای پیشفرض و نوع دلخواه (در این مثال
ChartType::Line) اضافه کنید. - به IChartDataWorkbook دسترسی پیدا کنید.
- سطرها و دستههای پیشفرض را پاک کنید.
- سطرها و دستههای جدید اضافه کنید.
- دادههای جدید برای سطرهای نمودار اضافه کنید.
- ارائه اصلاحشده را بهصورت فایل PPTX ذخیره کنید.
این کد C++ نشان میدهد چگونه یک نمودار خطی ایجاد کنید:
#include <DOM/Chart/ChartType.h>
#include <DOM/IChart.h>
#include <DOM/IShapeCollection.h>
#include <DOM/ISlide.h>
#include <DOM/ISlideCollection.h>
#include <DOM/Presentation.h>
#include <Export/SaveFormat.h>
using namespace Aspose::Slides;
using namespace Aspose::Slides::Charts;
using namespace Aspose::Slides::Export;

auto pres = System::MakeObject<Presentation>();

System::SharedPtr<IChart> lineChart = pres->get_Slides()->idx_get(0)->get_Shapes()->AddChart(ChartType::Line, 10.0f, 50.0f, 600.0f, 350.0f);
pres->Save(u"lineChart.pptx", SaveFormat::Pptx);
بهطور پیشفرض، نقاط یک نمودار خطی توسط خطوط مستقیم و پیوسته بههم متصل میشوند. اگر میخواهید نقاط بهجای خطوط پیوسته توسط خط تیره متصل شوند، میتوانید نوع خط تیرهٔ دلخواه خود را بهاین شکل مشخص کنید:
#include <DOM/Chart/ChartType.h>
#include <DOM/Chart/IChartData.h>
#include <DOM/Chart/IChartSeries.h>
#include <DOM/Chart/IChartSeriesCollection.h>
#include <DOM/Chart/IFormat.h>
#include <DOM/IChart.h>
#include <DOM/ILineFormat.h>
#include <DOM/IShapeCollection.h>
#include <DOM/ISlide.h>
#include <DOM/ISlideCollection.h>
#include <DOM/LineDashStyle.h>
#include <DOM/Presentation.h>
using namespace Aspose::Slides;
using namespace Aspose::Slides::Charts;

auto pres = System::MakeObject<Presentation>();

System::SharedPtr<IChart> lineChart = pres->get_Slides()->idx_get(0)->get_Shapes()->AddChart(ChartType::Line, 10.0f, 50.0f, 600.0f, 350.0f);
for (auto&& series : lineChart->get_ChartData()->get_Series())
{
    series->get_Format()->get_Line()->set_DashStyle(LineDashStyle::Dash);
}
ایجاد نمودارهای درختنقشه
نمودارهای درختنقشه برای دادههای فروش مناسباند زمانی که میخواهید اندازه نسبی دستههای داده را نشان دهید و در عین حال به سرعت توجه را به آیتمهای بزرگسهم هر دسته جلب کنید.
- یک نمونه از کلاس Presentation ایجاد کنید.
- مرجع اسلاید را از طریق اندیس آن دریافت کنید.
- یک نمودار با دادههای پیشفرض و نوع دلخواه (در این مثال
ChartType.TreeMap) اضافه کنید. - به IChartDataWorkbook دسترسی پیدا کنید.
- سطرها و دستههای پیشفرض را پاک کنید.
- سطرها و دستههای جدید اضافه کنید.
- دادههای جدید برای سطرهای نمودار اضافه کنید.
- ارائه اصلاحشده را بهصورت فایل PPTX ذخیره کنید.
این کد C++ نشان میدهد چگونه یک نمودار درختنقشه ایجاد کنید:
#include <DOM/Chart/ChartType.h>
#include <DOM/Chart/IChartCategory.h>
#include <DOM/Chart/IChartCategoryCollection.h>
#include <DOM/Chart/IChartCategoryLevelsManager.h>
#include <DOM/Chart/IChartData.h>
#include <DOM/Chart/IChartDataPointCollection.h>
#include <DOM/Chart/IChartDataWorkbook.h>
#include <DOM/Chart/IChartSeries.h>
#include <DOM/Chart/IChartSeriesCollection.h>
#include <DOM/Chart/IDataLabelCollection.h>
#include <DOM/Chart/IDataLabelFormat.h>
#include <DOM/Chart/ParentLabelLayoutType.h>
#include <DOM/IChart.h>
#include <DOM/IShapeCollection.h>
#include <DOM/ISlide.h>
#include <DOM/ISlideCollection.h>
#include <DOM/Presentation.h>
#include <Export/SaveFormat.h>
#include <system/string.h>
using namespace Aspose::Slides;
using namespace Aspose::Slides::Charts;
using namespace Aspose::Slides::Export;
using namespace System;
// مسیر پوشهٔ اسناد.
const String outPath = u"../out/TreemapChart_out.pptx";
// یک شیء از کلاس Presentation ایجاد میکند که فایل PPTX را نمایندگی میکند
SharedPtr<Presentation> pres = MakeObject<Presentation>();
// به اولین اسلاید دسترسی مییابد
SharedPtr<ISlide> slide = pres->get_Slides()->idx_get(0);
System::SharedPtr<IChart> chart = slide->get_Shapes()->AddChart(Aspose::Slides::Charts::ChartType::Treemap, 50, 50, 500, 400);
chart->get_ChartData()->get_Categories()->Clear();
chart->get_ChartData()->get_Series()->Clear();
System::SharedPtr<IChartDataWorkbook> wb = chart->get_ChartData()->get_ChartDataWorkbook();
wb->Clear(0);
// شاخه 1
System::SharedPtr<IChartCategory> leaf = chart->get_ChartData()->get_Categories()->Add(wb->GetCell(0, u"C1", System::ObjectExt::Box<System::String>(u"Leaf1")));
leaf->get_GroupingLevels()->SetGroupingItem(1, System::ObjectExt::Box<System::String>(u"Stem1"));
leaf->get_GroupingLevels()->SetGroupingItem(2, System::ObjectExt::Box<System::String>(u"Branch1"));
chart->get_ChartData()->get_Categories()->Add(wb->GetCell(0, u"C2", System::ObjectExt::Box<System::String>(u"Leaf2")));
leaf = chart->get_ChartData()->get_Categories()->Add(wb->GetCell(0, u"C3", System::ObjectExt::Box<System::String>(u"Leaf3")));
leaf->get_GroupingLevels()->SetGroupingItem(1, System::ObjectExt::Box<System::String>(u"Stem2"));
chart->get_ChartData()->get_Categories()->Add(wb->GetCell(0, u"C4", System::ObjectExt::Box<System::String>(u"Leaf4")));
// شاخه 2
leaf = chart->get_ChartData()->get_Categories()->Add(wb->GetCell(0, u"C5", System::ObjectExt::Box<System::String>(u"Leaf5")));
leaf->get_GroupingLevels()->SetGroupingItem(1, System::ObjectExt::Box<System::String>(u"Stem3"));
leaf->get_GroupingLevels()->SetGroupingItem(2, System::ObjectExt::Box<System::String>(u"Branch2"));
chart->get_ChartData()->get_Categories()->Add(wb->GetCell(0, u"C6", System::ObjectExt::Box<System::String>(u"Leaf6")));
leaf = chart->get_ChartData()->get_Categories()->Add(wb->GetCell(0, u"C7", System::ObjectExt::Box<System::String>(u"Leaf7")));
leaf->get_GroupingLevels()->SetGroupingItem(1, System::ObjectExt::Box<System::String>(u"Stem4"));
chart->get_ChartData()->get_Categories()->Add(wb->GetCell(0, u"C8", System::ObjectExt::Box<System::String>(u"Leaf8")));
System::SharedPtr<IChartSeries> series = chart->get_ChartData()->get_Series()->Add(Aspose::Slides::Charts::ChartType::Treemap);
series->get_Labels()->get_DefaultDataLabelFormat()->set_ShowCategoryName(true);
series->get_DataPoints()->AddDataPointForTreemapSeries(wb->GetCell(0, u"D1", System::ObjectExt::Box<int32_t>(4)));
series->get_DataPoints()->AddDataPointForTreemapSeries(wb->GetCell(0, u"D2", System::ObjectExt::Box<int32_t>(5)));
series->get_DataPoints()->AddDataPointForTreemapSeries(wb->GetCell(0, u"D3", System::ObjectExt::Box<int32_t>(3)));
series->get_DataPoints()->AddDataPointForTreemapSeries(wb->GetCell(0, u"D4", System::ObjectExt::Box<int32_t>(6)));
series->get_DataPoints()->AddDataPointForTreemapSeries(wb->GetCell(0, u"D5", System::ObjectExt::Box<int32_t>(9)));
series->get_DataPoints()->AddDataPointForTreemapSeries(wb->GetCell(0, u"D6", System::ObjectExt::Box<int32_t>(9)));
series->get_DataPoints()->AddDataPointForTreemapSeries(wb->GetCell(0, u"D7", System::ObjectExt::Box<int32_t>(4)));
series->get_DataPoints()->AddDataPointForTreemapSeries(wb->GetCell(0, u"D8", System::ObjectExt::Box<int32_t>(3)));
series->set_ParentLabelLayout(Aspose::Slides::Charts::ParentLabelLayoutType::Overlapping);
// ارائه را ذخیره میکند
pres->Save(outPath, Aspose::Slides::Export::SaveFormat::Pptx);
ایجاد نمودارهای سهام
- یک نمونه از کلاس Presentation ایجاد کنید.
- مرجع اسلاید را از طریق اندیس آن دریافت کنید.
- یک نمودار با دادههای پیشفرض و نوع دلخواه (
ChartType.OpenHighLowClose) اضافه کنید. - به IChartDataWorkbook دسترسی پیدا کنید.
- سطرها و دستههای پیشفرض را پاک کنید.
- سطرها و دستههای جدید اضافه کنید.
- دادههای جدید برای سطرهای نمودار اضافه کنید.
- قالب خطوط HiLowLines را مشخص کنید.
- ارائه اصلاحشده را بهصورت فایل PPTX ذخیره کنید.
نمونه کد C++ برای ایجاد نمودار سهام:
#include <DOM/Chart/ChartType.h>
#include <DOM/Chart/IChartCategoryCollection.h>
#include <DOM/Chart/IChartData.h>
#include <DOM/Chart/IChartDataPointCollection.h>
#include <DOM/Chart/IChartDataWorkbook.h>
#include <DOM/Chart/IChartLinesFormat.h>
#include <DOM/Chart/IChartSeries.h>
#include <DOM/Chart/IChartSeriesCollection.h>
#include <DOM/Chart/IChartSeriesGroup.h>
#include <DOM/Chart/IChartSeriesGroupCollection.h>
#include <DOM/Chart/IFormat.h>
#include <DOM/Chart/IUpDownBarsManager.h>
#include <DOM/FillType.h>
#include <DOM/IChart.h>
#include <DOM/ILineFillFormat.h>
#include <DOM/ILineFormat.h>
#include <DOM/IShapeCollection.h>
#include <DOM/ISlide.h>
#include <DOM/ISlideCollection.h>
#include <DOM/Presentation.h>
#include <Export/SaveFormat.h>
#include <system/string.h>
using namespace Aspose::Slides;
using namespace Aspose::Slides::Charts;
using namespace Aspose::Slides::Export;
using namespace System;
// مسیر پوشهٔ اسناد.
const String outPath = u"../out/AddStockChart_out.pptx";
// یک شیء از کلاس Presentation ایجاد میکند که فایل PPTX را نمایندگی میکند
SharedPtr<Presentation> pres = MakeObject<Presentation>();
// به اولین اسلاید دسترسی مییابد
SharedPtr<ISlide> slide = pres->get_Slides()->idx_get(0);
// یک نمودار با دادههای پیشفرض اضافه میکند
SharedPtr<IChart> chart = slide->get_Shapes()->AddChart(Aspose::Slides::Charts::ChartType::OpenHighLowClose, 0, 0, 500, 500);
// اندیس صفحه دادهٔ نمودار را تنظیم میکند
int defaultWorksheetIndex = 0;
// ورکشیت دادهٔ نمودار را دریافت میکند
SharedPtr<IChartDataWorkbook> fact = chart->get_ChartData()->get_ChartDataWorkbook();
// سطرها و دستههای پیشفرض تولیدشده را حذف میکند
chart->get_ChartData()->get_Series()->Clear();
chart->get_ChartData()->get_Categories()->Clear();
// دستهها را اضافه میکند
chart->get_ChartData()->get_Categories()->Add(fact->GetCell(defaultWorksheetIndex, 1, 0, ObjectExt::Box<System::String>(u"A")));
chart->get_ChartData()->get_Categories()->Add(fact->GetCell(defaultWorksheetIndex, 2, 0, ObjectExt::Box<System::String>(u"B")));
chart->get_ChartData()->get_Categories()->Add(fact->GetCell(defaultWorksheetIndex, 3, 0, ObjectExt::Box<System::String>(u"C")));
// یک سطر جدید اضافه میکند
chart->get_ChartData()->get_Series()->Add(fact->GetCell(defaultWorksheetIndex, 0, 1, ObjectExt::Box<System::String>(u"Open")), chart->get_Type());
chart->get_ChartData()->get_Series()->Add(fact->GetCell(defaultWorksheetIndex, 0, 2, ObjectExt::Box<System::String>(u"High")), chart->get_Type());
chart->get_ChartData()->get_Series()->Add(fact->GetCell(defaultWorksheetIndex, 0, 3, ObjectExt::Box<System::String>(u"Low")), chart->get_Type());
chart->get_ChartData()->get_Series()->Add(fact->GetCell(defaultWorksheetIndex, 0, 4, ObjectExt::Box<System::String>(u"Close")), chart->get_Type());
// سطر اول نمودار را میگیرد
SharedPtr<IChartSeries> series = chart->get_ChartData()->get_Series()->idx_get(0);
// دادههای سطر اول را پر میکند
series->get_DataPoints()->AddDataPointForStockSeries(fact->GetCell(defaultWorksheetIndex, 1, 1, ObjectExt::Box<double>(72)));
series->get_DataPoints()->AddDataPointForStockSeries(fact->GetCell(defaultWorksheetIndex, 2, 1, ObjectExt::Box<double>(25)));
series->get_DataPoints()->AddDataPointForStockSeries(fact->GetCell(defaultWorksheetIndex, 3, 1, ObjectExt::Box<double>(38)));
series = chart->get_ChartData()->get_Series()->idx_get(1);
// دادههای سطر دوم را پر میکند
series->get_DataPoints()->AddDataPointForStockSeries(fact->GetCell(defaultWorksheetIndex, 1, 2, ObjectExt::Box<double>(172)));
series->get_DataPoints()->AddDataPointForStockSeries(fact->GetCell(defaultWorksheetIndex, 2, 2, ObjectExt::Box<double>(57)));
series->get_DataPoints()->AddDataPointForStockSeries(fact->GetCell(defaultWorksheetIndex, 3, 2, ObjectExt::Box<double>(57)));
series = chart->get_ChartData()->get_Series()->idx_get(2);
// دادههای سطر سوم را پر میکند
series->get_DataPoints()->AddDataPointForStockSeries(fact->GetCell(defaultWorksheetIndex, 1, 3, ObjectExt::Box<double>(12)));
series->get_DataPoints()->AddDataPointForStockSeries(fact->GetCell(defaultWorksheetIndex, 2, 3, ObjectExt::Box<double>(12)));
series->get_DataPoints()->AddDataPointForStockSeries(fact->GetCell(defaultWorksheetIndex, 3, 3, ObjectExt::Box<double>(13)));
series = chart->get_ChartData()->get_Series()->idx_get(3);
// دادههای سطر چهارم را پر میکند
series->get_DataPoints()->AddDataPointForStockSeries(fact->GetCell(defaultWorksheetIndex, 1, 4, ObjectExt::Box<double>(25)));
series->get_DataPoints()->AddDataPointForStockSeries(fact->GetCell(defaultWorksheetIndex, 2, 4, ObjectExt::Box<double>(38)));
series->get_DataPoints()->AddDataPointForStockSeries(fact->GetCell(defaultWorksheetIndex, 3, 4, ObjectExt::Box<double>(50)));
// گروه سطرها را تنظیم میکند
chart->get_ChartData()->get_SeriesGroups()->idx_get(0)->get_UpDownBars()->set_HasUpDownBars (true);
chart->get_ChartData()->get_SeriesGroups()->idx_get(0)->get_HiLowLinesFormat()->get_Line()->get_FillFormat()->set_FillType(FillType::Solid);
for(int i=0;i<chart->get_ChartData()->get_Series()->get_Count();i++)
{
series = chart->get_ChartData()->get_Series()->idx_get(i);
series->get_Format()->get_Line()->get_FillFormat()->set_FillType(FillType::NoFill);
}
// ارائه را ذخیره میکند
pres->Save(outPath, Aspose::Slides::Export::SaveFormat::Pptx);
ایجاد نمودارهای جعبهای و ویسکر
- یک نمونه از کلاس Presentation ایجاد کنید.
- مرجع اسلاید را از طریق اندیس آن دریافت کنید.
- یک نمودار با دادههای پیشفرض و نوع دلخواه (
ChartType.BoxAndWhisker) اضافه کنید. - به IChartDataWorkbook دسترسی پیدا کنید.
- سطرها و دستههای پیشفرض را پاک کنید.
- سطرها و دستههای جدید اضافه کنید.
- دادههای جدید برای سطرهای نمودار اضافه کنید.
- ارائه اصلاحشده را بهصورت فایل PPTX ذخیره کنید.
این کد C++ نشان میدهد چگونه یک نمودار جعبهای و ویسکر ایجاد کنید:
#include <DOM/Chart/ChartType.h>
#include <DOM/Chart/IChartCategoryCollection.h>
#include <DOM/Chart/IChartData.h>
#include <DOM/Chart/IChartDataPointCollection.h>
#include <DOM/Chart/IChartDataWorkbook.h>
#include <DOM/Chart/IChartSeries.h>
#include <DOM/Chart/IChartSeriesCollection.h>
#include <DOM/Chart/QuartileMethodType.h>
#include <DOM/IChart.h>
#include <DOM/IShapeCollection.h>
#include <DOM/ISlide.h>
#include <DOM/ISlideCollection.h>
#include <DOM/Presentation.h>
#include <Export/SaveFormat.h>
#include <system/string.h>
using namespace Aspose::Slides;
using namespace Aspose::Slides::Charts;
using namespace Aspose::Slides::Export;
using namespace System;
// مسیر پوشهٔ اسناد.
const String outPath = u"../out/BoxAndWhisker_out.pptx";
// یک شیء از کلاس Presentation ایجاد میکند که فایل PPTX را نمایندگی میکند
SharedPtr<Presentation> pres = MakeObject<Presentation>();
// به اولین اسلاید دسترسی مییابد
SharedPtr<ISlide> slide = pres->get_Slides()->idx_get(0);
System::SharedPtr<IChart> chart = slide->get_Shapes()->AddChart(Aspose::Slides::Charts::ChartType::BoxAndWhisker, 50, 50, 500, 400);
chart->get_ChartData()->get_Categories()->Clear();
chart->get_ChartData()->get_Series()->Clear();
System::SharedPtr<IChartDataWorkbook> wb = chart->get_ChartData()->get_ChartDataWorkbook();
wb->Clear(0);
chart->get_ChartData()->get_Categories()->Add(wb->GetCell(0, u"A1", System::ObjectExt::Box<System::String>(u"Category 1")));
chart->get_ChartData()->get_Categories()->Add(wb->GetCell(0, u"A2", System::ObjectExt::Box<System::String>(u"Category 1")));
chart->get_ChartData()->get_Categories()->Add(wb->GetCell(0, u"A3", System::ObjectExt::Box<System::String>(u"Category 1")));
chart->get_ChartData()->get_Categories()->Add(wb->GetCell(0, u"A4", System::ObjectExt::Box<System::String>(u"Category 1")));
chart->get_ChartData()->get_Categories()->Add(wb->GetCell(0, u"A5", System::ObjectExt::Box<System::String>(u"Category 1")));
chart->get_ChartData()->get_Categories()->Add(wb->GetCell(0, u"A6", System::ObjectExt::Box<System::String>(u"Category 1")));
System::SharedPtr<IChartSeries> series = chart->get_ChartData()->get_Series()->Add(Aspose::Slides::Charts::ChartType::BoxAndWhisker);
series->set_QuartileMethod(Aspose::Slides::Charts::QuartileMethodType::Exclusive);
series->set_ShowMeanLine(true);
series->set_ShowMeanMarkers(true);
series->set_ShowInnerPoints(true);
series->set_ShowOutlierPoints(true);
series->get_DataPoints()->AddDataPointForBoxAndWhiskerSeries(wb->GetCell(0, u"B1", System::ObjectExt::Box<int32_t>(15)));
series->get_DataPoints()->AddDataPointForBoxAndWhiskerSeries(wb->GetCell(0, u"B2", System::ObjectExt::Box<int32_t>(41)));
series->get_DataPoints()->AddDataPointForBoxAndWhiskerSeries(wb->GetCell(0, u"B3", System::ObjectExt::Box<int32_t>(16)));
series->get_DataPoints()->AddDataPointForBoxAndWhiskerSeries(wb->GetCell(0, u"B4", System::ObjectExt::Box<int32_t>(10)));
series->get_DataPoints()->AddDataPointForBoxAndWhiskerSeries(wb->GetCell(0, u"B5", System::ObjectExt::Box<int32_t>(23)));
series->get_DataPoints()->AddDataPointForBoxAndWhiskerSeries(wb->GetCell(0, u"B6", System::ObjectExt::Box<int32_t>(16)));
// ارائه را ذخیره میکند
pres->Save(outPath, Aspose::Slides::Export::SaveFormat::Pptx);
ایجاد نمودارهای قیفی
- یک نمونه از کلاس Presentation ایجاد کنید.
- مرجع اسلاید را از طریق اندیس آن دریافت کنید.
- یک نمودار با دادههای پیشفرض و نوع دلخواه (
ChartType.Funnel) اضافه کنید. - ارائه اصلاحشده را بهصورت فایل PPTX ذخیره کنید.
این کد C++ نشان میدهد چگونه یک نمودار قیفی ایجاد کنید:
#include <DOM/Chart/ChartType.h>
#include <DOM/Chart/IChartCategoryCollection.h>
#include <DOM/Chart/IChartData.h>
#include <DOM/Chart/IChartDataPointCollection.h>
#include <DOM/Chart/IChartDataWorkbook.h>
#include <DOM/Chart/IChartSeries.h>
#include <DOM/Chart/IChartSeriesCollection.h>
#include <DOM/IChart.h>
#include <DOM/IShapeCollection.h>
#include <DOM/ISlide.h>
#include <DOM/ISlideCollection.h>
#include <DOM/Presentation.h>
#include <Export/SaveFormat.h>
#include <system/string.h>
using namespace Aspose::Slides;
using namespace Aspose::Slides::Charts;
using namespace Aspose::Slides::Export;
using namespace System;
// مسیر پوشهٔ اسناد.
const String outPath = u"../out/FunnelChart_out.pptx";
// یک شیء از کلاس Presentation ایجاد میکند که فایل PPTX را نمایندگی میکند
SharedPtr<Presentation> pres = MakeObject<Presentation>();
// به اولین اسلاید دسترسی مییابد
SharedPtr<ISlide> slide = pres->get_Slides()->idx_get(0);
System::SharedPtr<IChart> chart = slide->get_Shapes()->AddChart(Aspose::Slides::Charts::ChartType::Funnel, 50, 50, 500, 400);
chart->get_ChartData()->get_Categories()->Clear();
chart->get_ChartData()->get_Series()->Clear();
System::SharedPtr<IChartDataWorkbook> wb = chart->get_ChartData()->get_ChartDataWorkbook();
wb->Clear(0);
chart->get_ChartData()->get_Categories()->Add(wb->GetCell(0, u"A1", System::ObjectExt::Box<System::String>(u"Category 1")));
chart->get_ChartData()->get_Categories()->Add(wb->GetCell(0, u"A2", System::ObjectExt::Box<System::String>(u"Category 2")));
chart->get_ChartData()->get_Categories()->Add(wb->GetCell(0, u"A3", System::ObjectExt::Box<System::String>(u"Category 3")));
chart->get_ChartData()->get_Categories()->Add(wb->GetCell(0, u"A4", System::ObjectExt::Box<System::String>(u"Category 4")));
chart->get_ChartData()->get_Categories()->Add(wb->GetCell(0, u"A5", System::ObjectExt::Box<System::String>(u"Category 5")));
chart->get_ChartData()->get_Categories()->Add(wb->GetCell(0, u"A6", System::ObjectExt::Box<System::String>(u"Category 6")));
System::SharedPtr<IChartSeries> series = chart->get_ChartData()->get_Series()->Add(Aspose::Slides::Charts::ChartType::Funnel);
series->get_DataPoints()->AddDataPointForFunnelSeries(wb->GetCell(0, u"B1", System::ObjectExt::Box<int32_t>(50)));
series->get_DataPoints()->AddDataPointForFunnelSeries(wb->GetCell(0, u"B2", System::ObjectExt::Box<int32_t>(100)));
series->get_DataPoints()->AddDataPointForFunnelSeries(wb->GetCell(0, u"B3", System::ObjectExt::Box<int32_t>(200)));
series->get_DataPoints()->AddDataPointForFunnelSeries(wb->GetCell(0, u"B4", System::ObjectExt::Box<int32_t>(300)));
series->get_DataPoints()->AddDataPointForFunnelSeries(wb->GetCell(0, u"B5", System::ObjectExt::Box<int32_t>(400)));
series->get_DataPoints()->AddDataPointForFunnelSeries(wb->GetCell(0, u"B6", System::ObjectExt::Box<int32_t>(500)));
// ارائه را ذخیره میکند
pres->Save(outPath, Aspose::Slides::Export::SaveFormat::Pptx);
ایجاد نمودارهای خورشیدی
- یک نمونه از کلاس Presentation ایجاد کنید.
- مرجع اسلاید را از طریق اندیس آن دریافت کنید.
- یک نمودار با دادههای پیشفرض و نوع دلخواه (در این مثال
ChartType.sunburst) اضافه کنید. - ارائه اصلاحشده را بهصورت فایل PPTX ذخیره کنید.
این کد C++ نشان میدهد چگونه یک نمودار خورشیدی ایجاد کنید:
#include <DOM/Chart/ChartType.h>
#include <DOM/Chart/IChartCategory.h>
#include <DOM/Chart/IChartCategoryCollection.h>
#include <DOM/Chart/IChartCategoryLevelsManager.h>
#include <DOM/Chart/IChartData.h>
#include <DOM/Chart/IChartDataPointCollection.h>
#include <DOM/Chart/IChartDataWorkbook.h>
#include <DOM/Chart/IChartSeries.h>
#include <DOM/Chart/IChartSeriesCollection.h>
#include <DOM/Chart/IDataLabelCollection.h>
#include <DOM/Chart/IDataLabelFormat.h>
#include <DOM/IChart.h>
#include <DOM/IShapeCollection.h>
#include <DOM/ISlide.h>
#include <DOM/ISlideCollection.h>
#include <DOM/Presentation.h>
#include <Export/SaveFormat.h>
#include <system/string.h>
using namespace Aspose::Slides;
using namespace Aspose::Slides::Charts;
using namespace Aspose::Slides::Export;
using namespace System;
// مسیر پوشهٔ اسناد.
const String outPath = u"../out/SunburstChart_out.pptx";
// یک شیء از کلاس Presentation ایجاد میکند که فایل PPTX را نمایندگی میکند
SharedPtr<Presentation> pres = MakeObject<Presentation>();
// به اولین اسلاید دسترسی مییابد
SharedPtr<ISlide> slide = pres->get_Slides()->idx_get(0);
System::SharedPtr<IChart> chart=slide->get_Shapes()->AddChart(Aspose::Slides::Charts::ChartType::Sunburst, 50, 50, 500, 400);
chart->get_ChartData()->get_Categories()->Clear();
chart->get_ChartData()->get_Series()->Clear();
System::SharedPtr<IChartDataWorkbook> wb = chart->get_ChartData()->get_ChartDataWorkbook();
wb->Clear(0);
// شاخه 1
System::SharedPtr<IChartCategory> leaf = chart->get_ChartData()->get_Categories()->Add(wb->GetCell(0, u"C1", System::ObjectExt::Box<System::String>(u"Leaf1")));
leaf->get_GroupingLevels()->SetGroupingItem(1, System::ObjectExt::Box<System::String>(u"Stem1"));
leaf->get_GroupingLevels()->SetGroupingItem(2, System::ObjectExt::Box<System::String>(u"Branch1"));
chart->get_ChartData()->get_Categories()->Add(wb->GetCell(0, u"C2", System::ObjectExt::Box<System::String>(u"Leaf2")));
leaf = chart->get_ChartData()->get_Categories()->Add(wb->GetCell(0, u"C3", System::ObjectExt::Box<System::String>(u"Leaf3")));
leaf->get_GroupingLevels()->SetGroupingItem(1, System::ObjectExt::Box<System::String>(u"Stem2"));
chart->get_ChartData()->get_Categories()->Add(wb->GetCell(0, u"C4", System::ObjectExt::Box<System::String>(u"Leaf4")));
// شاخه 2
leaf = chart->get_ChartData()->get_Categories()->Add(wb->GetCell(0, u"C5", System::ObjectExt::Box<System::String>(u"Leaf5")));
leaf->get_GroupingLevels()->SetGroupingItem(1, System::ObjectExt::Box<System::String>(u"Stem3"));
leaf->get_GroupingLevels()->SetGroupingItem(2, System::ObjectExt::Box<System::String>(u"Branch2"));
chart->get_ChartData()->get_Categories()->Add(wb->GetCell(0, u"C6", System::ObjectExt::Box<System::String>(u"Leaf6")));
leaf = chart->get_ChartData()->get_Categories()->Add(wb->GetCell(0, u"C7", System::ObjectExt::Box<System::String>(u"Leaf7")));
leaf->get_GroupingLevels()->SetGroupingItem(1, System::ObjectExt::Box<System::String>(u"Stem4"));
chart->get_ChartData()->get_Categories()->Add(wb->GetCell(0, u"C8", System::ObjectExt::Box<System::String>(u"Leaf8")));
System::SharedPtr<IChartSeries> series = chart->get_ChartData()->get_Series()->Add(Aspose::Slides::Charts::ChartType::Sunburst);
series->get_Labels()->get_DefaultDataLabelFormat()->set_ShowCategoryName(true);
series->get_DataPoints()->AddDataPointForSunburstSeries(wb->GetCell(0, u"D1", System::ObjectExt::Box<int32_t>(4)));
series->get_DataPoints()->AddDataPointForSunburstSeries(wb->GetCell(0, u"D2", System::ObjectExt::Box<int32_t>(5)));
series->get_DataPoints()->AddDataPointForSunburstSeries(wb->GetCell(0, u"D3", System::ObjectExt::Box<int32_t>(3)));
series->get_DataPoints()->AddDataPointForSunburstSeries(wb->GetCell(0, u"D4", System::ObjectExt::Box<int32_t>(6)));
series->get_DataPoints()->AddDataPointForSunburstSeries(wb->GetCell(0, u"D5", System::ObjectExt::Box<int32_t>(9)));
series->get_DataPoints()->AddDataPointForSunburstSeries(wb->GetCell(0, u"D6", System::ObjectExt::Box<int32_t>(9)));
series->get_DataPoints()->AddDataPointForSunburstSeries(wb->GetCell(0, u"D7", System::ObjectExt::Box<int32_t>(4)));
series->get_DataPoints()->AddDataPointForSunburstSeries(wb->GetCell(0, u"D8", System::ObjectExt::Box<int32_t>(3)));
// فایل ارائه را روی دیسک ذخیره میکند
pres->Save(outPath, Aspose::Slides::Export::SaveFormat::Pptx);
ایجاد نمودارهای هیستوگرام
- یک نمونه از کلاس Presentation ایجاد کنید.
- مرجع اسلاید را از طریق اندیس آن دریافت کنید.
- یک نمودار با برخی دادهها اضافه کنید و نوع نمودار دلخواه (
ChartType.Histogram) را مشخص کنید. - به IChartDataWorkbook دسترسی پیدا کنید.
- سطرها و دستههای پیشفرض را پاک کنید.
- سطرها و دستههای جدید اضافه کنید.
- ارائه اصلاحشده را بهصورت فایل PPTX ذخیره کنید.
این کد C++ نشان میدهد چگونه یک نمودار هیستوگرام ایجاد کنید:
#include <DOM/Chart/AxisAggregationType.h>
#include <DOM/Chart/ChartType.h>
#include <DOM/Chart/IAxesManager.h>
#include <DOM/Chart/IAxis.h>
#include <DOM/Chart/IChartCategoryCollection.h>
#include <DOM/Chart/IChartData.h>
#include <DOM/Chart/IChartDataPointCollection.h>
#include <DOM/Chart/IChartDataWorkbook.h>
#include <DOM/Chart/IChartSeries.h>
#include <DOM/Chart/IChartSeriesCollection.h>
#include <DOM/IChart.h>
#include <DOM/IShapeCollection.h>
#include <DOM/ISlide.h>
#include <DOM/ISlideCollection.h>
#include <DOM/Presentation.h>
#include <Export/SaveFormat.h>
#include <system/string.h>
using namespace Aspose::Slides;
using namespace Aspose::Slides::Charts;
using namespace Aspose::Slides::Export;
using namespace System;
// مسیر پوشهٔ اسناد.
const String outPath = u"../out/HistogramChart_out.pptx";
// یک شیء از کلاس Presentation ایجاد میکند که فایل PPTX را نمایندگی میکند
SharedPtr<Presentation> pres = MakeObject<Presentation>();
// به اولین اسلاید دسترسی مییابد
SharedPtr<ISlide> slide = pres->get_Slides()->idx_get(0);
System::SharedPtr<IChart> chart = slide->get_Shapes()->AddChart(Aspose::Slides::Charts::ChartType::Histogram, 50, 50, 500, 400);
chart->get_ChartData()->get_Categories()->Clear();
chart->get_ChartData()->get_Series()->Clear();
System::SharedPtr<IChartDataWorkbook> wb = chart->get_ChartData()->get_ChartDataWorkbook();
wb->Clear(0);
System::SharedPtr<IChartSeries> series = chart->get_ChartData()->get_Series()->Add(Aspose::Slides::Charts::ChartType::Histogram);
series->get_DataPoints()->AddDataPointForHistogramSeries(wb->GetCell(0, u"A1", System::ObjectExt::Box<int32_t>(15)));
series->get_DataPoints()->AddDataPointForHistogramSeries(wb->GetCell(0, u"A2", System::ObjectExt::Box<int32_t>(-41)));
series->get_DataPoints()->AddDataPointForHistogramSeries(wb->GetCell(0, u"A3", System::ObjectExt::Box<int32_t>(16)));
series->get_DataPoints()->AddDataPointForHistogramSeries(wb->GetCell(0, u"A4", System::ObjectExt::Box<int32_t>(10)));
series->get_DataPoints()->AddDataPointForHistogramSeries(wb->GetCell(0, u"A5", System::ObjectExt::Box<int32_t>(-23)));
series->get_DataPoints()->AddDataPointForHistogramSeries(wb->GetCell(0, u"A6", System::ObjectExt::Box<int32_t>(16)));
chart->get_Axes()->get_HorizontalAxis()->set_AggregationType(Aspose::Slides::Charts::AxisAggregationType::Automatic);
// ارائه را ذخیره میکند
pres->Save(outPath, Aspose::Slides::Export::SaveFormat::Pptx);
ایجاد نمودارهای رادار
- یک نمونه از کلاس Presentation ایجاد کنید.
- مرجع اسلاید را از طریق اندیس آن دریافت کنید.
- یک نمودار با برخی دادهها اضافه کنید و نوع نمودار دلخواه (
ChartType.Radar) را مشخص کنید. - ارائه اصلاحشده را بهصورت فایل PPTX ذخیره کنید.
این کد C++ نشان میدهد چگونه یک نمودار رادار ایجاد کنید:
#include <DOM/Chart/ChartType.h>
#include <DOM/IShapeCollection.h>
#include <DOM/ISlide.h>
#include <DOM/ISlideCollection.h>
#include <DOM/Presentation.h>
#include <Export/SaveFormat.h>
using namespace Aspose::Slides;

System::SharedPtr<Presentation> presentation = System::MakeObject<Presentation>();

presentation->get_Slides()->idx_get(0)->get_Shapes()->AddChart(Aspose::Slides::Charts::ChartType::Radar, 20.0f, 20.0f, 400.0f, 300.0f);
presentation->Save(u"Radar-chart.pptx", Aspose::Slides::Export::SaveFormat::Pptx);
ایجاد نمودارهای چنددستهای
- یک نمونه از کلاس Presentation ایجاد کنید.
- مرجع اسلاید را با اندیس آن بهدست آورید.
- یک نمودار با دادههای پیشفرض و نوع دلخواه (
ChartType.ClusteredColumn) اضافه کنید. - به IChartDataWorkbook دسترسی پیدا کنید.
- سطرها و دستههای پیشفرض را پاک کنید.
- سطرها و دستههای جدید اضافه کنید.
- دادههای جدید برای سطرهای نمودار اضافه کنید.
- ارائه اصلاحشده را بهصورت فایل PPTX ذخیره کنید.
این کد C++ نشان میدهد چگونه یک نمودار چنددستهای ایجاد کنید:
#include <DOM/Chart/ChartType.h>
#include <DOM/Chart/IChartCategory.h>
#include <DOM/Chart/IChartCategoryCollection.h>
#include <DOM/Chart/IChartCategoryLevelsManager.h>
#include <DOM/Chart/IChartData.h>
#include <DOM/Chart/IChartDataPointCollection.h>
#include <DOM/Chart/IChartDataWorkbook.h>
#include <DOM/Chart/IChartSeries.h>
#include <DOM/Chart/IChartSeriesCollection.h>
#include <DOM/IChart.h>
#include <DOM/IShapeCollection.h>
#include <DOM/ISlide.h>
#include <DOM/ISlideCollection.h>
#include <DOM/Presentation.h>
#include <Export/SaveFormat.h>
#include <system/object_ext.h>
#include <system/string.h>
using namespace Aspose::Slides;
using namespace Aspose::Slides::Charts;
using namespace Aspose::Slides::Export;
using namespace System;
// مسیر پوشهٔ اسناد.
const String outPath = u"../out/MultiCategoryChart_out.pptx";
// یک شیء از کلاس Presentation ایجاد میکند که فایل PPTX را نمایندگی میکند
SharedPtr<Presentation> pres = MakeObject<Presentation>();
// به اولین اسلاید دسترسی مییابد
SharedPtr<ISlide> slide = pres->get_Slides()->idx_get(0);
// یک نمودار با دادههای پیشفرض اضافه میکند
SharedPtr<IChart> chart = slide->get_Shapes()->AddChart(Aspose::Slides::Charts::ChartType::ClusteredColumn, 0, 0, 500, 500);
// اندیس صفحه دادهٔ نمودار را تنظیم میکند
int defaultWorksheetIndex = 0;
// ورکشیت دادهٔ نمودار را دریافت میکند
SharedPtr<IChartDataWorkbook> fact = chart->get_ChartData()->get_ChartDataWorkbook();
// ورکبوک را پاک میکند
fact->Clear(defaultWorksheetIndex);
chart->get_ChartData()->get_Series()->Clear();
chart->get_ChartData()->get_Categories()->Clear();
// دستهها را اضافه میکند
SharedPtr<IChartCategory> category = chart->get_ChartData()->get_Categories()->Add(fact->GetCell(defaultWorksheetIndex, u"c2", ObjectExt::Box<System::String>(u"A")));
category->get_GroupingLevels()->SetGroupingItem(1, ObjectExt::Box<System::String>(u"Group1"));
chart->get_ChartData()->get_Categories()->Add(fact->GetCell(defaultWorksheetIndex, u"c3", ObjectExt::Box<System::String>(u"B")));
category = chart->get_ChartData()->get_Categories()->Add(fact->GetCell(defaultWorksheetIndex, u"c4", ObjectExt::Box<System::String>(u"C")));
category->get_GroupingLevels()->SetGroupingItem(1, ObjectExt::Box<System::String>(u"Group2"));
chart->get_ChartData()->get_Categories()->Add(fact->GetCell(defaultWorksheetIndex, u"c5", ObjectExt::Box<System::String>(u"D")));
category = chart->get_ChartData()->get_Categories()->Add(fact->GetCell(defaultWorksheetIndex, u"c6", ObjectExt::Box<System::String>(u"E")));
category->get_GroupingLevels()->SetGroupingItem(1, ObjectExt::Box<System::String>(u"Group3"));
chart->get_ChartData()->get_Categories()->Add(fact->GetCell(defaultWorksheetIndex, u"c7", ObjectExt::Box<System::String>(u"F")));
category = chart->get_ChartData()->get_Categories()->Add(fact->GetCell(defaultWorksheetIndex, u"c8", ObjectExt::Box<System::String>(u"G")));
category->get_GroupingLevels()->SetGroupingItem(1, ObjectExt::Box<System::String>(u"Group4"));
chart->get_ChartData()->get_Categories()->Add(fact->GetCell(defaultWorksheetIndex, u"c9", ObjectExt::Box<System::String>(u"H")));
// یک سطر جدید اضافه میکند
SharedPtr<IChartSeries> series = chart->get_ChartData()->get_Series()->Add(fact->GetCell(0, u"D1", ObjectExt::Box<System::String>(u"Series 1")),
ChartType::ClusteredColumn);
series->get_DataPoints()->AddDataPointForBarSeries(fact->GetCell(defaultWorksheetIndex, u"D2", ObjectExt::Box<double>(10)));
series->get_DataPoints()->AddDataPointForBarSeries(fact->GetCell(defaultWorksheetIndex, u"D3", ObjectExt::Box<double>(20)));
series->get_DataPoints()->AddDataPointForBarSeries(fact->GetCell(defaultWorksheetIndex, u"D4", ObjectExt::Box<double>(30)));
series->get_DataPoints()->AddDataPointForBarSeries(fact->GetCell(defaultWorksheetIndex, u"D5", ObjectExt::Box<double>(40)));
series->get_DataPoints()->AddDataPointForBarSeries(fact->GetCell(defaultWorksheetIndex, u"D6", ObjectExt::Box<double>(50)));
series->get_DataPoints()->AddDataPointForBarSeries(fact->GetCell(defaultWorksheetIndex, u"D7", ObjectExt::Box<double>(60)));
series->get_DataPoints()->AddDataPointForBarSeries(fact->GetCell(defaultWorksheetIndex, u"D8", ObjectExt::Box<double>(70)));
series->get_DataPoints()->AddDataPointForBarSeries(fact->GetCell(defaultWorksheetIndex, u"D9", ObjectExt::Box<double>(80)));
// ارائه را ذخیره میکند
pres->Save(outPath, Aspose::Slides::Export::SaveFormat::Pptx);
ایجاد نمودارهای نقشه
نمودار نقشه تصویری از منطقهای است که دادهها را در خود دارد. نمودارهای نقشه برای مقایسه دادهها یا مقادیر در سطوح جغرافیایی مختلف مناسباند.
این کد C++ نشان میدهد چگونه یک نمودار نقشه ایجاد کنید:
#include <DOM/Chart/ChartType.h>
#include <DOM/IShapeCollection.h>
#include <DOM/ISlide.h>
#include <DOM/ISlideCollection.h>
#include <DOM/Presentation.h>
#include <Export/SaveFormat.h>
using namespace Aspose::Slides;
using namespace Aspose::Slides::Charts;
using namespace Aspose::Slides::Export;

auto pres = System::MakeObject<Presentation>();
auto slide = pres->get_Slides()->idx_get(0);
auto chart = slide->get_Shapes()->AddChart(ChartType::Map, 50.0f, 50.0f, 500.0f, 400.0f);
pres->Save(u"mapChart.pptx", SaveFormat::Pptx);
ایجاد نمودارهای ترکیبی
نمودار ترکیبی (یا combo chart) دو یا چند نوع نمودار را در یک گراف ترکیب میکند. این نمودار به شما امکان میدهد تا تفاوتها یا شباهتهای بین دو یا چند مجموعه داده را برجسته، مقایسه یا بررسی کنید و روابط بین آنها را شناسایی کنید.
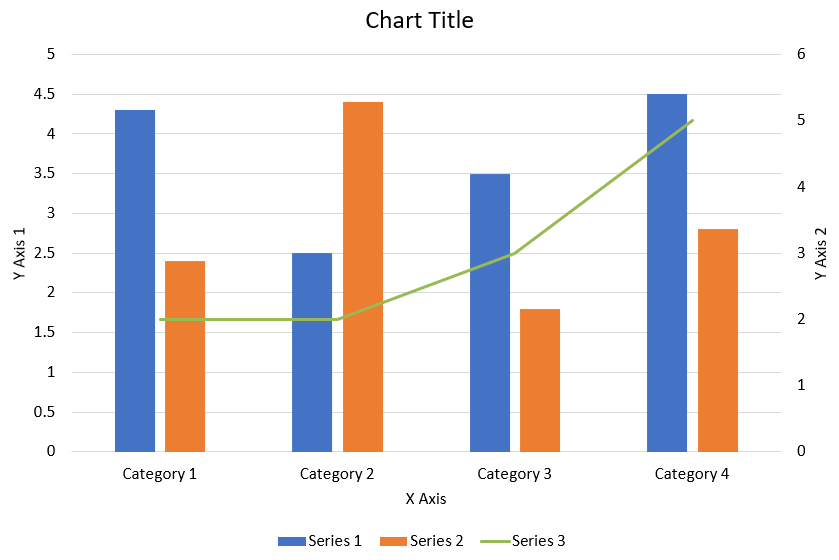
کد C++ زیر نشان میدهد چگونه نمودار ترکیبی نشانداده‑شده در بالا را در یک ارائه PowerPoint ایجاد کنید:
#include <DOM/Chart/AxisPositionType.h>
#include <DOM/Chart/ChartType.h>
#include <DOM/Chart/CrossesType.h>
#include <DOM/Chart/IAxesManager.h>
#include <DOM/Chart/IAxis.h>
#include <DOM/Chart/IAxisFormat.h>
#include <DOM/Chart/IChartCategoryCollection.h>
#include <DOM/Chart/IChartData.h>
#include <DOM/Chart/IChartDataPointCollection.h>
#include <DOM/Chart/IChartDataWorkbook.h>
#include <DOM/Chart/IChartLinesFormat.h>
#include <DOM/Chart/IChartPortionFormat.h>
#include <DOM/Chart/IChartSeries.h>
#include <DOM/Chart/IChartSeriesCollection.h>
#include <DOM/Chart/IChartSeriesGroup.h>
#include <DOM/Chart/IChartTextFormat.h>
#include <DOM/Chart/IChartTitle.h>
#include <DOM/Chart/ILegend.h>
#include <DOM/Chart/LegendPositionType.h>
#include <DOM/FillType.h>
#include <DOM/IChart.h>
#include <DOM/IColorFormat.h>
#include <DOM/ILineFillFormat.h>
#include <DOM/ILineFormat.h>
#include <DOM/IParagraph.h>
#include <DOM/IParagraphFormat.h>
#include <DOM/IPortionFormat.h>
#include <DOM/IShapeCollection.h>
#include <DOM/ISlide.h>
#include <DOM/ITextFrame.h>
#include <DOM/NullableBool.h>
#include <DOM/Presentation.h>
#include <Export/SaveFormat.h>
#include <drawing/color.h>
#include <system/string.h>
using namespace Aspose::Slides;
using namespace Aspose::Slides::Charts;
using namespace Aspose::Slides::Export;
using namespace System;
using namespace System::Drawing;
static SharedPtr<IChart> CreateChartWithFirstSeries(SharedPtr<ISlide> slide)
{
auto chart = slide->get_Shapes()->AddChart(ChartType::ClusteredColumn, 50, 50, 600, 400);
// عنوان نمودار را تنظیم میکند.
chart->set_HasTitle(true);
chart->get_ChartTitle()->AddTextFrameForOverriding(u"Chart Title");
chart->get_ChartTitle()->set_Overlay(false);
auto titleParagraph = chart->get_ChartTitle()->get_TextFrameForOverriding()->get_Paragraph(0);
auto titleFormat = titleParagraph->get_ParagraphFormat()->get_DefaultPortionFormat();
titleFormat->set_FontBold(NullableBool::False);
titleFormat->set_FontHeight(18.0);
// لجند نمودار را تنظیم میکند.
chart->get_Legend()->set_Position(LegendPositionType::Bottom);
chart->get_Legend()->get_TextFormat()->get_PortionFormat()->set_FontHeight(12.0);
// سطرها و دستههای پیشفرض تولیدشده را حذف میکند.
chart->get_ChartData()->get_Series()->Clear();
chart->get_ChartData()->get_Categories()->Clear();
const int worksheetIndex = 0;
auto workbook = chart->get_ChartData()->get_ChartDataWorkbook();
// دستههای جدید را اضافه میکند.
chart->get_ChartData()->get_Categories()->Add(workbook->GetCell(worksheetIndex, 1, 0, ObjectExt::Box<String>(u"Category 1")));
chart->get_ChartData()->get_Categories()->Add(workbook->GetCell(worksheetIndex, 2, 0, ObjectExt::Box<String>(u"Category 2")));
chart->get_ChartData()->get_Categories()->Add(workbook->GetCell(worksheetIndex, 3, 0, ObjectExt::Box<String>(u"Category 3")));
chart->get_ChartData()->get_Categories()->Add(workbook->GetCell(worksheetIndex, 4, 0, ObjectExt::Box<String>(u"Category 4")));
// سطر اول را اضافه میکند.
auto seriesNameCell = workbook->GetCell(worksheetIndex, 0, 1, ObjectExt::Box<String>(u"Series 1"));
auto series = chart->get_ChartData()->get_Series()->Add(seriesNameCell, chart->get_Type());
series->get_ParentSeriesGroup()->set_Overlap(-25);
series->get_ParentSeriesGroup()->set_GapWidth(220);
series->get_DataPoints()->AddDataPointForBarSeries(workbook->GetCell(worksheetIndex, 1, 1, ObjectExt::Box<double>(4.3)));
series->get_DataPoints()->AddDataPointForBarSeries(workbook->GetCell(worksheetIndex, 2, 1, ObjectExt::Box<double>(2.5)));
series->get_DataPoints()->AddDataPointForBarSeries(workbook->GetCell(worksheetIndex, 3, 1, ObjectExt::Box<double>(3.5)));
series->get_DataPoints()->AddDataPointForBarSeries(workbook->GetCell(worksheetIndex, 4, 1, ObjectExt::Box<double>(4.5)));
return chart;
}
static void AddSecondSeriesToChart(SharedPtr<IChart> chart)
{
auto workbook = chart->get_ChartData()->get_ChartDataWorkbook();
const int worksheetIndex = 0;
auto seriesNameCell = workbook->GetCell(worksheetIndex, 0, 2, ObjectExt::Box<String>(u"Series 2"));
auto series = chart->get_ChartData()->get_Series()->Add(seriesNameCell, ChartType::ClusteredColumn);
series->get_ParentSeriesGroup()->set_Overlap(-25);
series->get_ParentSeriesGroup()->set_GapWidth(220);
series->get_DataPoints()->AddDataPointForBarSeries(workbook->GetCell(worksheetIndex, 1, 2, ObjectExt::Box<double>(2.4)));
series->get_DataPoints()->AddDataPointForBarSeries(workbook->GetCell(worksheetIndex, 2, 2, ObjectExt::Box<double>(4.4)));
series->get_DataPoints()->AddDataPointForBarSeries(workbook->GetCell(worksheetIndex, 3, 2, ObjectExt::Box<double>(1.8)));
series->get_DataPoints()->AddDataPointForBarSeries(workbook->GetCell(worksheetIndex, 4, 2, ObjectExt::Box<double>(2.8)));
}
static void AddThirdSeriesToChart(SharedPtr<IChart> chart)
{
auto workbook = chart->get_ChartData()->get_ChartDataWorkbook();
const int worksheetIndex = 0;
auto seriesNameCell = workbook->GetCell(worksheetIndex, 0, 3, ObjectExt::Box<String>(u"Series 3"));
auto series = chart->get_ChartData()->get_Series()->Add(seriesNameCell, ChartType::Line);
series->get_DataPoints()->AddDataPointForLineSeries(workbook->GetCell(worksheetIndex, 1, 3, ObjectExt::Box<double>(2.0)));
series->get_DataPoints()->AddDataPointForLineSeries(workbook->GetCell(worksheetIndex, 2, 3, ObjectExt::Box<double>(2.0)));
series->get_DataPoints()->AddDataPointForLineSeries(workbook->GetCell(worksheetIndex, 3, 3, ObjectExt::Box<double>(3.0)));
series->get_DataPoints()->AddDataPointForLineSeries(workbook->GetCell(worksheetIndex, 4, 3, ObjectExt::Box<double>(5.0)));
series->set_PlotOnSecondAxis(true);
}
static void SetAxisTitle(SharedPtr<IAxis> axis, String axisTitle)
{
axis->set_HasTitle(true);
axis->get_Title()->set_Overlay(false);
auto titleParagraph = axis->get_Title()->AddTextFrameForOverriding(axisTitle)->get_Paragraph(0);
auto titleFormat = titleParagraph->get_ParagraphFormat()->get_DefaultPortionFormat();
titleFormat->set_FontBold(NullableBool::False);
titleFormat->set_FontHeight(12.0);
}
static void SetPrimaryAxesFormat(SharedPtr<IChart> chart)
{
// محور افقی را تنظیم میکند.
auto horizontalAxis = chart->get_Axes()->get_HorizontalAxis();
horizontalAxis->get_TextFormat()->get_PortionFormat()->set_FontHeight(12.0);
horizontalAxis->get_Format()->get_Line()->get_FillFormat()->set_FillType(FillType::NoFill);
SetAxisTitle(horizontalAxis, u"X Axis");
// محور عمودی را تنظیم میکند.
auto verticalAxis = chart->get_Axes()->get_VerticalAxis();
verticalAxis->get_TextFormat()->get_PortionFormat()->set_FontHeight(12.0);
verticalAxis->get_Format()->get_Line()->get_FillFormat()->set_FillType(FillType::NoFill);
SetAxisTitle(verticalAxis, u"Y Axis 1");
// رنگ خطوط شبکهٔ اصلی عمودی را تنظیم میکند.
auto majorGridLinesFormat = verticalAxis->get_MajorGridLinesFormat()->get_Line()->get_FillFormat();
majorGridLinesFormat->set_FillType(FillType::Solid);
majorGridLinesFormat->get_SolidFillColor()->set_Color(Color::FromArgb(217, 217, 217));
}
static void SetSecondaryAxesFormat(SharedPtr<IChart> chart)
{
// محور افقی ثانویه را تنظیم میکند.
auto secondaryHorizontalAxis = chart->get_Axes()->get_SecondaryHorizontalAxis();
secondaryHorizontalAxis->set_Position(AxisPositionType::Bottom);
secondaryHorizontalAxis->set_CrossType(CrossesType::Maximum);
secondaryHorizontalAxis->set_IsVisible(false);
secondaryHorizontalAxis->get_MajorGridLinesFormat()->get_Line()->get_FillFormat()->set_FillType(FillType::NoFill);
secondaryHorizontalAxis->get_MinorGridLinesFormat()->get_Line()->get_FillFormat()->set_FillType(FillType::NoFill);
// محور عمودی ثانویه را تنظیم میکند.
auto secondaryVerticalAxis = chart->get_Axes()->get_SecondaryVerticalAxis();
secondaryVerticalAxis->set_Position(AxisPositionType::Right);
secondaryVerticalAxis->get_TextFormat()->get_PortionFormat()->set_FontHeight(12.0);
secondaryVerticalAxis->get_Format()->get_Line()->get_FillFormat()->set_FillType(FillType::NoFill);
secondaryVerticalAxis->get_MajorGridLinesFormat()->get_Line()->get_FillFormat()->set_FillType(FillType::NoFill);
secondaryVerticalAxis->get_MinorGridLinesFormat()->get_Line()->get_FillFormat()->set_FillType(FillType::NoFill);
SetAxisTitle(secondaryVerticalAxis, u"Y Axis 2");
}
static void CreateComboChart()
{
auto presentation = MakeObject<Presentation>();
auto slide = presentation->get_Slide(0);
auto chart = CreateChartWithFirstSeries(slide);
AddSecondSeriesToChart(chart);
AddThirdSeriesToChart(chart);
SetPrimaryAxesFormat(chart);
SetSecondaryAxesFormat(chart);
presentation->Save(u"combo-chart.pptx", SaveFormat::Pptx);
presentation->Dispose();
}
بهروزرسانی نمودارها
- یک نمونه از کلاس Presentation که شامل نمودار موردنظر است، ایجاد کنید.
- مرجع اسلاید را از طریق اندیس آن دریافت کنید.
- تمام اشکال را مرور کنید تا نمودار موردنظر را پیدا کنید.
- به ورکشیت دادههای نمودار دسترسی پیدا کنید.
- دادههای سطرهای نمودار را با تغییر مقادیر سطرها اصلاح کنید.
- یک سطر جدید اضافه کنید و دادههای آن را پر کنید.
- ارائه اصلاحشده را بهصورت فایل PPTX ذخیره کنید.
این کد C++ نشان میدهد چگونه یک نمودار را بهروز کنید:
#include <DOM/Chart/ChartType.h>
#include <DOM/Chart/IChartData.h>
#include <DOM/Chart/IChartDataPoint.h>
#include <DOM/Chart/IChartDataPointCollection.h>
#include <DOM/Chart/IChartDataWorkbook.h>
#include <DOM/Chart/IChartSeries.h>
#include <DOM/Chart/IChartSeriesCollection.h>
#include <DOM/Chart/IDoubleChartValue.h>
#include <DOM/IChart.h>
#include <DOM/IShapeCollection.h>
#include <DOM/ISlide.h>
#include <DOM/ISlideCollection.h>
#include <DOM/Presentation.h>
#include <Export/SaveFormat.h>
using namespace Aspose::Slides;
using namespace Aspose::Slides::Charts;
// یک شیء از کلاس Presentation ایجاد میکند که فایل PPTX را نمایندگی میکند
System::SharedPtr<Presentation> pres = System::MakeObject<Presentation>(u"ExistingChart.pptx");
// به اولین اسلاید دسترسی مییابد
System::SharedPtr<ISlide> sld = pres->get_Slides()->idx_get(0);
// یک نمودار با دادههای پیشفرض اضافه میکند
System::SharedPtr<IChart> chart = System::ExplicitCast<Aspose::Slides::Charts::IChart>(sld->get_Shapes()->idx_get(0));
// اندیس صفحه دادهٔ نمودار را تنظیم میکند
int32_t defaultWorksheetIndex = 0;
// ورکشیت دادهٔ نمودار را دریافت میکند
System::SharedPtr<IChartDataWorkbook> fact = chart->get_ChartData()->get_ChartDataWorkbook();
// نام دستهٔ نمودار را تغییر میدهد
fact->GetCell(defaultWorksheetIndex, 1, 0, System::ObjectExt::Box<System::String>(u"Modified Category 1"));
fact->GetCell(defaultWorksheetIndex, 2, 0, System::ObjectExt::Box<System::String>(u"Modified Category 2"));
// سطر اول نمودار را میگیرد
System::SharedPtr<IChartSeries> series = chart->get_ChartData()->get_Series()->idx_get(0);
// دادههای سطر را بهروز میکند
fact->GetCell(defaultWorksheetIndex, 0, 1, System::ObjectExt::Box<System::String>(u"New_Series1"));
// تغییر نام سطر
series->get_DataPoints()->idx_get(0)->get_Value()->set_Data(System::ObjectExt::Box<int32_t>(90));
series->get_DataPoints()->idx_get(1)->get_Value()->set_Data(System::ObjectExt::Box<int32_t>(123));
series->get_DataPoints()->idx_get(2)->get_Value()->set_Data(System::ObjectExt::Box<int32_t>(44));
// سطر دوم نمودار را میگیرد
series = chart->get_ChartData()->get_Series()->idx_get(1);
// اکنون دادههای سطر را بهروز میکند
fact->GetCell(defaultWorksheetIndex, 0, 2, System::ObjectExt::Box<System::String>(u"New_Series2"));
// تغییر نام سطر
series->get_DataPoints()->idx_get(0)->get_Value()->set_Data(System::ObjectExt::Box<int32_t>(23));
series->get_DataPoints()->idx_get(1)->get_Value()->set_Data(System::ObjectExt::Box<int32_t>(67));
series->get_DataPoints()->idx_get(2)->get_Value()->set_Data(System::ObjectExt::Box<int32_t>(99));
// اکنون یک سطر جدید اضافه میکند
chart->get_ChartData()->get_Series()->Add(fact->GetCell(defaultWorksheetIndex, 0, 3, System::ObjectExt::Box<System::String>(u"Series 3")), chart->get_Type());
// سطر سوم نمودار را میگیرد
series = chart->get_ChartData()->get_Series()->idx_get(2);
// اکنون دادههای سطر را پر میکند
series->get_DataPoints()->AddDataPointForBarSeries(fact->GetCell(defaultWorksheetIndex, 1, 3, System::ObjectExt::Box<int32_t>(20)));
series->get_DataPoints()->AddDataPointForBarSeries(fact->GetCell(defaultWorksheetIndex, 2, 3, System::ObjectExt::Box<int32_t>(50)));
series->get_DataPoints()->AddDataPointForBarSeries(fact->GetCell(defaultWorksheetIndex, 3, 3, System::ObjectExt::Box<int32_t>(30)));
chart->set_Type(Aspose::Slides::Charts::ChartType::ClusteredCylinder);
// ارائه را همراه با نمودار ذخیره میکند
pres->Save(u"AsposeChartModified_out.pptx", Aspose::Slides::Export::SaveFormat::Pptx);
تنظیم بازه داده برای نمودارها
- یک نمونه از کلاس Presentation حاوی نمودار را باز کنید.
- مرجع اسلاید را از طریق اندیس آن دریافت کنید.
- تمام اشکال را مرور کنید تا نمودار موردنظر را پیدا کنید.
- به دادههای نمودار دسترسی پیدا کنید و بازه را تنظیم کنید.
- ارائه اصلاحشده را بهصورت فایل PPTX ذخیره کنید.
این کد C++ نشان میدهد چگونه بازه داده برای یک نمودار تنظیم شود:
#include <DOM/Chart/IChartData.h>
#include <DOM/IChart.h>
#include <DOM/IShapeCollection.h>
#include <DOM/ISlide.h>
#include <DOM/ISlideCollection.h>
#include <DOM/Presentation.h>
#include <Export/SaveFormat.h>
#include <system/string.h>
using namespace Aspose::Slides;
using namespace Aspose::Slides::Charts;
using namespace Aspose::Slides::Export;
using namespace System;
// مسیر پوشهٔ اسناد.
String dataDir = u"../documents/";
// یک شیء از کلاس Presentation ایجاد میکند که فایل PPTX را نمایندگی میکند
auto presentation = System::MakeObject<Presentation>(dataDir + u"ExistingChart.pptx");
// به اولین اسلاید دسترسی مییابد و یک نمودار با دادههای پیشفرض اضافه میکند
auto slide = presentation->get_Slides()->idx_get(0);
auto chart = System::ExplicitCast<IChart>(slide->get_Shapes()->idx_get(0));
chart->get_ChartData()->SetRange(u"Sheet1!A1:B4");
presentation->Save(dataDir + u"SetDataRange_out.pptx", SaveFormat::Pptx);
استفاده از نشانگرهای پیشفرض در نمودارها
وقتی از نشانگر پیشفرض در نمودارها استفاده میکنید، هر سطر نمودار بهصورت خودکار نماد نشانگر پیشفرض متفاوتی دریافت میکند.
این کد C++ نشان میدهد چگونه نشانگر سطر نمودار بهصورت خودکار تنظیم شود:
#include <DOM/Chart/ChartType.h>
#include <DOM/Chart/IChartCategoryCollection.h>
#include <DOM/Chart/IChartData.h>
#include <DOM/Chart/IChartDataPointCollection.h>
#include <DOM/Chart/IChartDataWorkbook.h>
#include <DOM/Chart/IChartSeries.h>
#include <DOM/Chart/IChartSeriesCollection.h>
#include <DOM/Chart/ILegend.h>
#include <DOM/IChart.h>
#include <DOM/IShapeCollection.h>
#include <DOM/ISlide.h>
#include <DOM/ISlideCollection.h>
#include <DOM/Presentation.h>
#include <Export/SaveFormat.h>
#include <system/object_ext.h>
#include <system/string.h>
using namespace Aspose::Slides;
using namespace Aspose::Slides::Charts;
using namespace Aspose::Slides::Export;
using namespace System;
// مسیر پوشهٔ اسناد.
String dataDir = u"../documents/";
auto pres = System::MakeObject<Presentation>();
auto slide = pres->get_Slides()->idx_get(0);
auto chart = slide->get_Shapes()->AddChart(ChartType::LineWithMarkers, 10.0f, 10.0f, 400.0f, 400.0f);
chart->get_ChartData()->get_Series()->Clear();
chart->get_ChartData()->get_Categories()->Clear();
auto wb = chart->get_ChartData()->get_ChartDataWorkbook();
chart->get_ChartData()->get_Series()->Add(wb->GetCell(0, 0, 1, ObjectExt::Box<String>(u"Series 1")), chart->get_Type());
auto series = chart->get_ChartData()->get_Series()->idx_get(0);
chart->get_ChartData()->get_Categories()->Add(wb->GetCell(0, 1, 0, ObjectExt::Box<String>(u"C1")));
series->get_DataPoints()->AddDataPointForLineSeries(wb->GetCell(0, 1, 1, ObjectExt::Box<int32_t>(24)));
chart->get_ChartData()->get_Categories()->Add(wb->GetCell(0, 2, 0, ObjectExt::Box<String>(u"C2")));
series->get_DataPoints()->AddDataPointForLineSeries(wb->GetCell(0, 2, 1, ObjectExt::Box<int32_t>(23)));
chart->get_ChartData()->get_Categories()->Add(wb->GetCell(0, 3, 0, ObjectExt::Box<String>(u"C3")));
series->get_DataPoints()->AddDataPointForLineSeries(wb->GetCell(0, 3, 1, ObjectExt::Box<int32_t>(-10)));
chart->get_ChartData()->get_Categories()->Add(wb->GetCell(0, 4, 0, ObjectExt::Box<String>(u"C4")));
series->get_DataPoints()->AddDataPointForLineSeries(wb->GetCell(0, 4, 1, nullptr));
chart->get_ChartData()->get_Series()->Add(wb->GetCell(0, 0, 2, ObjectExt::Box<String>(u"Series 2")), chart->get_Type());
// سطر دوم نمودار را میگیرد
auto series2 = chart->get_ChartData()->get_Series()->idx_get(1);
// دادههای سطر را پر میکند
series2->get_DataPoints()->AddDataPointForLineSeries(wb->GetCell(0, 1, 2, ObjectExt::Box<int32_t>(30)));
series2->get_DataPoints()->AddDataPointForLineSeries(wb->GetCell(0, 2, 2, ObjectExt::Box<int32_t>(10)));
series2->get_DataPoints()->AddDataPointForLineSeries(wb->GetCell(0, 3, 2, ObjectExt::Box<int32_t>(60)));
series2->get_DataPoints()->AddDataPointForLineSeries(wb->GetCell(0, 4, 2, ObjectExt::Box<int32_t>(40)));
chart->set_HasLegend(true);
chart->get_Legend()->set_Overlay(false);
pres->Save(dataDir + u"DefaultMarkersInChart.pptx", SaveFormat::Pptx);
پرسشهای متداول
کدام انواع نمودارها توسط Aspose.Slides پشتیبانی میشوند؟
Aspose.Slides طیف وسیعی از انواع نمودارها شامل میلهای، خطی، کیکی، مساحت، پراکنده، هیستوگرام، رادار و موارد دیگر را پشتیبانی میکند. این انعطافپذیری به شما امکان میدهد تا مناسبترین نوع نمودار را برای نیازهای تصویری دادههای خود انتخاب کنید.
چگونه یک نمودار جدید به اسلاید اضافه کنم؟
برای اضافه کردن یک نمودار، ابتدا یک نمونه از کلاس Presentation ایجاد کنید، اسلاید موردنظر را با استفاده از اندیس آن بازیابی کنید و سپس متد افزودن نمودار را صدا بزنید؛ در این مرحله نوع نمودار و دادههای اولیه را مشخص میکنید. این فرآیند نمودار را مستقیماً در ارائه شما ادغام میکند.
چگونه میتوان دادههای نمایشدادهشده در یک نمودار را بهروزرسانی کرد؟
میتوانید دادههای یک نمودار را با دسترسی به کتاب کار دادههای آن (IChartDataWorkbook)، پاککردن سطرها و دستههای پیشفرض و سپس افزودن دادههای سفارشی خود بهروزرسانی کنید. این امکان بهصورت برنامهای نمودار را برای بازتاب دادههای جدید تازهسازی میکند.
آیا امکان سفارشیسازی ظاهر نمودار وجود دارد؟
بله، Aspose.Slides گزینههای سفارشیسازی گستردهای ارائه میدهد. میتوانید رنگها، قلمها، برچسبها، لگندها و سایر عناصر قالببندی را تغییر دهید تا ظاهر نمودار را مطابق با نیازهای طراحی خاص خود تنظیم کنید.