
Python을 사용하여 PowerPoint 표의 행과 열 관리
소개
Aspose.Slides for Python via Java를 사용하면 Table 클래스를 통해 PowerPoint 프레젠테이션에서 표 구조와 서식을 관리할 수 있습니다. 헤더 행을 지정하고, 행과 열을 복제하거나 제거하며, 전체 행 또는 열에 텍스트 서식을 적용할 수 있습니다.
이 문서는 이러한 작업을 Python 예제와 함께 설명합니다. 또한 표의 스타일 프리셋을 검색하여 재사용하는 방법도 보여줍니다. 표 행 및 열 인덱스는 0부터 시작합니다.
행 높이 제어
Row.setMinimalHeight 메서드를 사용하여 행의 최소 높이를 포인트 단위로 설정합니다. 이는 하한값이며 고정 높이는 아닙니다. Row.getHeight 메서드는 실제 높이를 반환합니다. 행은 Table.getRows 메서드로 접근합니다.
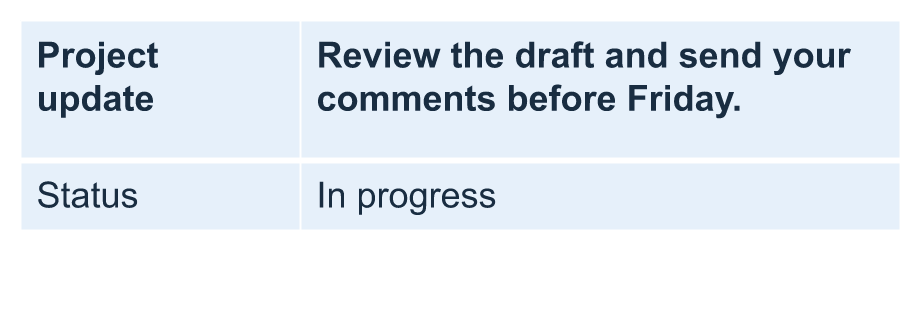
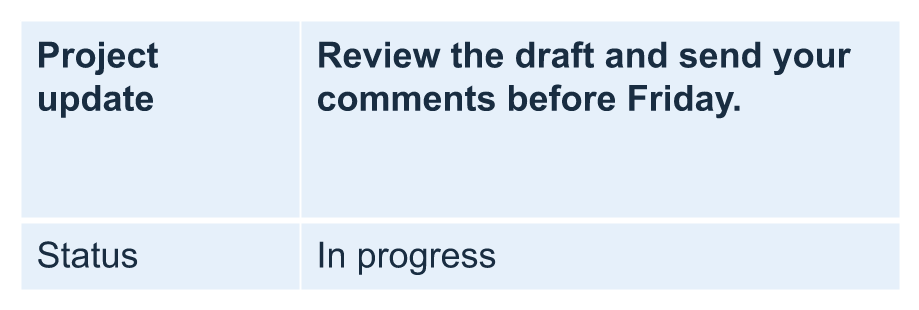
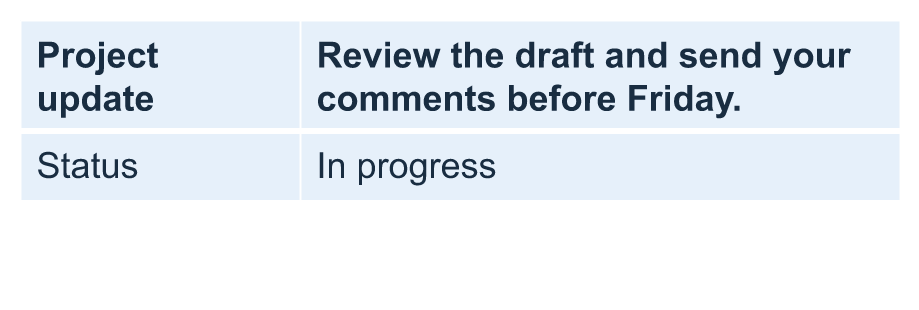
예제는 row-height-input.pptx 파일을 로드합니다. 이 파일은 첫 슬라이드의 첫 번째 도형으로 표를 포함하고 있습니다. 첫 번째 행은 70포인트에서 시작합니다. 셀은 18포인트 Arial 텍스트, 자동 줄바꿈, 위·아래 여백 6포인트를 사용하며, 두 번째 열의 긴 텍스트는 여러 줄로 자동 줄바꿈됩니다. 예제는 최소값을 100포인트로 증가시켰다가 20포인트로 감소시키고, 각 변경 후 실제 높이를 출력한 뒤 두 결과를 저장합니다.
import jpype
import asposeslides

if not jpype.isJVMStarted():
    jpype.startJVM()

from asposeslides.api import Presentation, SaveFormat

presentation = Presentation("row-height-input.pptx")
try:
    slide = presentation.getSlides().get_Item(0)

    table = slide.getShapes().get_Item(0)
    row = table.getRows().get_Item(0)

    row.setMinimalHeight(100)
    print(f"Increased: minimum = {row.getMinimalHeight():.1f}, actual = {row.getHeight():.1f} pt")
    presentation.save("row-height-increased.pptx", SaveFormat.Pptx)

    row.setMinimalHeight(20)
    print(f"Decreased: minimum = {row.getMinimalHeight():.1f}, actual = {row.getHeight():.1f} pt")
    presentation.save("row-height-decreased.pptx", SaveFormat.Pptx)
finally:
    presentation.dispose()
제공된 프레젠테이션에서 최소값을 늘리면 행에 공간이 추가됩니다. 최소값을 줄이면 그 추가 공간이 사라지지만, 텍스트와 셀 여백 때문에 실제 높이는 20포인트보다 크게 유지됩니다. 최소값만 줄여서는 내용이 요구하는 공간 이하로 행을 강제로 만들 수 없습니다.
실제 높이에 영향을 미치는 여러 요인:
- 텍스트 및 글꼴 크기: 긴 텍스트, 명시적 줄바꿈, 또는 큰 글꼴은 더 많은 수직 공간을 필요로 할 수 있습니다.
- 자동 줄바꿈 및 열 너비: 자동 줄바꿈이 활성화된 경우 Column.setWidth 로 열 너비를 줄이면 줄 수가 늘어납니다. 반대로 넓은 열은 수직 공간 요구를 줄일 수 있습니다.
- 셀 여백: Cell.setMarginTop 및 Cell.setMarginBottom 은 수직 여백을 추가합니다. Cell.setMarginLeft과 Cell.setMarginRight 은 텍스트에 사용할 수 있는 너비를 줄여 추가 줄바꿈을 유발할 수 있습니다.
병합 셀이 없는 이 표에서는 가장 많은 수직 공간을 필요로 하는 셀이 전체 행의 내용 기반 하한을 결정합니다. 행을 짧게 만들려면 텍스트 길이를 줄이거나 글꼴 크기·여백을 감소시키거나 열을 넓혀야 할 수도 있습니다.
아래 이미지는 동일한 표를 동일한 배율로 보여줍니다. 표시된 결과에서 실제 높이는 각각 70, 100, 55.2포인트였으며, 최종 행은 20포인트 최소값보다 높게 유지되었습니다. 정확한 텍스트 측정값은 환경에 설치된 글꼴에 따라 달라질 수 있습니다. 저장된 결과를 다운로드하세요: increased minimum 및 decreased minimum.
| 원본: 최소 70pt, 실제 70pt | 증가: 최소 100pt, 실제 100pt | 감소: 최소 20pt, 실제 55.2pt |
|---|---|---|
 |
 |
 |
첫 번째 행을 헤더로 설정
setFirstRow 메서드를 사용하여 첫 번째 행을 헤더 서식으로 표시합니다. 실제 모양은 표에 적용된 표 스타일에 따라 달라집니다.
- Presentation 클래스로 프레젠테이션을 로드합니다.
- 첫 번째 슬라이드에 액세스합니다.
- 슬라이드에서 첫 번째 도형으로 저장된 표에 액세스합니다.
- 해당 첫 번째 행에 헤더 서식을 활성화합니다.
- 수정된 프레젠테이션을 저장합니다.
예제는 첫 번째 슬라이드의 첫 번째 도형으로 표가 포함된 table.pptx 파일이 필요합니다. 첫 번째 행에 헤더 서식을 적용하고 First_row_header.pptx 로 저장합니다.
import jpype
import asposeslides

if not jpype.isJVMStarted():
    jpype.startJVM()

from asposeslides.api import Presentation, SaveFormat

presentation = Presentation("table.pptx")
try:
    slide = presentation.getSlides().get_Item(0)

    table = slide.getShapes().get_Item(0)
    table.setFirstRow(True)

    presentation.save("First_row_header.pptx", SaveFormat.Pptx)
finally:
    presentation.dispose()
표 행 또는 열 복제
행이나 열을 복제하여 내용과 서식을 재사용할 수 있습니다. 복제본을 표 끝에 추가하거나 특정 위치에 삽입할 수 있습니다.
- Presentation 클래스로 프레젠테이션을 로드합니다.
- 첫 번째 슬라이드에 액세스합니다.
- 열 너비와 행 높이를 정의합니다.
- addTable 메서드로 표를 추가합니다.
- 필요한 행을 복제합니다.
- 필요한 열을 복제합니다.
- 수정된 프레젠테이션을 저장합니다.
예제는 최소 하나의 슬라이드가 있는 Test.pptx 파일이 필요합니다. 세 개의 열과 다섯 개의 행을 포인트 단위 크기로 만든 뒤, 첫 번째 행·열을 복제하여 표 끝에 추가하고, 두 번째 행·열을 인덱스 3(네 번째 위치)에 삽입합니다. 결과 표는 7행 5열이 됩니다. False 인자는 인접 병합 행·열에 대한 복제를 비활성화합니다; 이 표에는 병합 셀이 없습니다.
import jpype
import asposeslides

if not jpype.isJVMStarted():
    jpype.startJVM()

from asposeslides.api import Presentation, SaveFormat

presentation = Presentation("Test.pptx")
try:
    slide = presentation.getSlides().get_Item(0)

    column_widths = jpype.JArray(jpype.JDouble)([50, 50, 50])
    row_heights = jpype.JArray(jpype.JDouble)([50, 30, 30, 30, 30])
    table = slide.getShapes().addTable(100, 50, column_widths, row_heights)

    table.get_Item(0, 0).getTextFrame().setText("Row 1 Cell 1")
    table.get_Item(1, 0).getTextFrame().setText("Row 1 Cell 2")
    table.getRows().addClone(table.getRows().get_Item(0), False)

    table.get_Item(0, 1).getTextFrame().setText("Row 2 Cell 1")
    table.get_Item(1, 1).getTextFrame().setText("Row 2 Cell 2")
    table.getRows().insertClone(3, table.getRows().get_Item(1), False)

    table.getColumns().addClone(table.getColumns().get_Item(0), False)
    table.getColumns().insertClone(3, table.getColumns().get_Item(1), False)

    presentation.save("table_out.pptx", SaveFormat.Pptx)
finally:
    presentation.dispose()
표에서 행 또는 열 제거
표에서 더 이상 필요하지 않은 행이나 열을 제거합니다. 항목을 제거하면 뒤따르는 행·열의 인덱스가 이동합니다.
- Presentation 클래스로 프레젠테이션을 생성합니다.
- 첫 번째 슬라이드에 액세스합니다.
- 열 너비와 행 높이를 정의합니다.
- addTable 메서드로 표를 추가합니다.
- 두 번째 행과 두 번째 열을 제거합니다.
- 수정된 프레젠테이션을 저장합니다.
이 예제는 3×3 표를 만든 뒤 인덱스 1에 위치한 행·열을 제거하여 TestTable_out.pptx 에 2×2 표를 남깁니다. 크기는 포인트 단위이며, False 인자는 인접 병합 행·열의 제거를 비활성화합니다; 이 표에도 병합 셀이 없습니다.
import jpype
import asposeslides

if not jpype.isJVMStarted():
    jpype.startJVM()

from asposeslides.api import Presentation, SaveFormat

presentation = Presentation()
try:
    slide = presentation.getSlides().get_Item(0)

    column_widths = jpype.JArray(jpype.JDouble)([100, 50, 30])
    row_heights = jpype.JArray(jpype.JDouble)([30, 50, 30])
    table = slide.getShapes().addTable(100, 100, column_widths, row_heights)

    table.getRows().removeAt(1, False)
    table.getColumns().removeAt(1, False)

    presentation.save("TestTable_out.pptx", SaveFormat.Pptx)
finally:
    presentation.dispose()
표 행 수준에서 텍스트 서식 설정
전체 행에 텍스트 서식을 적용하여 셀을 일관되게 유지합니다. 개별 셀을 일일이 서식 지정하지 않고도 글꼴 속성, 단락 서식, 텍스트 방향 등을 설정할 수 있습니다.
- Presentation 클래스로 프레젠테이션을 로드합니다.
- 첫 번째 슬라이드의 표에 액세스합니다.
- 첫 번째 행에 대해 setFontHeight 를 사용합니다.
- 첫 번째 행에 대해 setAlignment 및 setMarginRight 을 사용합니다.
- 두 번째 행에 대해 setTextVerticalType 를 사용합니다.
- 수정된 프레젠테이션을 저장합니다.
예제는 첫 번째 슬라이드의 첫 번째 도형에 표가 포함되고 최소 두 행이 있는 table.pptx 파일이 필요합니다. 첫 번째 행에 25포인트 텍스트, 오른쪽 정렬, 오른쪽 단락 여백 20포인트를 적용하고, 두 번째 행에 수직 텍스트를 설정합니다.
import jpase
import asposeslides

if not jpype.isJVMStarted():
    jpype.startJVM()

from asposeslides.api import Presentation, SaveFormat, PortionFormat, ParagraphFormat, TextFrameFormat, TextAlignment, TextVerticalType

presentation = Presentation("table.pptx")
try:
    slide = presentation.getSlides().get_Item(0)

    table = slide.getShapes().get_Item(0)

    portion_format = PortionFormat()
    portion_format.setFontHeight(25)
    table.getRows().get_Item(0).setTextFormat(portion_format)

    paragraph_format = ParagraphFormat()
    paragraph_format.setAlignment(TextAlignment.Right)
    paragraph_format.setMarginRight(20)
    table.getRows().get_Item(0).setTextFormat(paragraph_format)

    text_frame_format = TextFrameFormat()
    text_frame_format.setTextVerticalType(TextVerticalType.Vertical)
    table.getRows().get_Item(1).setTextFormat(text_frame_format)

    presentation.save("row_formatting.pptx", SaveFormat.Pptx)
finally:
    presentation.dispose()
표 열 수준에서 텍스트 서식 설정
전체 열에 텍스트 서식을 적용하여 셀을 일관되게 유지합니다. 개별 셀을 일일이 서식 지정하지 않고도 글꼴 속성, 단락 서식, 텍스트 방향 등을 설정할 수 있습니다.
- Presentation 클래스로 프레젠테이션을 로드합니다.
- 첫 번째 슬라이드의 표에 액세스합니다.
- 첫 번째 열에 대해 setFontHeight 를 사용합니다.
- 첫 번째 열에 대해 setAlignment 및 setMarginRight 을 사용합니다.
- 두 번째 열에 대해 setTextVerticalType 를 사용합니다.
- 수정된 프레젠테이션을 저장합니다.
예제는 첫 번째 슬라이드의 첫 번째 도형에 표가 포함되고 최소 두 열이 있는 table.pptx 파일이 필요합니다. 첫 번째 열에 25포인트 텍스트, 오른쪽 정렬, 오른쪽 단락 여백 20포인트를 적용하고, 두 번째 열에 수직 텍스트를 설정합니다.
import jpype
import asposeslides

if not jpype.isJVMStarted():
    jpype.startJVM()

from asposeslides.api import Presentation, SaveFormat, PortionFormat, ParagraphFormat, TextFrameFormat, TextAlignment, TextVerticalType

presentation = Presentation("table.pptx")
try:
    slide = presentation.getSlides().get_Item(0)

    table = slide.getShapes().get_Item(0)

    portion_format = PortionFormat()
    portion_format.setFontHeight(25)
    table.getColumns().get_Item(0).setTextFormat(portion_format)

    paragraph_format = ParagraphFormat()
    paragraph_format.setAlignment(TextAlignment.Right)
    paragraph_format.setMarginRight(20)
    table.getColumns().get_Item(0).setTextFormat(paragraph_format)

    text_frame_format = TextFrameFormat()
    text_frame_format.setTextVerticalType(TextVerticalType.Vertical)
    table.getColumns().get_Item(1).setTextFormat(text_frame_format)

    presentation.save("column_formatting.pptx", SaveFormat.Pptx)
finally:
    presentation.dispose()
표 스타일 속성 가져오기
getStylePreset 메서드를 사용하면 표에 적용된 프리셋을 검색하고 다른 표에 재사용할 수 있습니다. 이는 개별 셀 서식 재정의를 넘어 프리셋 자체를 식별합니다.
예제는 표를 만든 뒤 TableStylePreset.DarkStyle1 을 적용하고 프리셋을 다시 읽어옵니다. DarkStyle1 에 해당하는 정수 값을 출력하고 표를 table.pptx 로 저장합니다.
import jpype
import asposeslides

if not jpype.isJVMStarted():
    jpype.startJVM()

from asposeslides.api import Presentation, SaveFormat, TableStylePreset

presentation = Presentation()
try:
    slide = presentation.getSlides().get_Item(0)

    column_widths = jpype.JArray(jpype.JDouble)([100, 150])
    row_heights = jpype.JArray(jpype.JDouble)([5, 5, 5])
    table = slide.getShapes().addTable(10, 10, column_widths, row_heights)
    table.setStylePreset(TableStylePreset.DarkStyle1)

    style_preset = table.getStylePreset()
    print(style_preset)

    presentation.save("table.pptx", SaveFormat.Pptx)
finally:
    presentation.dispose()
FAQ
Can I apply PowerPoint themes/styles to a table that’s already created?
예. 표는 슬라이드/레이아웃/마스터 테마를 상속받으며, 그 위에 채우기, 테두리, 텍스트 색상을 별도로 오버라이드할 수 있습니다.
Can I sort table rows like in Excel?
아니요. Aspose.Slides 표에는 내장된 정렬이나 필터 기능이 없습니다. 데이터를 메모리에서 먼저 정렬한 뒤 해당 순서대로 표 행을 다시 채워야 합니다.
Can I have banded (striped) columns while keeping custom colors on specific cells?
예. 밴드 열을 활성화한 뒤 특정 셀에 로컬 서식을 적용하면 셀 수준 서식이 표 스타일보다 우선합니다.