
จัดการแถวและคอลัมน์ในตาราง PowerPoint ด้วย Python
บทนำ
Aspose.Slides for Python via Java ให้คุณจัดการโครงสร้างตารางและการจัดรูปแบบในงานนำเสนอ PowerPoint ผ่านคลาส Table คุณสามารถกำหนดแถวหัวเรื่อง, คัดลอกหรือเอาแถวและคอลัมน์ออก, และใช้การจัดรูปแบบข้อความกับแถวหรือคอลัมน์ทั้งหมด
บทความนี้อธิบายการดำเนินการเหล่านี้ด้วยตัวอย่าง Python นอกจากนี้ยังแสดงวิธีดึงสไตล์พรีเซ็ตของตารางเพื่อให้คุณสามารถนำกลับมาใช้ใหม่ได้ ดัชนีแถวและคอลัมน์ของตารางเริ่มจากศูนย์
ควบคุมความสูงของแถว
ใช้ Row.setMinimalHeight เพื่อกำหนดความสูงต่ำสุดของแถวในหน่วยพอยท์ ซึ่งเป็นค่าขอบล่าง ไม่ใช่ความสูงคงที่ Row.getHeight จะคืนค่าความสูงจริง เข้าถึงแถวผ่าน Table.getRows
ตัวอย่างโหลดไฟล์ row-height-input.pptx ซึ่งมีตารางเป็นรูปร่างแรกบนสไลด์แรก แถวแรกเริ่มที่ 70 พอยท์ เซลล์ใช้ข้อความ Arial ขนาด 18 พอยท์, มีการตัดบรรทัดและระยะขอบบนและล่าง 6 พอยท์; ข้อความที่ยาวกว่าในคอลัมน์ที่สองตัดบรรทัดเป็นหลายบรรทัด ตัวอย่างเพิ่มค่าต่ำสุดเป็น 100 พอยท์ จากนั้นลดลงเป็น 20 พอยท์ พิมพ์ความสูงจริงหลังการเปลี่ยนแปลงแต่ละครั้งและบันทึกผลลัพธ์ทั้งสอง
import jpype
import asposeslides

if not jpype.isJVMStarted():
    jpype.startJVM()

from asposeslides.api import Presentation, SaveFormat

presentation = Presentation("row-height-input.pptx")
try:
    slide = presentation.getSlides().get_Item(0)

    table = slide.getShapes().get_Item(0)
    row = table.getRows().get_Item(0)

    row.setMinimalHeight(100)
    print(f"Increased: minimum = {row.getMinimalHeight():.1f}, actual = {row.getHeight():.1f} pt")
    presentation.save("row-height-increased.pptx", SaveFormat.Pptx)

    row.setMinimalHeight(20)
    print(f"Decreased: minimum = {row.getMinimalHeight():.1f}, actual = {row.getHeight():.1f} pt")
    presentation.save("row-height-decreased.pptx", SaveFormat.Pptx)
finally:
    presentation.dispose()
โดยใช้งานนำเสนอที่ให้มา การเพิ่มค่าต่ำสุดจะเพิ่มพื้นที่ให้กับแถว การลดค่าต่ำสุดจะลบพื้นที่เพิ่มเติมออก แต่ความสูงจริงยังคงมากกว่า 20 พอยท์เนื่องจากข้อความและระยะขอบของเซลล์ต้องการพื้นที่มากกว่า การลดค่าต่ำสุดเพียงอย่างเดียวไม่สามารถบังคับให้แถวต่ำกว่าพื้นที่ที่เนื้อหาต้องการได้
หลายปัจจัยส่งผลต่อความสูงจริง:
- ข้อความและขนาดฟอนต์: ข้อความยาว, การขึ้นบรรทัดใหม่โดยเจตนา, หรือฟอนต์ขนาดใหญ่กว่าสามารถต้องการพื้นที่แนวตั้งเพิ่มขึ้น
- การตัดบรรทัดและความกว้างของคอลัมน์: เมื่อเปิดใช้งานการตัดบรรทัด การลดความกว้างของคอลัมน์ด้วย Column.setWidth สามารถทำให้เกิดบรรทัดมากขึ้น คอลัมน์กว้างกว่าอาจลดพื้นที่ที่ต้องการในแนวตั้ง
- ระยะขอบของเซลล์: Cell.setMarginTop และ Cell.setMarginBottom เพิ่มพื้นที่แนวตั้ง Cell.setMarginLeft และ Cell.setMarginRight ลดความกว้างที่ใช้สำหรับข้อความและอาจทำให้เกิดการตัดบรรทัดเพิ่มเติม
สำหรับตารางนี้ที่ไม่มีเซลล์ผสาน เซลล์ที่ต้องการพื้นที่แนวตั้งสูงสุดจะกำหนดขอบล่างที่ขับเคลื่อนโดยเนื้อหาให้กับแถวทั้งหมด หากต้องการทำให้แถวสั้นลง คุณอาจต้องย่อข้อความ, ลดขนาดฟอนต์หรือระยะขอบ, หรือทำคอลัมน์กว้างขึ้น
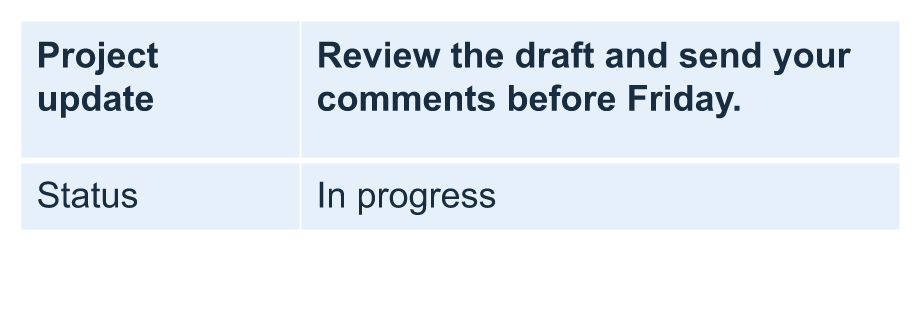
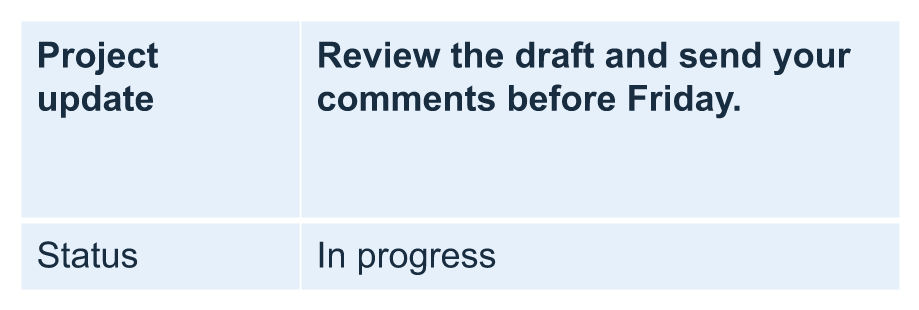
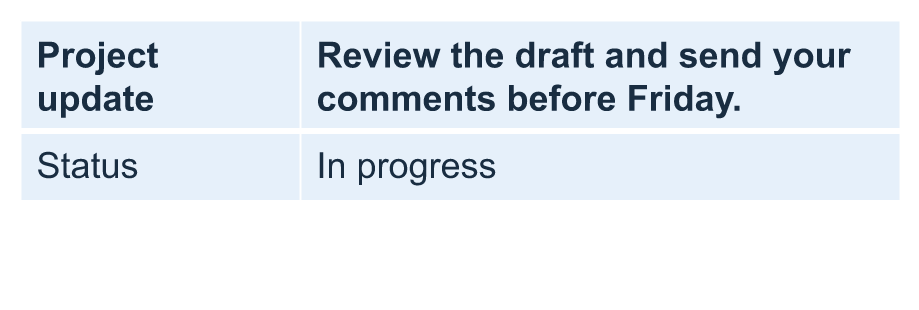
ภาพด้านล่างแสดงตารางเดียวกันในสเกลเดียวกัน ในผลลัพธ์ที่แสดง ความสูงจริงคือ 70, 100, และ 55.2 พอยท์: แถวสุดท้ายยังคงสูงกว่าค่าต่ำสุด 20 พอยท์ การวัดข้อความที่แม่นยำอาจแตกต่างกันตามฟอนต์ที่มีในสภาพแวดล้อมของคุณ ดาวน์โหลดผลลัพธ์ที่บันทึกไว้: increased minimum และ decreased minimum
| ต้นฉบับ: ค่าต่ำสุด 70 pt, ความสูงจริง 70 pt | เพิ่มขึ้น: ค่าต่ำสุด 100 pt, ความสูงจริง 100 pt | ลดลง: ค่าต่ำสุด 20 pt, ความสูงจริง 55.2 pt |
|---|---|---|
 |
 |
 |
ตั้งค่าแถวแรกเป็นหัวเรื่อง
ใช้เมธอด setFirstRow เพื่อทำเครื่องหมายแถวแรกให้เป็นการจัดรูปแบบหัวเรื่อง รูปลักษณ์ของแถวจะขึ้นอยู่กับสไตล์ตารางที่นำไปใช้กับตาราง
- โหลดงานนำเสนอด้วยคลาส Presentation
- เข้าถึงสไลด์แรก
- เข้าถึงตารางซึ่งเก็บเป็นรูปร่างแรกบนสไลด์
- เปิดใช้งานการจัดรูปแบบหัวเรื่องสำหรับแถวแรก
- บันทึกงานนำเสนอที่แก้ไขแล้ว
ตัวอย่างต้องการไฟล์ table.pptx ที่มีตารางเป็นรูปร่างแรกบนสไลด์แรก มันเปิดใช้งานการจัดรูปแบบหัวเรื่องสำหรับแถวแรกและบันทึกเป็น First_row_header.pptx
import jpype
import asposeslides

if not jpype.isJVMStarted():
    jpype.startJVM()

from asposeslides.api import Presentation, SaveFormat

presentation = Presentation("table.pptx")
try:
    slide = presentation.getSlides().get_Item(0)

    table = slide.getShapes().get_Item(0)
    table.setFirstRow(True)

    presentation.save("First_row_header.pptx", SaveFormat.Pptx)
finally:
    presentation.dispose()
คัดลอกแถวหรือคอลัมน์ของตาราง
คัดลอกแถวหรือคอลัมน์เพื่อใช้เนื้อหาและการจัดรูปแบบซ้ำได้ คุณสามารถผนวกสำเนาไปที่ท้ายตารางหรือแทรกที่ตำแหน่งที่ระบุ
- โหลดงานนำเสนอด้วยคลาส Presentation
- เข้าถึงสไลด์แรก
- กำหนดความกว้างของคอลัมน์และความสูงของแถว
- เพิ่มตารางด้วยเมธอด addTable
- คัดลอกแถวที่ต้องการ
- คัดลอกคอลัมน์ที่ต้องการ
- บันทึกงานนำเสนอที่แก้ไขแล้ว
ตัวอย่างต้องการไฟล์ Test.pptx ที่มีอย่างน้อยหนึ่งสไลด์ มันสร้างตารางที่มีสามคอลัมน์และห้าแถวโดยระบุขนาดเป็นพอยท์ มันผนวกสำเนาของแถวแรกและคอลัมน์แรก จากนั้นแทรกสำเนาของแถวและคอลัมน์ที่สองที่ตำแหน่งดัชนี 3 (ตำแหน่งที่สี่) ตารางที่ได้จะมีเจ็ดแถวและห้าคอลัมน์ อาร์กิวเมนต์ False ปิดการคัดลอกไปยังแถวหรือคอลัมน์ที่ผสานอยู่ใกล้เคียง; ตารางนี้ไม่มีเซลล์ผสาน
import jpype
import asposeslides

if not jpype.isJVMStarted():
    jpype.startJVM()

from asposeslides.api import Presentation, SaveFormat

presentation = Presentation("Test.pptx")
try:
    slide = presentation.getSlides().get_Item(0)

    column_widths = jpype.JArray(jpype.JDouble)([50, 50, 50])
    row_heights = jpype.JArray(jpype.JDouble)([50, 30, 30, 30, 30])
    table = slide.getShapes().addTable(100, 50, column_widths, row_heights)

    table.get_Item(0, 0).getTextFrame().setText("Row 1 Cell 1")
    table.get_Item(1, 0).getTextFrame().setText("Row 1 Cell 2")
    table.getRows().addClone(table.getRows().get_Item(0), False)

    table.get_Item(0, 1).getTextFrame().setText("Row 2 Cell 1")
    table.get_Item(1, 1).getTextFrame().setText("Row 2 Cell 2")
    table.getRows().insertClone(3, table.getRows().get_Item(1), False)

    table.getColumns().addClone(table.getColumns().get_Item(0), False)
    table.getColumns().insertClone(3, table.getColumns().get_Item(1), False)

    presentation.save("table_out.pptx", SaveFormat.Pptx)
finally:
    presentation.dispose()
ลบแถวหรือคอลัมน์จากตาราง
ลบแถวหรือคอลัมน์ที่ไม่จำเป็นออกจากตาราง การลบรายการจะส่งผลให้ดัชนีของแถวหรือคอลัมน์ที่ตามมาถูกย้ายตำแหน่ง
- สร้างงานนำเสนอด้วยคลาส Presentation
- เข้าถึงสไลด์แรก
- กำหนดความกว้างของคอลัมน์และความสูงของแถว
- เพิ่มตารางด้วยเมธอด addTable
- ลบแถวที่สองและคอลัมน์ที่สอง
- บันทึกงานนำเสนอที่แก้ไขแล้ว
ตัวอย่างนี้สร้างตารางสามในสามและลบแถวและคอลัมน์ที่ดัชนี 1 เหลือเป็นตารางสองในสองในไฟล์ TestTable_out.pptx ขนาดเป็นพอยท์ อาร์กิวเมนต์ False ปิดการลบแถวหรือคอลัมน์ที่ผสานอยู่ใกล้เคียง; ตารางนี้ไม่มีเซลล์ผสาน
import jpype
import asposeslides

if not jpype.isJVMStarted():
    jpype.startJVM()

from asposeslides.api import Presentation, SaveFormat

presentation = Presentation()
try:
    slide = presentation.getSlides().get_Item(0)

    column_widths = jpype.JArray(jpype.JDouble)([100, 50, 30])
    row_heights = jpype.JArray(jpype.JDouble)([30, 50, 30])
    table = slide.getShapes().addTable(100, 100, column_widths, row_heights)

    table.getRows().removeAt(1, False)
    table.getColumns().removeAt(1, False)

    presentation.save("TestTable_out.pptx", SaveFormat.Pptx)
finally:
    presentation.dispose()
ตั้งค่าการจัดรูปแบบข้อความระดับแถวของตาราง
ใช้การจัดรูปแบบข้อความกับแถวทั้งหมดเพื่อให้เซลล์มีลักษณะสอดคล้องกัน คุณสามารถตั้งค่าลักษณะฟอนต์, การจัดรูปแบบย่อหน้า, และทิศทางข้อความโดยไม่ต้องจัดรูปแบบแต่ละเซลล์แยกกัน
- โหลดงานนำเสนอด้วยคลาส Presentation
- เข้าถึงตารางบนสไลด์แรก
- ใช้ setFontHeight สำหรับแถวแรก
- ใช้ setAlignment และ setMarginRight สำหรับแถวแรก
- ใช้ setTextVerticalType สำหรับแถวที่สอง
- บันทึกงานนำเสนอที่แก้ไขแล้ว
ตัวอย่างต้องการไฟล์ table.pptx ที่มีตารางเป็นรูปร่างแรกบนสไลด์แรกและมีอย่างน้อยสองแถว มันใช้ข้อความขนาด 25 พอยท์, จัดแนวขวา, และตั้งระยะขอบย่อหน้าขวา 20 พอยท์สำหรับแถวแรก แล้วตั้งค่าข้อความแนวตั้งในแถวที่สอง
import jpype
import asposeslides

if not jpype.isJVMStarted():
    jpype.startJVM()

from asposeslides.api import Presentation, SaveFormat, PortionFormat, ParagraphFormat, TextFrameFormat, TextAlignment, TextVerticalType

presentation = Presentation("table.pptx")
try:
    slide = presentation.getSlides().get_Item(0)

    table = slide.getShapes().get_Item(0)

    portion_format = PortionFormat()
    portion_format.setFontHeight(25)
    table.getRows().get_Item(0).setTextFormat(portion_format)

    paragraph_format = ParagraphFormat()
    paragraph_format.setAlignment(TextAlignment.Right)
    paragraph_format.setMarginRight(20)
    table.getRows().get_Item(0).setTextFormat(paragraph_format)

    text_frame_format = TextFrameFormat()
    text_frame_format.setTextVerticalType(TextVerticalType.Vertical)
    table.getRows().get_Item(1).setTextFormat(text_frame_format)

    presentation.save("row_formatting.pptx", SaveFormat.Pptx)
finally:
    presentation.dispose()
ตั้งค่าการจัดรูปแบบข้อความระดับคอลัมน์ของตาราง
ใช้การจัดรูปแบบข้อความกับคอลัมน์ทั้งหมดเพื่อให้เซลล์มีลักษณะสอดคล้องกัน คุณสามารถตั้งค่าลักษณะฟอนต์, การจัดรูปแบบย่อหน้า, และทิศทางข้อความโดยไม่ต้องจัดรูปแบบแต่ละเซลล์แยกกัน
- โหลดงานนำเสนอด้วยคลาส Presentation
- เข้าถึงตารางบนสไลด์แรก
- ใช้ setFontHeight สำหรับคอลัมน์แรก
- ใช้ setAlignment และ setMarginRight สำหรับคอลัมน์แรก
- ใช้ setTextVerticalType สำหรับคอลัมน์ที่สอง
- บันทึกงานนำเสนอที่แก้ไขแล้ว
ตัวอย่างต้องการไฟล์ table.pptx ที่มีตารางเป็นรูปร่างแรกบนสไลด์แรกและมีอย่างน้อยสองคอลัมน์ มันใช้ข้อความขนาด 25 พอยท์, จัดแนวขวา, และตั้งระยะขอบย่อหน้าขวา 20 พอยท์สำหรับคอลัมน์แรก แล้วตั้งค่าข้อความแนวตั้งในคอลัมน์ที่สอง
import jpype
import asposeslides

if not jpype.isJVMStarted():
    jpype.startJVM()

from asposeslides.api import Presentation, SaveFormat, PortionFormat, ParagraphFormat, TextFrameFormat, TextAlignment, TextVerticalType

presentation = Presentation("table.pptx")
try:
    slide = presentation.getSlides().get_Item(0)

    table = slide.getShapes().get_Item(0)

    portion_format = PortionFormat()
    portion_format.setFontHeight(25)
    table.getColumns().get_Item(0).setTextFormat(portion_format)

    paragraph_format = ParagraphFormat()
    paragraph_format.setAlignment(TextAlignment.Right)
    paragraph_format.setMarginRight(20)
    table.getColumns().get_Item(0).setTextFormat(paragraph_format)

    text_frame_format = TextFrameFormat()
    text_frame_format.setTextVerticalType(TextVerticalType.Vertical)
    table.getColumns().get_Item(1).setTextFormat(text_frame_format)

    presentation.save("column_formatting.pptx", SaveFormat.Pptx)
finally:
    presentation.dispose()
รับคุณสมบัติสไตล์ของตาราง
ใช้เมธอด getStylePreset เพื่อดึงพรีเซ็ตที่ใช้กับตารางและนำไปใช้ซ้ำกับตารางอื่น วิธีนี้จะระบุพรีเซ็ตแทนการตั้งค่าการจัดรูปแบบเซลล์แต่ละเซลล์แบบโอเวอร์ไรด์
ตัวอย่างสร้างตาราง, ใช้ TableStylePreset.DarkStyle1, แล้วอ่านพรีเซ็ตกลับมา พิมพ์ค่าเต็มจำนวนที่สอดคล้องกับ DarkStyle1 และบันทึกตารางในไฟล์ table.pptx
import jpype
import asposeslides

if not jpype.isJVMStarted():
    jpype.startJVM()

from asposeslides.api import Presentation, SaveFormat, TableStylePreset

presentation = Presentation()
try:
    slide = presentation.getSlides().get_Item(0)

    column_widths = jpype.JArray(jpype.JDouble)([100, 150])
    row_heights = jpype.JArray(jpype.JDouble)([5, 5, 5])
    table = slide.getShapes().addTable(10, 10, column_widths, row_heights)
    table.setStylePreset(TableStylePreset.DarkStyle1)

    style_preset = table.getStylePreset()
    print(style_preset)

    presentation.save("table.pptx", SaveFormat.Pptx)
finally:
    presentation.dispose()
คำถามที่พบบ่อย
ฉันสามารถใช้ธีม/สไตล์ PowerPoint กับตารางที่สร้างแล้วได้หรือไม่?
ได้ ตารางสืบทอดธีมสไลด์/เลย์เอาต์/มาสเตอร์ และคุณยังสามารถทำการโอเวอร์ไรด์การเติมสี, เส้นขอบ, และสีข้อความเหนือธีมนั้นได้
ฉันสามารถจัดเรียงแถวของตารางเหมือนใน Excel ได้หรือไม่?
ไม่ได้ ตารางของ Aspose.Slides ไม่มีการจัดเรียงหรือฟิลเตอร์ในตัว ต้องจัดเรียงข้อมูลในหน่วยความจำก่อนแล้วจึงเติมแถวตารางใหม่ตามลำดับนั้น
ฉันสามารถมีคอลัมน์แบบแถบสี (striped) พร้อมคงสีที่กำหนดเองในเซลล์เฉพาะได้หรือไม่?
ได้ เปิดใช้งานคอลัมน์แบบแถบสี แล้วทำการโอเวอร์ไรด์เซลล์เฉพาะด้วยการจัดรูปแบบท้องถิ่น; การจัดรูปแบบระดับเซลล์จะมีลำดับความสำคัญเหนือสไตล์ของตาราง