
在 C++ 簡報圖表中加入趨勢線
概述
本文說明如何使用 Aspose.Slides 為簡報圖表加入趨勢線。它展示了如何建立圖表、將趨勢線加入圖表系列,並使用多種趨勢線類型,包括指數、線性、對數、移動平均、多項式和冪次。
此外,還說明如何透過插入線條形狀為圖表加入自訂線,並包含一段關於前向與後向趨勢線延伸值以及趨勢線在匯出為 PDF 或 SVG、以及將圖表渲染為影像時是否會保留的簡短 FAQ。
新增趨勢線
使用 ITrendlineCollection::Add 為圖表系列加入趨勢線,並以 TrendlineType 指定其類型。範例建立一個具有預設資料的群組柱狀圖,並為其三個系列中的每一個加入兩條趨勢線。
指數趨勢線透過 ITrendline::set_DisplayEquation 與 ITrendline::set_DisplayRSquaredValue 隱藏其方程式與 R 平方值;線性趨勢線則以紅色顯示。對數趨勢線使用 IOverridableText::AddTextFrameForOverriding 加入自訂標籤。移動平均趨勢線透過 ITrendline::set_Period 以三個資料點取平均,並使用 ITrendline::set_TrendlineName 設定自訂名稱。
多項式趨勢線使用 ITrendline::set_Order 設定階數為三,並透過 ITrendline::set_Forward 向前延伸一個類別。冪次趨勢線則透過 ITrendline::set_Backward 向後延伸一個類別。
#include <system/shared_ptr.h>
#include <drawing/color.h>
#include <DOM/Presentation.h>
#include <DOM/ISlide.h>
#include <DOM/IShapeCollection.h>
#include <DOM/ILineFormat.h>
#include <DOM/IFillFormat.h>
#include <DOM/IColorFormat.h>
#include <DOM/FillType.h>
#include <DOM/IChart.h>
#include <DOM/Chart/ChartType.h>
#include <DOM/Chart/IChartData.h>
#include <DOM/Chart/IChartSeries.h>
#include <DOM/Chart/IChartSeriesCollection.h>
#include <DOM/Chart/ITrendline.h>
#include <DOM/Chart/ITrendlineCollection.h>
#include <DOM/Chart/TrendlineType.h>
#include <DOM/Chart/IFormat.h>
#include <Export/SaveFormat.h>

using namespace System;
using namespace System::Drawing;
using namespace Aspose::Slides;
using namespace Aspose::Slides::Charts;
using namespace Aspose::Slides::Export;

auto presentation = MakeObject<Presentation>();
auto slide = presentation->get_Slide(0);

auto chart = slide->get_Shapes()->AddChart(ChartType::ClusteredColumn, 20, 20, 500, 400);

auto firstSeries = chart->get_ChartData()->get_Series()->idx_get(0);

auto exponentialTrendline = firstSeries->get_TrendLines()->Add(TrendlineType::Exponential);
exponentialTrendline->set_DisplayEquation(false);
exponentialTrendline->set_DisplayRSquaredValue(false);

auto linearTrendline = firstSeries->get_TrendLines()->Add(TrendlineType::Linear);
linearTrendline->get_Format()->get_Line()->get_FillFormat()->set_FillType(FillType::Solid);
linearTrendline->get_Format()->get_Line()->get_FillFormat()->get_SolidFillColor()->set_Color(Color::get_Red());

auto secondSeries = chart->get_ChartData()->get_Series()->idx_get(1);

auto logarithmicTrendline = secondSeries->get_TrendLines()->Add(TrendlineType::Logarithmic);
logarithmicTrendline->AddTextFrameForOverriding(u"New log trend line");

auto movingAverageTrendline = secondSeries->get_TrendLines()->Add(TrendlineType::MovingAverage);
movingAverageTrendline->set_Period(3);
movingAverageTrendline->set_TrendlineName(u"New TrendLine Name");

auto thirdSeries = chart->get_ChartData()->get_Series()->idx_get(2);

auto polynomialTrendline = thirdSeries->get_TrendLines()->Add(TrendlineType::Polynomial);
polynomialTrendline->set_Forward(1);
polynomialTrendline->set_Order(3);

auto powerTrendline = thirdSeries->get_TrendLines()->Add(TrendlineType::Power);
powerTrendline->set_Backward(1);

presentation->Save(u"ChartTrendLines.pptx", SaveFormat::Pptx);
設定趨勢線截距
使用 ITrendline::set_Intercept 可將趨勢線的 Y 值固定於 X = 0。此設定支援線性、指數與多項式趨勢線。
例如,生產成本模型可能需要在已知固定成本 100 的情況下開始,即使在非零產量的測量結果暗示不同的基線。對於線性趨勢線而言,固定截距會將方程式 y = ax + b 的 b 约束為 100;斜率會在此限制下擬合資料。這不會僅僅移動已擬合的線。座標軸交叉設定控制圖表座標軸的相交位置,而不是已擬合趨勢線的係數。
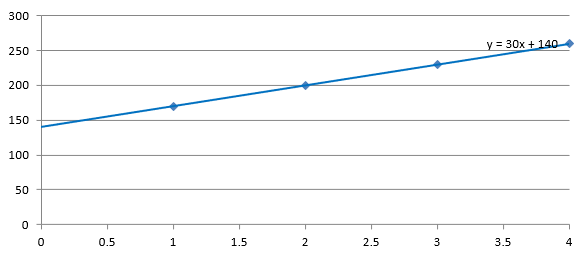
下列範例建立一個散佈 (XY) 圖表,產量從 1 到 4,成本分別為 170、200、230 與 260。它先以預設自動截距儲存圖表,然後將截距設定為 100,再儲存第二個 PPTX。兩個檔案僅在截距設定上有所不同。趨勢線會顯示其方程式並延伸回 X = 0。
#include <system/shared_ptr.h>
#include <system/object_ext.h>
#include <DOM/Chart/IChartDataWorkbook.h>
#include <DOM/Chart/IChartDataCell.h>
#include <DOM/Chart/IChartCategoryCollection.h>
#include <DOM/Chart/IChartDataPointCollection.h>
#include <DOM/Presentation.h>
#include <DOM/ISlide.h>
#include <DOM/IShapeCollection.h>
#include <DOM/IChart.h>
#include <DOM/Chart/ChartType.h>
#include <DOM/Chart/IChartData.h>
#include <DOM/Chart/IChartSeries.h>
#include <DOM/Chart/IChartSeriesCollection.h>
#include <DOM/Chart/ITrendline.h>
#include <DOM/Chart/ITrendlineCollection.h>
#include <DOM/Chart/TrendlineType.h>
#include <Export/SaveFormat.h>

using namespace System;
using namespace Aspose::Slides;
using namespace Aspose::Slides::Charts;
using namespace Aspose::Slides::Export;

auto presentation = MakeObject<Presentation>();
auto slide = presentation->get_Slide(0);

auto chart = slide->get_Shapes()->AddChart(ChartType::ScatterWithMarkers, 20, 20, 480, 210);
chart->set_HasLegend(false);

chart->get_ChartData()->get_Series()->Clear();
chart->get_ChartData()->get_Categories()->Clear();

auto workbook = chart->get_ChartData()->get_ChartDataWorkbook();
workbook->Clear(0);

auto nameCell = workbook->GetCell(0, 0, 1, ObjectExt::Box<String>(u"Production cost"));
auto series = chart->get_ChartData()->get_Series()->Add(nameCell, ChartType::ScatterWithMarkers);
const double costs[] = { 170, 200, 230, 260 };

for (auto i = 0; i < 4; i++)
{
    auto xCell = workbook->GetCell(0, i + 1, 0, ObjectExt::Box<int32_t>(i + 1));
    auto yCell = workbook->GetCell(0, i + 1, 1, ObjectExt::Box<double>(costs[i]));
    series->get_DataPoints()->AddDataPointForScatterSeries(xCell, yCell);
}

auto trendline = series->get_TrendLines()->Add(TrendlineType::Linear);
trendline->set_DisplayEquation(true);
trendline->set_Backward(1);

presentation->Save(u"AutomaticIntercept.pptx", SaveFormat::Pptx);

trendline->set_Intercept(100);
presentation->Save(u"FixedIntercept.pptx", SaveFormat::Pptx);
以自動計算方式,這些資料產生 y = 30x + 140。將截距設定為 100 則大約產生 y = 43.33x + 100:零點的擬合值符合已知基線,但此時線條不再通過每個資料點。
| 自動截距 | 固定截距 100 |
|---|---|
 |
 |
兩張影像使用相同的資料與座標軸比例。趨勢線皆向 X = 0 延伸,以顯示其截距。
預設情況下,屬性值為 std::numeric_limits<double>::quiet_NaN(),代表截距未指定,而非零。此時會自動根據資料計算截距。
新增自訂線
自訂線是一條繪製於圖表之上的形狀,而非根據系列資料計算出的趨勢線。此範例使用 IShapeCollection::AddAutoShape 在圖表上方的投影片中加入水平線。線條位置以投影片座標(點為單位)指定,起點位於圖表左邊緣且位於圖表中部。其寬度與圖表寬度相同。透過 IShape::get_LineFormat 取得的線條格式將線條設定為實心紅色。
#include <system/shared_ptr.h>
#include <drawing/color.h>
#include <DOM/Presentation.h>
#include <DOM/ISlide.h>
#include <DOM/IShapeCollection.h>
#include <DOM/IAutoShape.h>
#include <DOM/ShapeType.h>
#include <DOM/ILineFormat.h>
#include <DOM/IFillFormat.h>
#include <DOM/IColorFormat.h>
#include <DOM/FillType.h>
#include <DOM/IChart.h>
#include <DOM/Chart/ChartType.h>
#include <Export/SaveFormat.h>

using namespace System;
using namespace System::Drawing;
using namespace Aspose::Slides;
using namespace Aspose::Slides::Charts;
using namespace Aspose::Slides::Export;

auto presentation = MakeObject<Presentation>();
auto slide = presentation->get_Slide(0);

auto chart = slide->get_Shapes()->AddChart(ChartType::ClusteredColumn, 100, 100, 500, 400);

auto line = slide->get_Shapes()->AddAutoShape(ShapeType::Line, chart->get_X(), chart->get_Y() + chart->get_Height() / 2, chart->get_Width(), 0);
line->get_LineFormat()->get_FillFormat()->set_FillType(FillType::Solid);
line->get_LineFormat()->get_FillFormat()->get_SolidFillColor()->set_Color(Color::get_Red());

presentation->Save(u"AddCustomLines.pptx", SaveFormat::Pptx);
常見問題
「前向」與「後向」對於趨勢線意味著什麼?
它們是趨勢線向前或向後延伸的長度:對於散佈 (XY) 圖表,以座標軸單位表示;對於非散佈圖表,以類別數表示。僅接受非負值。
在將簡報匯出為 PDF 或 SVG,或將投影片渲染為影像時,趨勢線會被保留嗎?
會。Aspose.Slides 可將簡報轉換為 PDF 或 SVG,並將圖表渲染為影像;作為圖表一部分的趨勢線在這些操作中會被保留。亦提供將圖表本身匯出為影像的方式,請參考 export an image of the chart。