Analyzing your prompt, please hold on...
An error occurred while retrieving the results. Please refresh the page and try again.
In what scenario would we need to set a localized region for a chart?
When you open an XLSX file with a chart in Excel, suppose you open it with a Spanish regional setting, you can see the elements in the chart area, such as Chart Title and Legend, translated into Spanish. But when you save this chart as a picture with Aspose.Cells, you may encounter the following issue:
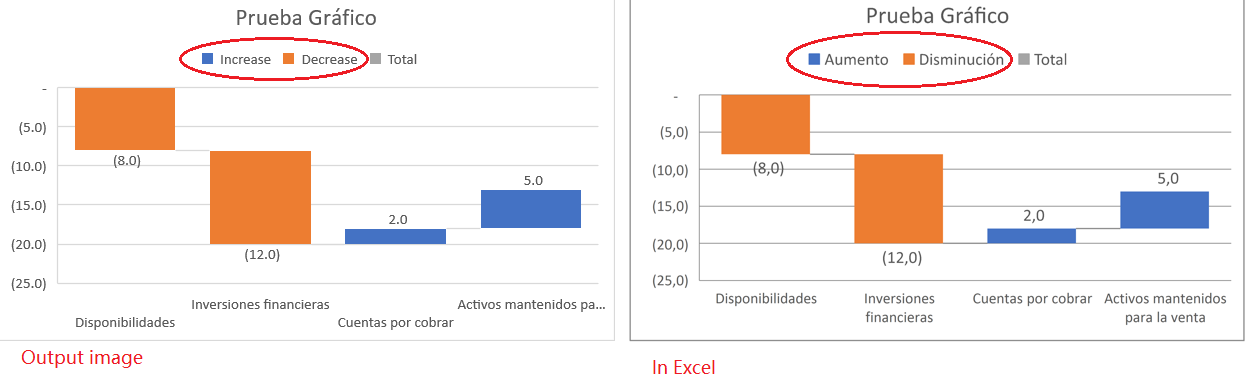
In this scenario, the Chart Legend in the output picture is not the same as in Excel; it remains displayed in English by default. You can solve this issue by setting a localized region for the chart. With the correct settings, the following elements will be rendered according to your localization settings.
The following elements in a chart can be rendered according to your localization settings.
| Supported elements | Default value in the English environment |
|---|---|
| Axis Title Name | Axis Title |
| Axis Unit Name | Hundreds, Thousands… |
| Chart Title Name | Chart Title |
| Legend Increase Name | Increase |
| Legend Decrease Name | Decrease |
| Legend Total Name | Total |
| Other Name | Other |
| Series Name | Series |
The following example will show you in detail how to set a localized region to achieve the desired effect.
Analyzing your prompt, please hold on...
An error occurred while retrieving the results. Please refresh the page and try again.