Analyzing your prompt, please hold on...
An error occurred while retrieving the results. Please refresh the page and try again.
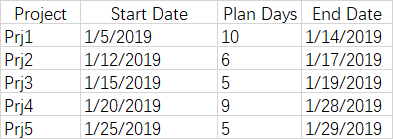
A Gantt chart is a type of bar chart that illustrates a project schedule. It shows the start and finish dates of the various elements of a project. Each task or activity is represented by a bar, with its length corresponding to its duration. Gantt charts also indicate dependencies between tasks, allowing project managers to visualize the sequence in which tasks need to be completed. They are widely used in project management to plan, schedule, and track projects effectively.
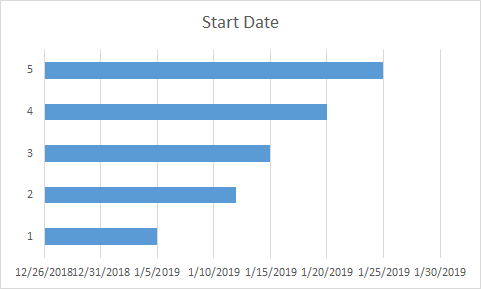
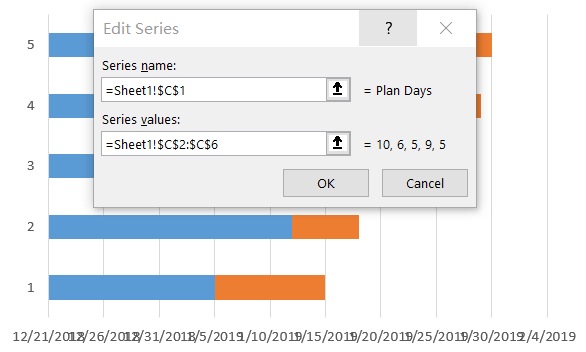
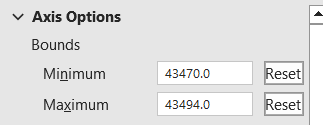
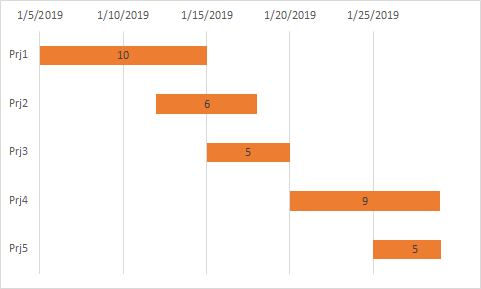
You can create a Gantt chart in Excel by following these steps:
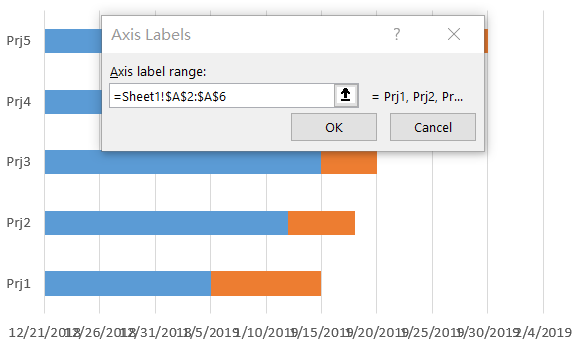
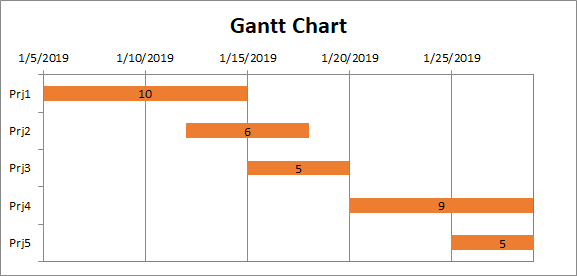
Please see the following sample code. It loads the sample Excel file that contains some sample data. It then creates the stacked bar chart based on the initial data and sets relevant properties. Finally, it saves the workbook to output XLSX format. The following screenshot shows the Gantt chart created by Aspose.Cells in the output Excel file.
Analyzing your prompt, please hold on...
An error occurred while retrieving the results. Please refresh the page and try again.