Analyzing your prompt, please hold on...
An error occurred while retrieving the results. Please refresh the page and try again.
This paragraph will tell you how to create a stock chart, which includes four types:
Stock charts are a specific chart used to track the changes in price of traded assets. Assets such commodities, stocks and cryptocurrencies. They allow you see high and low values over time, along with opening and closing values in the one chart. Aspose.Cells offers 4 stock charts and to use these, you must have the right sets of data available and you must select the columns in the right order.
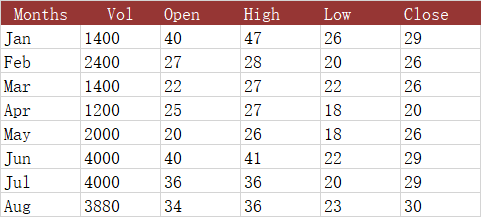
The following dataset shows the daily trading information for a stock. We will use this data to create four types of stock charts: High-Low-Close (HLC) stock chart, Open-High-Low-Close (OHLC) chart, Volume-High-Low-Close (VHLC) stock chart, and Volume-Open-High-Low-Close (VOHLC) stock chart..
Analyzing your prompt, please hold on...
An error occurred while retrieving the results. Please refresh the page and try again.