Analyzing your prompt, please hold on...
An error occurred while retrieving the results. Please refresh the page and try again.
To demonstrate the usage of Aspose.Cells for .NET API to create a pie chart with leader lines, we will first create a new Workbook and input some data that will serve as the series data source. Once the data is in place, we will add a Chart of type ChartType.Pie to the collection of charts and set its different aspects to get the desired chart view.
So far we have created a pie chart and set its different aspects. Now we are going to turn on the leader lines for the chart. Please note that to show the leader lines, we have to move the data labels a little.
The following piece of code turns on the leader lines, refreshes the chart, and then calculates the data labels' positions to move them accordingly.
Finally, the following code saves the chart in image format and the workbook in XLSX format.
| Resultant Pie Chart |
|---|
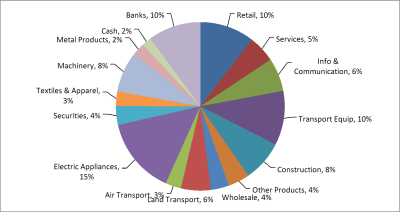 |
Analyzing your prompt, please hold on...
An error occurred while retrieving the results. Please refresh the page and try again.