Analyzing your prompt, please hold on...
An error occurred while retrieving the results. Please refresh the page and try again.
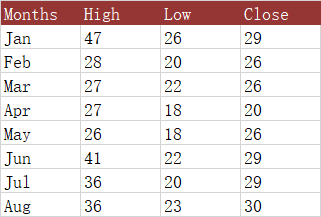
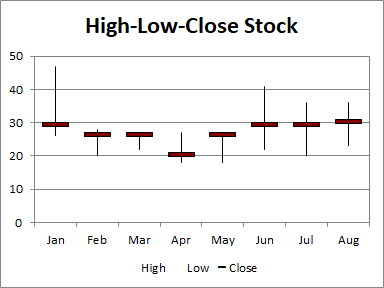
The High-Low-Close (HLC) stock chart uses four columns of data. The first column is a category, usually a date, but stock names can also be used. The next three columns, in order, are for high, low, and closing prices. The range of prices for each category is indicated by a vertical line from low to high, and the closing price is shown using a tick mark extending to the right of this line.
Sometimes, to make the chart look more intuitive, we can modify the appearance of the marker (close) or make it display on the secondary axis.
The following sample code loads the sample Excel file and generates the output Excel file.
Analyzing your prompt, please hold on...
An error occurred while retrieving the results. Please refresh the page and try again.