
Správa datových popisků v prezentacích pomocí C++
Úvod
Datové popisky zobrazují informace o sériích grafu a jednotlivých datových bodech, což čtenářům pomáhá rozpoznat hodnoty a porozumět grafu. Tento článek vysvětluje, jak formátovat hodnoty, zobrazovat procenta, číst text popisku, ovládat popisky nad maximem osy, upravit rozestup popisků kategoriální osy a umístit popisky koláčového grafu.
Nastavení přesnosti dat v popiscích grafu
Použijte set_NumberFormatOfValues k formátování hodnot sérií. Tento příklad vytvoří čárový graf s výchozími daty, zobrazí jeho datovou tabulku a povolí popisky hodnot pro první sérii. Formát #,##0.00 zobrazuje oddělovač tisíců a dvě desetinná místa, aniž by měnil podkladové hodnoty.
#include <DOM/Presentation.h>
#include <DOM/ISlide.h>
#include <DOM/IShapeCollection.h>
#include <DOM/IChart.h>
#include <DOM/Chart/ChartType.h>
#include <DOM/Chart/IChartData.h>
#include <DOM/Chart/IChartSeriesCollection.h>
#include <DOM/Chart/IChartSeries.h>
#include <DOM/Chart/IDataLabelCollection.h>
#include <DOM/Chart/IDataLabelFormat.h>
#include <Export/SaveFormat.h>
#include <system/smart_ptr.h>
#include <system/string.h>

using namespace Aspose::Slides;
using namespace Aspose::Slides::Charts;
using namespace Aspose::Slides::Export;
using namespace System;

auto presentation = MakeObject<Presentation>();
auto slide = presentation->get_Slide(0);

auto chart = slide->get_Shapes()->AddChart(ChartType::Line, 50, 50, 450, 300);
chart->set_HasDataTable(true);

auto series = chart->get_ChartData()->get_Series()->idx_get(0);
series->set_NumberFormatOfValues(u"#,##0.00");
series->get_Labels()->get_DefaultDataLabelFormat()->set_ShowValue(true);

presentation->Save(u"PrecisionOfDatalabels_out.pptx", SaveFormat::Pptx);
Zobrazit procenta jako popisky
Pro sloupcový graf se zásobníkem vypočítejte každou hodnotu jako procento celkové hodnoty kategorie a přiřaďte text do textového rámce vráceného metodou get_TextFrameForOverriding. Tento příklad používá výchozí data grafu a zobrazuje procenta se dvěma desetinnými místy v písmu velikosti 8 bodů. Kategorie s celkovou hodnotou nula se přeskočí, aby nedošlo k dělení nulou. Přepočítejte vlastní text popisku, pokud se data grafu změní.
#include <DOM/Presentation.h>
#include <DOM/ISlide.h>
#include <DOM/IShapeCollection.h>
#include <DOM/IChart.h>
#include <DOM/Chart/ChartType.h>
#include <DOM/Chart/IChartData.h>
#include <DOM/Chart/IChartCategoryCollection.h>
#include <DOM/Chart/IChartSeriesCollection.h>
#include <DOM/Chart/IChartSeries.h>
#include <DOM/Chart/IChartDataPointCollection.h>
#include <DOM/Chart/IChartDataPoint.h>
#include <DOM/Chart/IDoubleChartValue.h>
#include <DOM/Chart/IDataLabel.h>
#include <DOM/Chart/IDataLabelCollection.h>
#include <DOM/Chart/IDataLabelFormat.h>
#include <DOM/Portion.h>
#include <DOM/IPortionFormat.h>
#include <DOM/ITextFrame.h>
#include <DOM/IParagraph.h>
#include <DOM/IParagraphCollection.h>
#include <DOM/IPortionCollection.h>
#include <system/convert.h>
#include <vector>
#include <Export/SaveFormat.h>
#include <system/smart_ptr.h>
#include <system/string.h>

using namespace Aspose::Slides;
using namespace Aspose::Slides::Charts;
using namespace Aspose::Slides::Export;
using namespace System;

auto presentation = MakeObject<Presentation>();
auto slide = presentation->get_Slide(0);

auto chart = slide->get_Shapes()->AddChart(ChartType::StackedColumn, 20, 20, 400, 400);

auto categoryTotals = std::vector<double>(chart->get_ChartData()->get_Categories()->get_Count(), 0.0);
for (auto k = 0; k < chart->get_ChartData()->get_Categories()->get_Count(); k++)
{
    for (auto i = 0; i < chart->get_ChartData()->get_Series()->get_Count(); i++)
    {
        auto series = chart->get_ChartData()->get_Series()->idx_get(i);
        auto pointValue = Convert::ToDouble(series->get_DataPoint(k)->get_Value()->get_Data());
        categoryTotals[k] += pointValue;
    }
}

for (auto x = 0; x < chart->get_ChartData()->get_Series()->get_Count(); x++)
{
    auto series = chart->get_ChartData()->get_Series()->idx_get(x);
    series->get_Labels()->get_DefaultDataLabelFormat()->set_ShowLegendKey(false);

    for (auto j = 0; j < series->get_DataPoints()->get_Count(); j++)
    {
        auto label = series->get_DataPoint(j)->get_Label();
        if (categoryTotals[j] == 0)
        {
            continue;
        }

        auto pointValue = Convert::ToDouble(series->get_DataPoint(j)->get_Value()->get_Data());
        auto dataPointPercent = (pointValue / categoryTotals[j]) * 100;

        auto portion = MakeObject<Portion>();
        portion->set_Text(String::Format(u"{0:F2} %", dataPointPercent));
        portion->get_PortionFormat()->set_FontHeight(8.0f);

        label->get_TextFrameForOverriding()->set_Text(u"");

        auto paragraph = label->get_TextFrameForOverriding()->get_Paragraphs()->idx_get(0);
        paragraph->get_Portions()->Add(portion);

        label->get_DataLabelFormat()->set_ShowValue(true);
        label->get_DataLabelFormat()->set_ShowSeriesName(false);
        label->get_DataLabelFormat()->set_ShowPercentage(false);
        label->get_DataLabelFormat()->set_ShowLegendKey(false);
        label->get_DataLabelFormat()->set_ShowCategoryName(false);
        label->get_DataLabelFormat()->set_ShowBubbleSize(false);
    }
}

presentation->Save(u"DisplayPercentageAsLabels_out.pptx", SaveFormat::Pptx);
Nastavit znak procenta v popiscích grafu
Když jsou hodnoty uloženy jako zlomky, použijte set_NumberFormat k zobrazení procent. Předávejte false metodě set_IsNumberFormatLinkedToSource, aby se formát popisku použil nezávisle na zdrojových buňkách.
Tento příklad vytvoří 100 % zásobníkový sloupcový graf se červenou a modrou sérií napříč čtyřmi kategoriemi. Každý pár hodnot sečte na 1. Formát popisku 0.0% zobrazí 0,30 jako 30,0 %, zatímco vertikální osa používá dvě desetinná místa. Obě série používají bílé popisky velikosti 10 bodů.
#include <DOM/Presentation.h>
#include <DOM/ISlide.h>
#include <DOM/IShapeCollection.h>
#include <DOM/IChart.h>
#include <DOM/Chart/ChartType.h>
#include <DOM/Chart/IAxesManager.h>
#include <DOM/Chart/IAxis.h>
#include <DOM/Chart/IChartData.h>
#include <DOM/Chart/IChartCategoryCollection.h>
#include <DOM/Chart/IChartDataWorkbook.h>
#include <DOM/Chart/IChartDataCell.h>
#include <DOM/Chart/IChartSeriesCollection.h>
#include <DOM/Chart/IChartSeries.h>
#include <DOM/Chart/IChartDataPointCollection.h>
#include <DOM/Chart/IFormat.h>
#include <DOM/Chart/IDataLabelCollection.h>
#include <DOM/Chart/IDataLabelFormat.h>
#include <DOM/Chart/IChartTextFormat.h>
#include <DOM/Chart/IChartPortionFormat.h>
#include <DOM/FillType.h>
#include <DOM/IFillFormat.h>
#include <DOM/IColorFormat.h>
#include <drawing/color.h>
#include <system/object_ext.h>
#include <Export/SaveFormat.h>
#include <system/smart_ptr.h>
#include <system/string.h>

using namespace Aspose::Slides;
using namespace Aspose::Slides::Charts;
using namespace Aspose::Slides::Export;
using namespace System;
using namespace System::Drawing;

auto presentation = MakeObject<Presentation>();
auto slide = presentation->get_Slide(0);

auto chart = slide->get_Shapes()->AddChart(ChartType::PercentsStackedColumn, 20, 20, 500, 400);

chart->get_Axes()->get_VerticalAxis()->set_IsNumberFormatLinkedToSource(false);
chart->get_Axes()->get_VerticalAxis()->set_NumberFormat(u"0.00%");

chart->get_ChartData()->get_Series()->Clear();
chart->get_ChartData()->get_Categories()->Clear();

auto workbook = chart->get_ChartData()->get_ChartDataWorkbook();
auto worksheetIndex = 0;
for (auto i = 0; i < 4; i++)
{
    auto categoryCell = workbook->GetCell(worksheetIndex, i + 1, 0, ObjectExt::Box(String::Format(u"Category {0}", i + 1)));
    chart->get_ChartData()->get_Categories()->Add(categoryCell);
}

String seriesNames[] = { u"Reds", u"Blues" };
Color seriesColors[] = { Color::get_Red(), Color::get_Blue() };
double values[2][4] = { { 0.30, 0.50, 0.80, 0.65 }, { 0.70, 0.50, 0.20, 0.35 } };

for (auto i = 0; i < 2; i++)
{
    auto seriesCell = workbook->GetCell(worksheetIndex, 0, i + 1, ObjectExt::Box(seriesNames[i]));
    auto series = chart->get_ChartData()->get_Series()->Add(seriesCell, chart->get_Type());
    for (auto j = 0; j < 4; j++)
    {
        auto valueCell = workbook->GetCell(worksheetIndex, j + 1, i + 1, ObjectExt::Box(values[i][j]));
        series->get_DataPoints()->AddDataPointForBarSeries(valueCell);
    }

    series->get_Format()->get_Fill()->set_FillType(FillType::Solid);
    series->get_Format()->get_Fill()->get_SolidFillColor()->set_Color(seriesColors[i]);

    auto labelFormat = series->get_Labels()->get_DefaultDataLabelFormat();
    labelFormat->set_ShowValue(true);
    labelFormat->set_IsNumberFormatLinkedToSource(false);
    labelFormat->set_NumberFormat(u"0.0%");
    labelFormat->get_TextFormat()->get_PortionFormat()->set_FontHeight(10);
    labelFormat->get_TextFormat()->get_PortionFormat()->get_FillFormat()->set_FillType(FillType::Solid);
    labelFormat->get_TextFormat()->get_PortionFormat()->get_FillFormat()->get_SolidFillColor()->set_Color(Color::get_White());
}

presentation->Save(u"SetDataLabelsPercentageSign_out.pptx", SaveFormat::Pptx);
Přečíst skutečný text datových popisků
Použijte GetActualLabelText k získání textu vytvořeného nastavením datového popisku. To je užitečné při extrahování popisků pro zprávy, prohledávání obsahu prezentace nebo ověřování vygenerovaných grafů. V níže uvedeném příkladu výchozí formát datového popisku kombinuje název každé kategorie, název série a hodnotu. Jeden bod formátuje svou hodnotu jako procento a jiný používá vlastní text z get_TextFrameForOverriding.
#include <DOM/Presentation.h>
#include <DOM/ISlide.h>
#include <DOM/IShapeCollection.h>
#include <DOM/IChart.h>
#include <DOM/Chart/ChartType.h>
#include <DOM/Chart/IChartData.h>
#include <DOM/Chart/IChartCategoryCollection.h>
#include <DOM/Chart/IChartDataWorkbook.h>
#include <DOM/Chart/IChartDataCell.h>
#include <DOM/Chart/IChartSeriesCollection.h>
#include <DOM/Chart/IChartSeries.h>
#include <DOM/Chart/IChartDataPointCollection.h>
#include <DOM/Chart/IChartDataPoint.h>
#include <DOM/Chart/IDoubleChartValue.h>
#include <DOM/Chart/IDataLabel.h>
#include <DOM/Chart/IDataLabelCollection.h>
#include <DOM/Chart/IDataLabelFormat.h>
#include <DOM/ITextFrame.h>
#include <system/console.h>
#include <system/object_ext.h>
#include <system/smart_ptr.h>
#include <system/string.h>

using namespace Aspose::Slides;
using namespace Aspose::Slides::Charts;
using namespace System;

auto presentation = MakeObject<Presentation>();
auto slide = presentation->get_Slide(0);

auto chart = slide->get_Shapes()->AddChart(ChartType::ClusteredColumn, 20, 20, 500, 300);

chart->get_ChartData()->get_Series()->Clear();
chart->get_ChartData()->get_Categories()->Clear();

auto workbook = chart->get_ChartData()->get_ChartDataWorkbook();
auto firstCategoryCell = workbook->GetCell(0, 1, 0, ObjectExt::Box<String>(u"Q1"));
chart->get_ChartData()->get_Categories()->Add(firstCategoryCell);
auto secondCategoryCell = workbook->GetCell(0, 2, 0, ObjectExt::Box<String>(u"Q2"));
chart->get_ChartData()->get_Categories()->Add(secondCategoryCell);

auto northSeriesCell = workbook->GetCell(0, 0, 1, ObjectExt::Box<String>(u"North"));
auto north = chart->get_ChartData()->get_Series()->Add(northSeriesCell, chart->get_Type());
auto northFirstValueCell = workbook->GetCell(0, 1, 1, ObjectExt::Box(0.25));
north->get_DataPoints()->AddDataPointForBarSeries(northFirstValueCell);
auto northSecondValueCell = workbook->GetCell(0, 2, 1, ObjectExt::Box(0.75));
north->get_DataPoints()->AddDataPointForBarSeries(northSecondValueCell);

auto southSeriesCell = workbook->GetCell(0, 0, 2, ObjectExt::Box<String>(u"South"));
auto south = chart->get_ChartData()->get_Series()->Add(southSeriesCell, chart->get_Type());
auto southFirstValueCell = workbook->GetCell(0, 1, 2, ObjectExt::Box(0.40));
south->get_DataPoints()->AddDataPointForBarSeries(southFirstValueCell);
auto southSecondValueCell = workbook->GetCell(0, 2, 2, ObjectExt::Box(0.60));
south->get_DataPoints()->AddDataPointForBarSeries(southSecondValueCell);

for (auto i = 0; i < chart->get_ChartData()->get_Series()->get_Count(); i++)
{
    auto series = chart->get_ChartData()->get_Series()->idx_get(i);
    auto format = series->get_Labels()->get_DefaultDataLabelFormat();
    format->set_ShowCategoryName(true);
    format->set_ShowSeriesName(true);
    format->set_ShowValue(true);
}

north->get_Label(1)->get_DataLabelFormat()->set_IsNumberFormatLinkedToSource(false);
north->get_Label(1)->get_DataLabelFormat()->set_NumberFormat(u"0%");
south->get_Label(0)->get_TextFrameForOverriding()->set_Text(u"Reviewed");

for (auto i = 0; i < chart->get_ChartData()->get_Series()->get_Count(); i++)
{
    auto series = chart->get_ChartData()->get_Series()->idx_get(i);
    for (auto j = 0; j < series->get_DataPoints()->get_Count(); j++)
    {
        auto point = series->get_DataPoint(j);
        auto label = point->get_Label();
        if (!label->get_IsVisible())
        {
            continue;
        }

        Console::WriteLine(String::Format(u"Value: {0}; label: {1}", point->get_Value()->get_Data(), label->GetActualLabelText()));
    }
}
Číslo uložené v datovém bodu zůstává 0.75, i když jeho popisek zobrazuje 75% spolu s názvem kategorie a série. Vlastní text nahrazuje vygenerovaný text popisku. GetActualLabelText vrací výsledný řetězec popisku v obou případech. Zkontrolujte get_IsVisible samostatně, jak je uvedeno výše, pokud chcete extrahovat pouze viditelné popisky.
Ovládání datových popisků nad maximem osy
Když omezíte rozsah osy ručně, některé datové body mohou překročit její maximum. Použijte set_ShowDataLabelsOverMaximum k řízení, zda se jejich datové popisky zobrazí. Toto nastavení mění viditelnost popisků; nemění rozsah osy ani podkladové datové hodnoty.
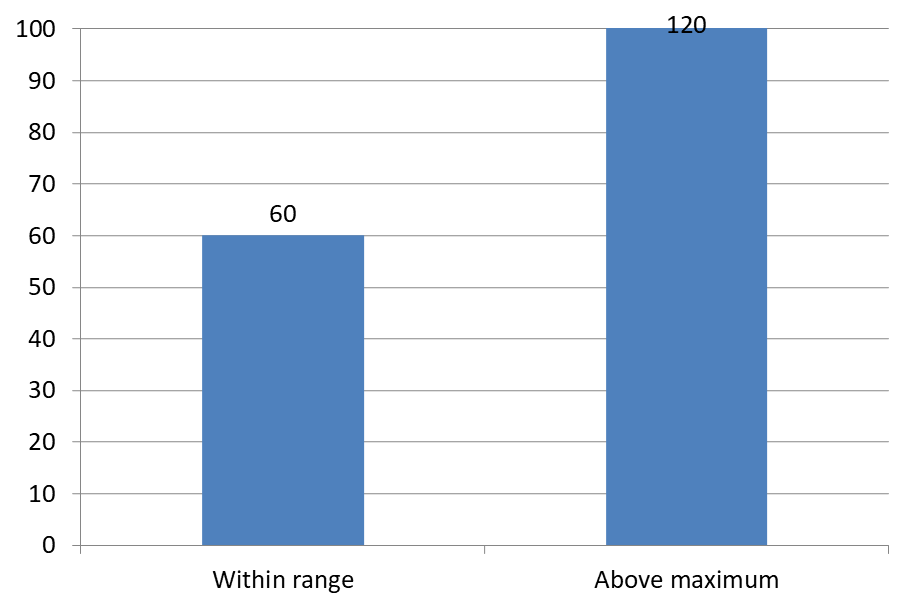
Níže uvedený příklad vytvoří 2D seskupený sloupcový graf s hodnotami 60 a 120. Nastaví set_IsAutomaticMaxValue na false a set_MaxValue na 100 na vertikální ose. První snímek umožňuje popisky nad maximem; kopie toho snímku je zakáže. Oba snímky jsou uloženy v DataLabelsOverMaximum.pptx.
Povolte popisky hodnot pomocí set_ShowValue. Nastavení na úrovni grafu samo o sobě neaktivuje zobrazení hodnot ani nepřepíše vypnuté zobrazení hodnot u jednotlivých popisků. Tento příklad povoluje hodnoty pro celou sérii a používá set_Position k umístění popisků na vnější konec každého sloupce.
#include <DOM/Presentation.h>
#include <DOM/ISlide.h>
#include <DOM/ISlideCollection.h>
#include <DOM/IShapeCollection.h>
#include <DOM/IChart.h>
#include <DOM/Chart/ChartType.h>
#include <DOM/Chart/IAxesManager.h>
#include <DOM/Chart/IAxis.h>
#include <DOM/Chart/IChartData.h>
#include <DOM/Chart/IChartCategoryCollection.h>
#include <DOM/Chart/IChartDataWorkbook.h>
#include <DOM/Chart/IChartDataCell.h>
#include <DOM/Chart/IChartSeriesCollection.h>
#include <DOM/Chart/IChartSeries.h>
#include <DOM/Chart/IChartDataPointCollection.h>
#include <DOM/Chart/IDataLabelCollection.h>
#include <DOM/Chart/IDataLabelFormat.h>
#include <DOM/Chart/LegendDataLabelPosition.h>
#include <Export/SaveFormat.h>
#include <system/object_ext.h>
#include <system/smart_ptr.h>
#include <system/string.h>

using namespace Aspose::Slides;
using namespace Aspose::Slides::Charts;
using namespace Aspose::Slides::Export;
using namespace System;

auto presentation = MakeObject<Presentation>();
auto slide = presentation->get_Slide(0);

auto chart = slide->get_Shapes()->AddChart(ChartType::ClusteredColumn, 50, 50, 600, 400);
chart->set_HasLegend(false);

chart->get_ChartData()->get_Series()->Clear();
chart->get_ChartData()->get_Categories()->Clear();

auto workbook = chart->get_ChartData()->get_ChartDataWorkbook();

auto firstCategory = workbook->GetCell(0, 1, 0, ObjectExt::Box<String>(u"Within range"));
auto secondCategory = workbook->GetCell(0, 2, 0, ObjectExt::Box<String>(u"Above maximum"));

chart->get_ChartData()->get_Categories()->Add(firstCategory);
chart->get_ChartData()->get_Categories()->Add(secondCategory);

auto seriesName = workbook->GetCell(0, 0, 1, ObjectExt::Box<String>(u"Values"));
auto series = chart->get_ChartData()->get_Series()->Add(seriesName, chart->get_Type());

auto firstValue = workbook->GetCell(0, 1, 1, ObjectExt::Box(60));
auto secondValue = workbook->GetCell(0, 2, 1, ObjectExt::Box(120));

series->get_DataPoints()->AddDataPointForBarSeries(firstValue);
series->get_DataPoints()->AddDataPointForBarSeries(secondValue);

series->get_Labels()->get_DefaultDataLabelFormat()->set_ShowValue(true);
series->get_Labels()->get_DefaultDataLabelFormat()->set_Position(LegendDataLabelPosition::OutsideEnd);

chart->get_Axes()->get_VerticalAxis()->set_IsAutomaticMaxValue(false);
chart->get_Axes()->get_VerticalAxis()->set_MaxValue(100);
chart->set_ShowDataLabelsOverMaximum(true);

auto secondSlide = presentation->get_Slides()->AddClone(slide);
auto secondChart = ExplicitCast<IChart>(secondSlide->get_Shape(0));
secondChart->set_ShowDataLabelsOverMaximum(false);

presentation->Save(u"DataLabelsOverMaximum.pptx", SaveFormat::Pptx);
Následující obrázky ukazují uložené snímky vykreslené v Microsoft PowerPointu. S true je popisek 120 viditelný na horní hranici; s false je skrytý. Popisek 60 zůstává viditelný, maximum osy zůstává na 100 a druhý datový bod zůstává 120 v obou případech.
| ShowDataLabelsOverMaximum = true | ShowDataLabelsOverMaximum = false |
|---|---|
 |
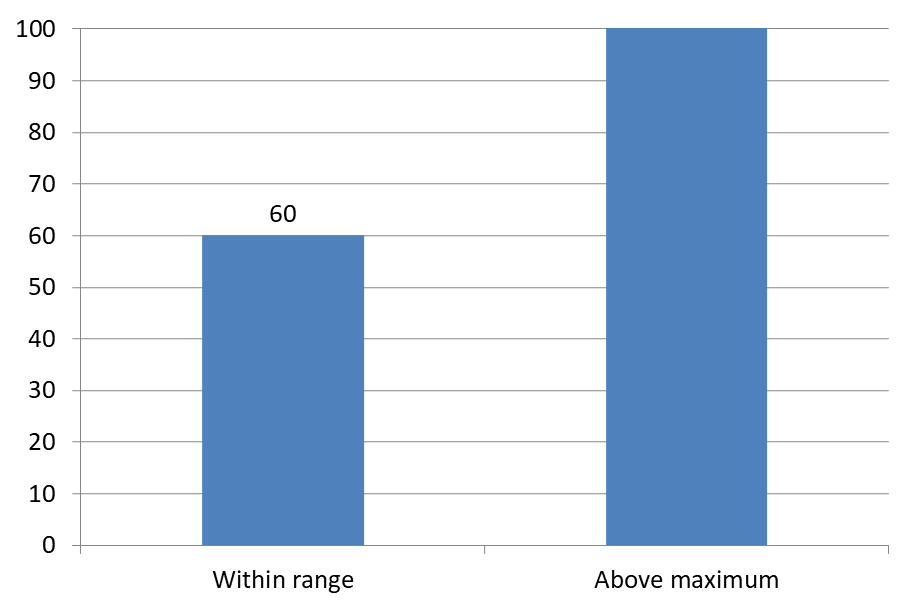 |
Chart Type
Tento příklad používá 2D sloupcový graf s hodnotovou osou. Grafy bez hodnotové osy, jako jsou koláčové a prstencové grafy, nemají maximum osy, které by bylo možné tímto způsobem omezit.Nastavit vzdálenost popisku od osy
Použijte set_LabelOffset k řízení vzdálenosti mezi popisky kategoriální osy a samotnou osou. Hodnota je procento maximální velikosti písma popisků osy. Tento příklad vytvoří seskupený sloupcový graf a nastaví offset popisků horizontální osy na 500. Toto nastavení ovlivňuje popisky kategoriální osy, nikoli popisky připojené k jednotlivým datovým bodům.
#include <DOM/Presentation.h>
#include <DOM/ISlide.h>
#include <DOM/IShapeCollection.h>
#include <DOM/IChart.h>
#include <DOM/Chart/ChartType.h>
#include <DOM/Chart/IAxesManager.h>
#include <DOM/Chart/IAxis.h>
#include <Export/SaveFormat.h>
#include <system/smart_ptr.h>
#include <system/string.h>

using namespace Aspose::Slides;
using namespace Aspose::Slides::Charts;
using namespace Aspose::Slides::Export;
using namespace System;

auto presentation = MakeObject<Presentation>();
auto slide = presentation->get_Slide(0);

auto chart = slide->get_Shapes()->AddChart(ChartType::ClusteredColumn, 20, 20, 500, 300);
chart->get_Axes()->get_HorizontalAxis()->set_LabelOffset(500);

presentation->Save(u"SetCategoryAxisLabelDistance_out.pptx", SaveFormat::Pptx);
Upravit umístění popisku
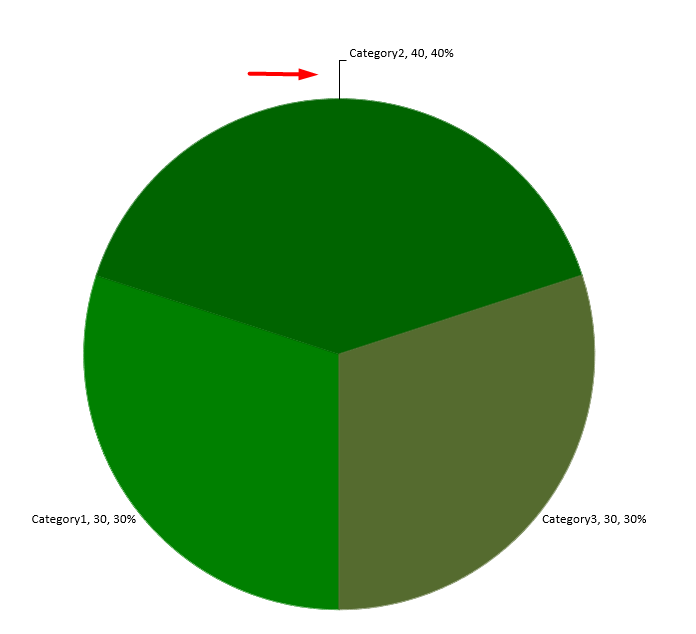
V koláčovém grafu upravte umístění datových popisků, aby se zlepšil rozestup a vytvořil prostor pro čáry popisovačů.
Tento příklad zobrazí hodnotu prvního datového bodu, umístí jeho popisek mimo výseč a používá set_X a set_Y k úpravě jeho offsetů. Tyto offsety jsou relativní k šířce a výšce grafu.
#include <DOM/Presentation.h>
#include <DOM/ISlide.h>
#include <DOM/IShapeCollection.h>
#include <DOM/IChart.h>
#include <DOM/Chart/ChartType.h>
#include <DOM/Chart/IChartData.h>
#include <DOM/Chart/IChartSeriesCollection.h>
#include <DOM/Chart/IChartSeries.h>
#include <DOM/Chart/IDataLabel.h>
#include <DOM/Chart/IDataLabelFormat.h>
#include <DOM/Chart/LegendDataLabelPosition.h>
#include <Export/SaveFormat.h>
#include <system/smart_ptr.h>
#include <system/string.h>

using namespace Aspose::Slides;
using namespace Aspose::Slides::Charts;
using namespace Aspose::Slides::Export;
using namespace System;

auto presentation = MakeObject<Presentation>();
auto slide = presentation->get_Slide(0);

auto chart = slide->get_Shapes()->AddChart(ChartType::Pie, 50, 50, 200, 200);
auto series = chart->get_ChartData()->get_Series();

auto label = series->idx_get(0)->get_Label(0);
label->get_DataLabelFormat()->set_ShowValue(true);
label->get_DataLabelFormat()->set_Position(LegendDataLabelPosition::OutsideEnd);
label->set_X(0.71f);
label->set_Y(0.04f);

presentation->Save(u"presentation.pptx", SaveFormat::Pptx);
Přidat několik řádků datových popisků nad sloupcový graf
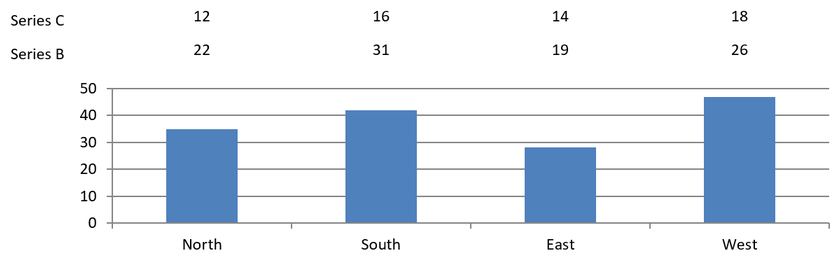
Tento příklad vytvoří sloupcový graf se dvěma řádky datových popisků nad oblastí vykreslení. Série A zobrazuje viditelné sloupce, zatímco série B a C poskytují dodatečné popisky. Jejich sloupce jsou skryty odstraněním výplně a obrysu. Metoda set_Overlap zarovnává všechny tři série na stejné středové body kategorií.
Nastavení get_PlotArea rezervuje prostor pro řádky popisků. Po výpočtu výchozích pozic metodou ValidateChartLayout set_X a set_Y zachovají horizontální zarovnání a aplikují vertikální offsety pro uspořádání popisků ve dvou řádcích. Čísla zůstávají datovými popisky propojenými s hodnotami sérií; pouze nadpisy řádků jsou samostatné textové tvary.
#include <DOM/Presentation.h>
#include <DOM/ISlide.h>
#include <DOM/IShapeCollection.h>
#include <DOM/IChart.h>
#include <DOM/Chart/ChartType.h>
#include <DOM/Chart/IChartData.h>
#include <DOM/Chart/IChartCategoryCollection.h>
#include <DOM/Chart/IChartDataWorkbook.h>
#include <DOM/Chart/IChartDataCell.h>
#include <DOM/Chart/IChartSeriesCollection.h>
#include <DOM/Chart/IChartSeries.h>
#include <DOM/Chart/IChartDataPointCollection.h>
#include <DOM/Chart/IChartDataPoint.h>
#include <DOM/Chart/IChartSeriesGroup.h>
#include <DOM/Chart/IFormat.h>
#include <DOM/Chart/IDataLabelCollection.h>
#include <DOM/Chart/IDataLabelFormat.h>
#include <DOM/Chart/IDataLabel.h>
#include <DOM/Chart/IChartTextFormat.h>
#include <DOM/Chart/IChartPortionFormat.h>
#include <DOM/Chart/LegendDataLabelPosition.h>
#include <DOM/Chart/IAxesManager.h>
#include <DOM/Chart/IAxis.h>
#include <DOM/Chart/IChartPlotArea.h>
#include <DOM/Chart/LayoutTargetType.h>
#include <DOM/FillType.h>
#include <DOM/IFillFormat.h>
#include <DOM/ILineFormat.h>
#include <DOM/IColorFormat.h>
#include <DOM/ShapeType.h>
#include <DOM/IAutoShape.h>
#include <DOM/ITextFrame.h>
#include <DOM/ITextFrameFormat.h>
#include <DOM/IParagraphCollection.h>
#include <DOM/IParagraph.h>
#include <DOM/IPortionCollection.h>
#include <DOM/IPortion.h>
#include <DOM/IPortionFormat.h>
#include <Export/SaveFormat.h>
#include <drawing/color.h>
#include <system/object_ext.h>
#include <system/smart_ptr.h>
#include <system/string.h>

using namespace Aspose::Slides;
using namespace Aspose::Slides::Charts;
using namespace Aspose::Slides::Export;
using namespace System;
using namespace System::Drawing;

auto presentation = MakeObject<Presentation>();
auto slide = presentation->get_Slide(0);

auto chart = slide->get_Shapes()->AddChart(ChartType::ClusteredColumn, 40, 40, 640, 200);
chart->set_HasTitle(false);
chart->set_HasLegend(false);
chart->get_TextFormat()->get_PortionFormat()->set_FontHeight(12);

chart->get_ChartData()->get_Series()->Clear();
chart->get_ChartData()->get_Categories()->Clear();

auto workbook = chart->get_ChartData()->get_ChartDataWorkbook();
workbook->Clear(0);

String categories[] = { u"North", u"South", u"East", u"West" };
String seriesNames[] = { u"Series A", u"Series B", u"Series C" };
double seriesValues[3][4] = {
    { 35, 42, 28, 47 },
    { 22, 31, 19, 26 },
    { 12, 16, 14, 18 }
};

for (auto categoryIndex = 0; categoryIndex < 4; categoryIndex++)
{
    auto categoryCell = workbook->GetCell(0, categoryIndex + 1, 0, ObjectExt::Box(categories[categoryIndex]));
    chart->get_ChartData()->get_Categories()->Add(categoryCell);
}

for (auto seriesIndex = 0; seriesIndex < 3; seriesIndex++)
{
    auto seriesCell = workbook->GetCell(0, 0, seriesIndex + 1, ObjectExt::Box(seriesNames[seriesIndex]));
    auto series = chart->get_ChartData()->get_Series()->Add(seriesCell, ChartType::ClusteredColumn);

    for (auto categoryIndex = 0; categoryIndex < 4; categoryIndex++)
    {
        auto valueCell = workbook->GetCell(0, categoryIndex + 1, seriesIndex + 1, ObjectExt::Box(seriesValues[seriesIndex][categoryIndex]));
        series->get_DataPoints()->AddDataPointForBarSeries(valueCell);
    }

    if (seriesIndex > 0)
    {
        // Skrýt sloupce B a C, ale zachovat jejich datové popisky.
        series->get_Format()->get_Fill()->set_FillType(FillType::NoFill);
        series->get_Format()->get_Line()->get_FillFormat()->set_FillType(FillType::NoFill);
        auto labelFormat = series->get_Labels()->get_DefaultDataLabelFormat();
        labelFormat->set_ShowValue(true);
        labelFormat->get_TextFormat()->get_PortionFormat()->set_FontHeight(12);
        auto labelFill = labelFormat->get_TextFormat()->get_PortionFormat()->get_FillFormat();
        labelFill->set_FillType(FillType::Solid);
        labelFill->get_SolidFillColor()->set_Color(Color::get_Black());
        labelFormat->set_Position(LegendDataLabelPosition::InsideBase);
    }
}

// Zarovnat všechny tři série na stejné středy kategorií.
chart->get_ChartData()->get_Series()->idx_get(0)->get_ParentSeriesGroup()->set_Overlap(100);

// Použít méně mřížkových čar pro tento kompaktní příklad.
chart->get_Axes()->get_VerticalAxis()->set_IsAutomaticMajorUnit(false);
chart->get_Axes()->get_VerticalAxis()->set_MajorUnit(10);

// Rezervovat místo nad vykreslením pro dva řádky datových popisků.
chart->get_PlotArea()->set_LayoutTargetType(LayoutTargetType::Inner);
chart->get_PlotArea()->set_X(0.15f);
chart->get_PlotArea()->set_Y(0.32f);
chart->get_PlotArea()->set_Width(0.80f);
chart->get_PlotArea()->set_Height(0.48f);
chart->ValidateChartLayout();

for (auto seriesIndex = 1; seriesIndex < 3; seriesIndex++)
{
    auto series = chart->get_ChartData()->get_Series()->idx_get(seriesIndex);
    auto rowTop = seriesIndex == 1 ? 0.15f : 0.03f;

    for (auto categoryIndex = 0; categoryIndex < 4; categoryIndex++)
    {
        auto dataLabel = series->get_DataPoint(categoryIndex)->get_Label();
        // Zachovat výchozí vodorovnou pozici. Y je offset od
        // výchozí pozice popisku, vyjádřené jako zlomek výšky grafu.
        dataLabel->set_X(0);
        dataLabel->set_Y(rowTop - dataLabel->get_ActualY() / chart->get_Height());
    }

    // Pouze nadpis řádku je samostatný textový tvar.
    auto rowHeading = slide->get_Shapes()->AddAutoShape(ShapeType::Rectangle, chart->get_X(), chart->get_Y() + rowTop * chart->get_Height(), 85, 18);
    rowHeading->get_FillFormat()->set_FillType(FillType::NoFill);
    rowHeading->get_LineFormat()->get_FillFormat()->set_FillType(FillType::NoFill);
    rowHeading->AddTextFrame(seriesNames[seriesIndex]);
    rowHeading->get_TextFrame()->get_TextFrameFormat()->set_MarginTop(0);
    rowHeading->get_TextFrame()->get_TextFrameFormat()->set_MarginBottom(0);
    auto headingFormat = rowHeading->get_TextFrame()->get_Paragraphs()->idx_get(0)->get_Portions()->idx_get(0)->get_PortionFormat();
    headingFormat->set_FontHeight(12);
    headingFormat->get_FillFormat()->set_FillType(FillType::Solid);
    headingFormat->get_FillFormat()->get_SolidFillColor()->set_Color(Color::get_Black());
}

presentation->Save(u"multiple-rows-of-labels.pptx", SaveFormat::Pptx);
Často kladené otázky
Jak mohu zabránit překrývání datových popisků v hustých grafech?
Kombinujte automatické umístění popisků, čáry popisovačů a zmenšení velikosti písma; v případě potřeby skryjte některá pole (např. kategorii) nebo zobrazte popisky jen pro extrémní hodnoty či klíčové body.
Jak mohu zakázat popisky pouze pro nuly, záporné nebo prázdné hodnoty?
Filtrování datových bodů před povolením popisků a vypnutí jejich zobrazování pro hodnoty 0, záporné hodnoty nebo chybějící hodnoty podle definovaného pravidla.